


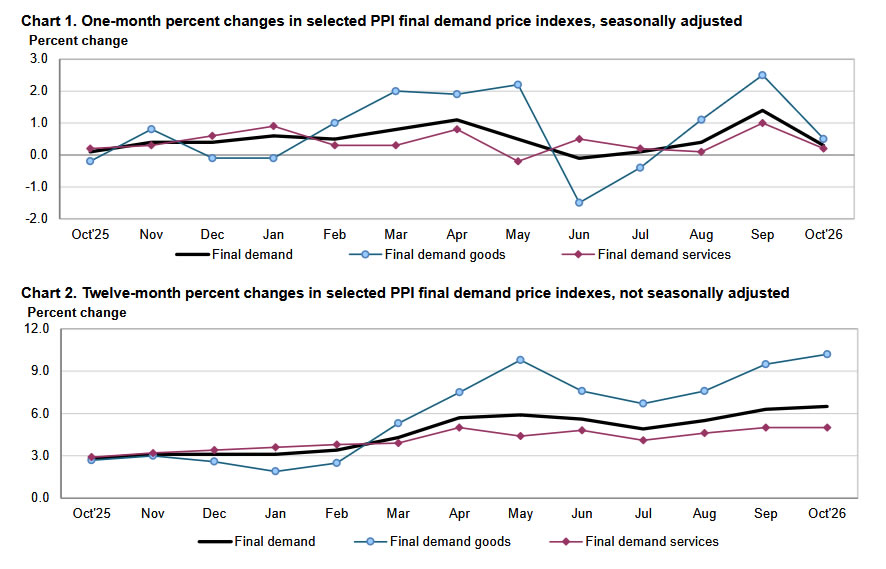
US producer prices rose 0.3% mom in October, slowing sharply from an upwardly revised 1.4% in September and coming in below market expectations of 0.4%, according to the Bureau of Labor Statistics. September’s increase was revised up from 1.3%. Despite the monthly moderation, annual PPI inflation accelerated from 6.3% to 6.5%, slightly below expectations of 6.6% but marking its highest level since November 2022. More importantly, the index excluding food, energy and trade services increased 0.5% mom for the second consecutive month, with its annual rate reaching 4.9%. The contrasting readings suggest that the sharp slowdown in headline producer inflation has yet to translate into convincing relief in underlying price pressures.
The moderation was evident across both goods and services, although important pockets of inflation persisted. Final demand goods prices slowed from 2.5% to 0.5% mom, with energy prices edging down 0.1%. However, food prices rose 1.3%, while goods excluding food and energy increased 0.5%, accounting for more than 60% of the overall goods price advance. Basic organic chemicals prices jumped 3.9%, even as diesel fuel fell 7.9%. Meanwhile, final demand services inflation eased from 1.0% to 0.2%, its fifth consecutive monthly increase. Transportation and warehousing costs rose 2.0%, led by a 3.9% increase in truck freight prices, which accounted for more than 80% of the overall rise in final demand services. Declining trade services margins provided a partial offset.
Further along the production chain, price developments also showed an uneven picture. Processed goods for intermediate demand increased 0.4% mom, while intermediate services prices rose 0.6%. In contrast, unprocessed goods prices declined 3.1%, primarily reflecting lower energy costs, including a 10.3% fall in crude petroleum prices. Nevertheless, annual inflation in processed intermediate goods reached 14.6%, while intermediate services prices were up 6.8% yoy, highlighting persistent cost pressures beyond raw energy inputs. Overall, October’s PPI offers some relief from September’s exceptionally strong monthly increase, but not clear evidence of a broad-based easing in producer inflation. The combination of firm underlying prices, elevated intermediate costs and accelerating annual inflation suggests that businesses continue facing substantial pricing pressures despite the softer headline reading.
Data Summary — US October 2026 PPI
| Indicator | Oct | Exp. | Sep |
|---|---|---|---|
| PPI Final Demand (mom) | +0.3% | +0.4% | +1.4% |
| PPI Final Demand (yoy) | +6.5% | +6.6% | +6.3% |
| Final Demand Goods (mom) | +0.5% | +2.5% | |
| Final Demand Services (mom) | +0.2% | +1.0% | |
| PPI ex-Food, Energy & Trade Services (mom) | +0.5% | +0.5% | |
| PPI ex-Food, Energy & Trade Services (yoy) | +4.9% |
September’s headline monthly PPI increase was revised upward from 1.3% to 1.4%.
Selected Components — October
| Component | Oct (mom) | Sep (mom) |
|---|---|---|
| Final Demand Foods | +1.3% | +1.1% |
| Final Demand Energy | -0.1% | +10.0% |
| Goods ex-Food & Energy | +0.5% | +0.3% |
| Transportation & Warehousing Services | +2.0% | +3.4% |
| Trade Services | -0.2% | +2.1% |
| Processed Intermediate Goods | +0.4% | +2.4% |
| Unprocessed Intermediate Goods | -3.1% | +6.3% |
| Intermediate Services | +0.6% | +1.0% |
Key Takeaways
- US PPI slowed sharply from 1.4% to 0.3% mom, undershooting forecasts, but annual inflation accelerated from 6.3% to 6.5%.
- Underlying producer inflation held at 0.5% mom, while non-energy goods and freight transportation continued recording substantial price increases.
- Lower raw energy costs provided relief, but elevated processed input and intermediate services inflation indicated persistent pressures across production chains.