
Sterling falls broadly today while smaller than expected GDP contraction didn’t ease recession worry. Euro is also weak following decline in Germany benchmark yield, but Yen was worse. Dollar, on the other hand, is trying to reverse this week’s losses, with help from the strong rebound in 10 year yield. But upside of the greenback is capped, especially against commodity currencies, on risk-on sentiment.
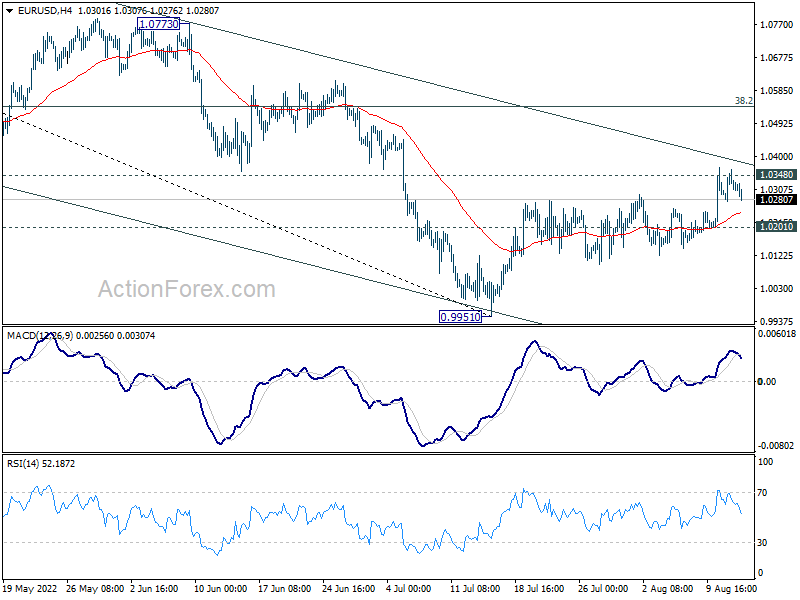
Technically, for now, it appears that EUR/USD struggles to break through 1.0348 support turned resistance with conviction. Rejection by this level, followed by break of 1.0201 support, will argue that recent rebound from 0.9951 has completed. And, larger down trend is ready to resume. This will be the focus from now till the early part of next week.
In Europe, at the time of writing, FTSE is up 0.32%. DAX is up 0.56%. CAC is up 0.23%. Germany 10-year yield is down -0.0001 at 0.973. Earlier in Asia, Nikkei rose 2.62%. Hong Kong HSI rose 0.46%. China Shanghai SSE dropped -0.15%> Singapore Strait Times dropped -0.99%. Japan 10-year JGB yield dropped -0.0037 to 0.189.
NIESR: UK economy entered recession in Q2, to stay there until Q1
NIESR projects the UK economy to contract -0.1% in Q2, with growth likely to slow further as inflation drags on consumer demand. UK appears to have entered a recession in Q2 already. It expects the recession to last until Q1 of 2023.
GDP growth is estimated at 3.5% in 2022 and 0.5% in 2023. It expects CPI inflation to peak close to 11% in Q3, and return to around 3% a year later, resulting from “slowing in energy price inflation, a tightening in monetary policy and falls in real incomes leading to falling demand”.
“It now looks like the UK economy entered a recession in the second quarter of this year as GDP fell by 0.1 per cent, and we expect output to continue falling over the next three quarters. On the expenditure side, the fall in Q2 was driven by a 0.2 per cent fall in consumption; on the output side, by a 0.4 per cent fall in services, particularly, health and social work. GDP fell by 0.6 per cent in June after a revised rise of 0.4 per cent in May as the Platinum Jubilee celebrations affected the monthly profiles.” Stephen Millard, Deputy Director for Macroeconomic Modelling and Forecasting, NIESR.
UK GDP down -0.6% mom in Jun, -0.1% qoq in Q2
UK GDP contracted -0.6% mom in June, better than expectation of -1.3% mom. All main sectors contributed negatively to the monthly GDP estimate. Services was the main contributor, down -0.5%. Production dropped -0.9% mom. while construction also fell by -1.4% mom. Monthly GDP was still 0.9% above its pre-coronavirus levels in February 2020.
For the whole of Q2, GDP contracted -0.1% qoq, above expectation of -0.2% qoq. The level of GDP was 2.9% yoy higher than Q2 2021. Also, compared with the same quarter a year ago, the implied GDP deflator rose by 6.0%, primarily reflecting the 7.3% increase in the price of household consumption expenditure, which is the fastest annual household deflator growth rate since 1991.
Eurozone industrial production rose 0.7% mom in June, EU up 0.6% mom
Eurozone industrial production rose 0.7% mom in June, above expectation of 0.0% mom. Production of capital goods rose by 2.6% mom and energy by 0.6% mom, while production of intermediate goods fell by -0.1% mom, durable consumer goods by -0.6% mom and non-durable consumer goods by -3.2% mom.
EU industrial production rose 0.6% mom. Among Member States for which data are available, the highest monthly increases were registered in Ireland (+6.7%), Malta (+4.8%) and Greece (+3.4%). The largest decreases were observed in Romania (-3.9%), Belgium (-2.2%), Italy and Latvia (both -2.1%).
GBP/USD Mid-Day Outlook
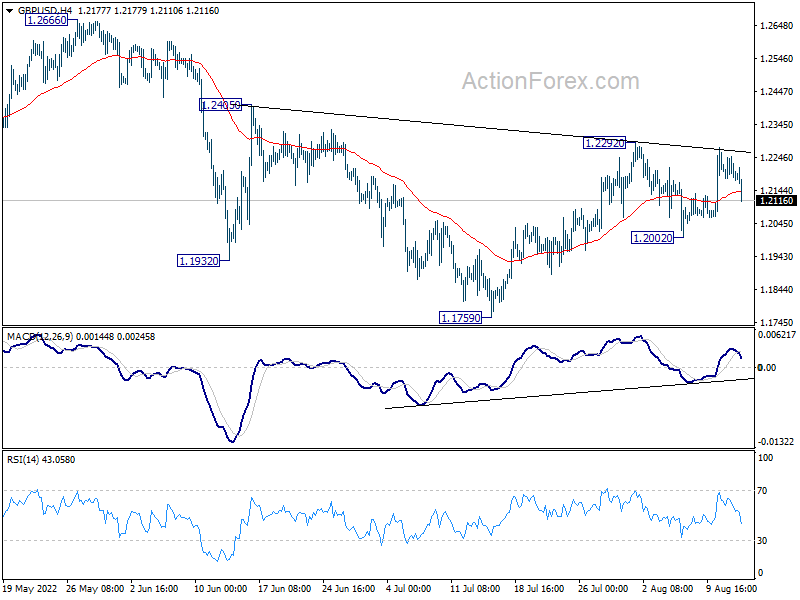
Daily Pivots: (S1) 1.2173; (P) 1.2212; (R1) 1.2240; More…
GBP/USD dips notably today but stays in range of 1.2002/2292 and intraday bias stays neutral. On the upside, decisive break of 1.2292 resistance will complete a head and shoulder bottom pattern (ls: 1.1932; h: 1.1769; rs: 1.2002). Further rally should then be seen to 1.2666 key resistance next. On the downside, however, break of 1.2002 will bring deeper fall back to retest 1.1759 low.
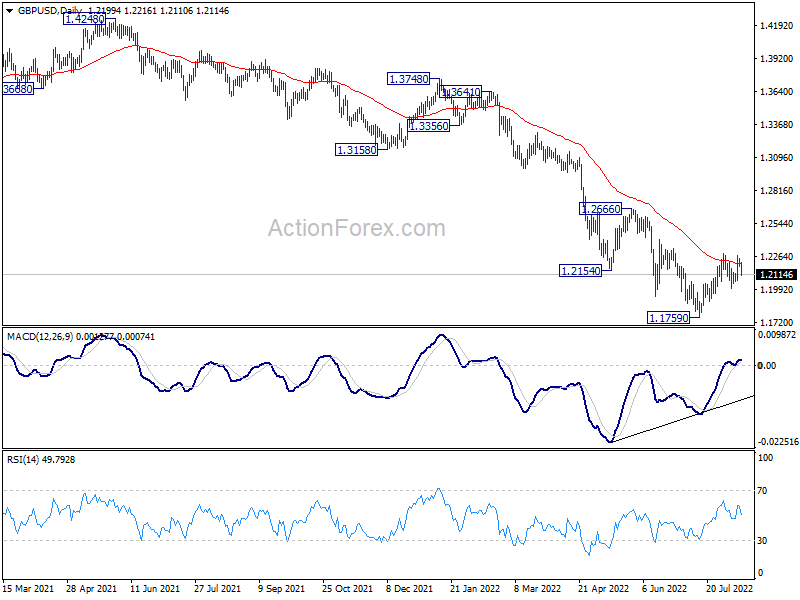
In the bigger picture, fall from 1.4248 (2018 high) could be a leg inside the pattern from 1.1409 (2020 low), or resuming the longer term down trend. Deeper decline is expected as long as 1.2666 resistance holds. Next target is 1.1409 low. However, firm break of 1.2666 will bring stronger rise back to 55 week EMA (now at 1.2925).
Economic Indicators Update
| GMT | Ccy | Events | Actual | Forecast | Previous | Revised |
|---|---|---|---|---|---|---|
| 22:30 | NZD | Business NZ PMI Jul | 52.7 | 49.7 | ||
| 06:00 | GBP | GDP M/M Jun | -0.60% | -1.30% | 0.50% | |
| 06:00 | GBP | GDP Q/Q Q2 P | -0.10% | -0.20% | 0.80% | |
| 06:00 | GBP | Industrial Production M/M Jun | -0.90% | -0.80% | 0.90% | 1.30% |
| 06:00 | GBP | Industrial Production Y/Y Jun | 2.40% | 1.60% | 1.40% | 1.80% |
| 06:00 | GBP | Manufacturing Production M/M Jun | -1.60% | -1.70% | 1.40% | 1.70% |
| 06:00 | GBP | Manufacturing Production Y/Y Jun | 1.30% | 1.30% | 2.30% | 2.60% |
| 06:00 | GBP | Index of Services 3M/3M Jun | -0.40% | -0.40% | 0.10% | 0.00% |
| 06:00 | GBP | Goods Trade Balance (GBP) Jun | -22.8B | -22.3B | -21.4B | |
| 08:00 | EUR | Italy Trade Balance (EUR) Jun | -2.17B | 0.35B | -0.01B | -0.06B |
| 09:00 | EUR | Eurozone Industrial Production M/M Jun | 0.70% | 0.00% | 0.80% | 2.10% |
| 12:30 | USD | Import Price Index M/M Jul | -1.40% | -0.50% | 0.20% | 0.30% |
| 14:00 | USD | Michigan Consumer Sentiment Index Aug P | 52.3 | 51.5 |


