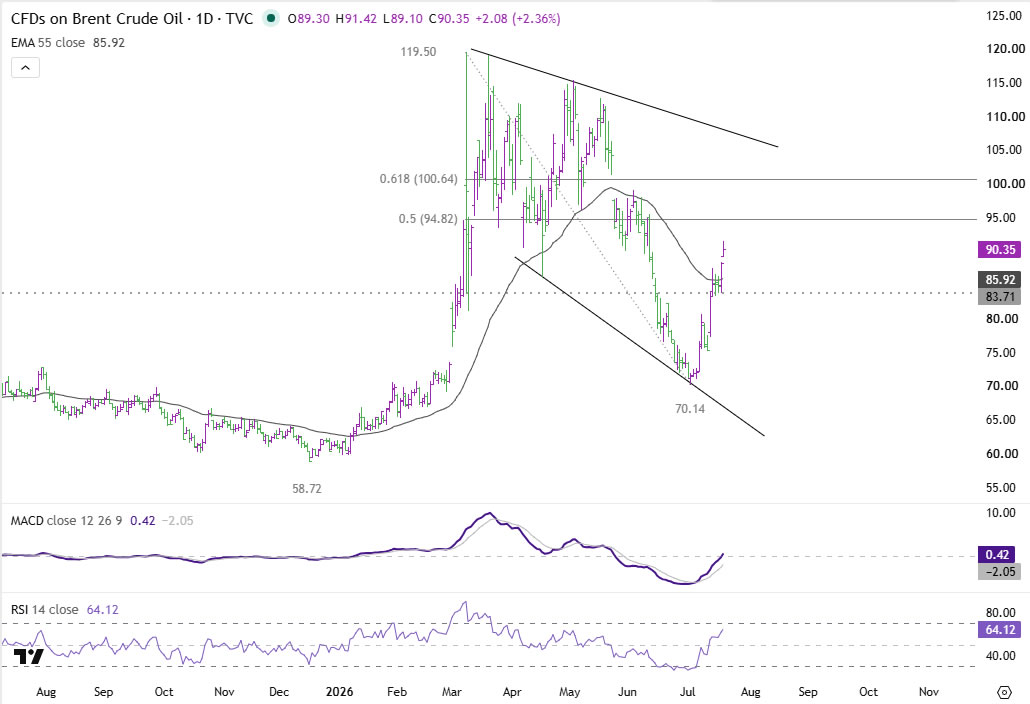
Brent crude began the week with a gap higher, breaking above the key $90 psychological level as markets reacted to another round of deteriorating developments in the US-Iran conflict. Reports of US fatalities, a strike on a Kuwaiti energy facility, Iran’s declaration that the ceasefire was no longer valid, and renewed claims that the Strait of Hormuz had been closed all reinforced expectations that the crisis will remain unresolved in the near term. Yet despite the significant geopolitical backdrop and technically important breakout, buying momentum in Asian trading has been relatively restrained.
Why hasn’t Brent rallied more aggressively?
The muted follow-through suggests much of the weekend escalation had already been priced in. Brent surged more than 17% last week, marking its strongest weekly gain since April, as markets steadily increased the probability of renewed supply disruptions. The latest headlines largely validated those concerns rather than introducing an entirely new shock. For now, investors still appear to regard a reopening of the Strait of Hormuz as the most likely outcome, limiting the urgency to chase prices significantly higher immediately after the weekend gap.
What could push Brent to $100?
The answer depends on time rather than headlines. During the brief period following June’s interim agreement, when sanctions were eased and the blockade lifted, Iran was exporting an estimated 2.2 million barrels per day. That supply is now being withdrawn again as the blockade returns. Every additional day that shipping remains disrupted increases the likelihood that markets shift from treating the crisis as a negotiating tactic to viewing it as a genuine physical supply disruption. Under that scenario, Brent could accelerate rapidly toward the $100 mark as traders begin pricing tighter global balances rather than merely geopolitical risk.
Why is this crisis potentially more serious than the one in March?
Unlike the March-April escalation, when releases from strategic petroleum reserves helped cushion the impact of supply fears, today’s market has much less spare buffer. Some estimates suggest that if current disruptions persist, meaningful physical shortages could emerge within around ten weeks. That would force consuming nations, in particular in Asia, to compete for increasingly scarce barrels, fundamentally changing the pricing dynamic from a geopolitical risk premium to one driven by actual supply deficits. In that environment, a retest of this year’s highs would no longer be an extreme scenario.
What does the technical picture suggest?
Technically, Brent’s solid break above the 38.2 retracement of 119.50 to 70.14 at 89.00 strengthens the case that the advance from 70.14 is evolving into a bullish trend reversal rather than merely a corrective rebound. More importantly, the decline from 119.50 to 70.14 itself unfolded as a well-defined three-wave corrective structure, suggesting the broader long-term uptrend has not yet been completed.
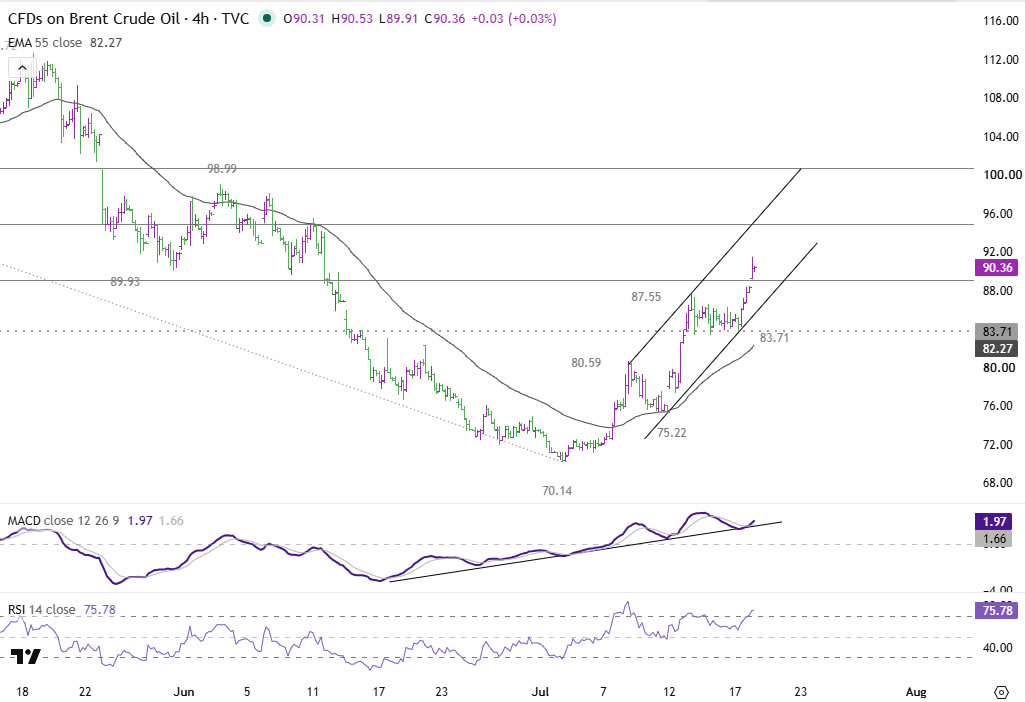
As long as support at 83.71 holds, further gains remain favored. The next major test comes around 95, where the 50% retracement at 94.82 converges with the ceiling of the near-term rising channel. A decisive break of that resistance would likely signal that markets are abandoning their base case of near-term normalization and instead pricing a prolonged disruption to Gulf supply. That would open the way through 61.8% retracement at 100.64 and for a retest of the March high at 119.50.