
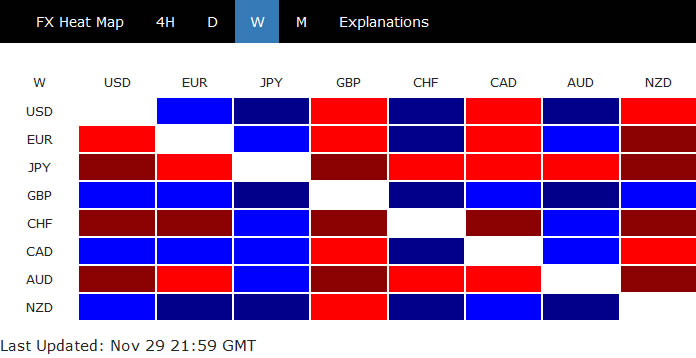
Sterling ended as the strongest one last week as it looks like Conservative is set to have a majority win in the upcoming elections. If materialized, UK is finally heading for an orderly Brexit next January, clearing all uncertainties. On the other hand, Japanese Yen was the weakest one, partly in reaction to the record runs in US stocks. Also, recovery in treasury yields, in particular as 10-year JGB closed back above -0.1% handle, gave the Yen some pressure.
However, the markets are now entering into an important December. UK elections are one key risk. But more importantly, the upcoming two weeks would be make or break for US-China trade negotiations. It’s now uncertain whether the phase one deal would be reached on time to avert next tariff escalation on December 15. Or, new batch of tariffs would be on hold while negotiations drag on to next year. Or, in rather unlikely way, negotiations break down.
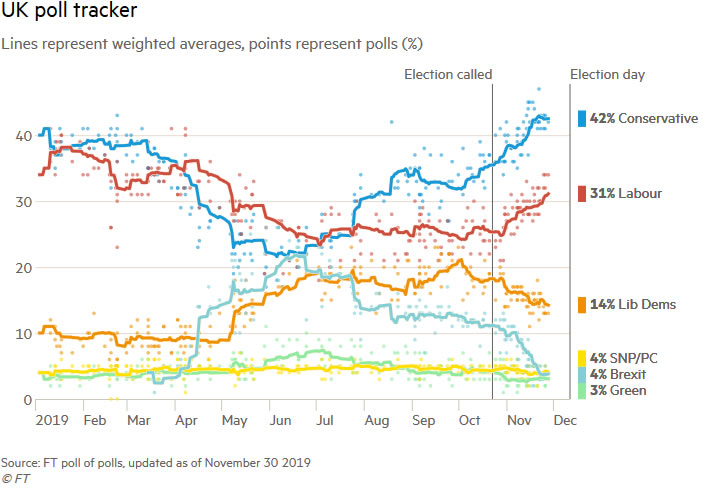
Sterling jumped as polls suggest Conservative majority after elections
Sterling surged broadly last week as latest polls suggested that Conservative are track to a majority win at the upcoming December 12 elections. That raised hope for ratifying the Brexit agreement Prime Minister Boris Johnson obtained from EU. Thus, UK is on track to leave EU with a deal on January 31, finally clearing all uncertainties.
The most important one was YouGov’s MRP model predictions, which suggested the Conservative to get 359 seats, with 68 majority. Taking into account the margins of error, YouGov still predicted Conservative seats at between 328 and 385, still indicating a modest majority in the worst case. According to the latest poll tracker by Financial Times, Conservatives also have an 11-point lead over Labour.
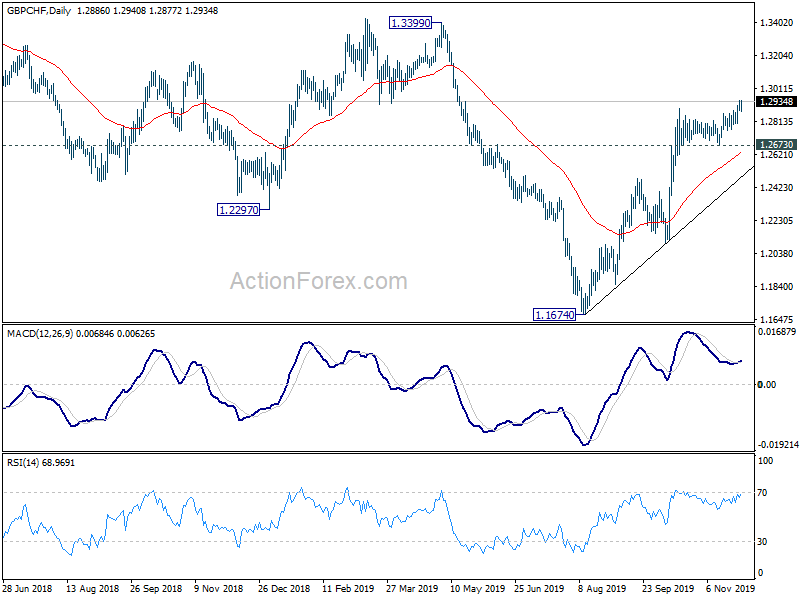
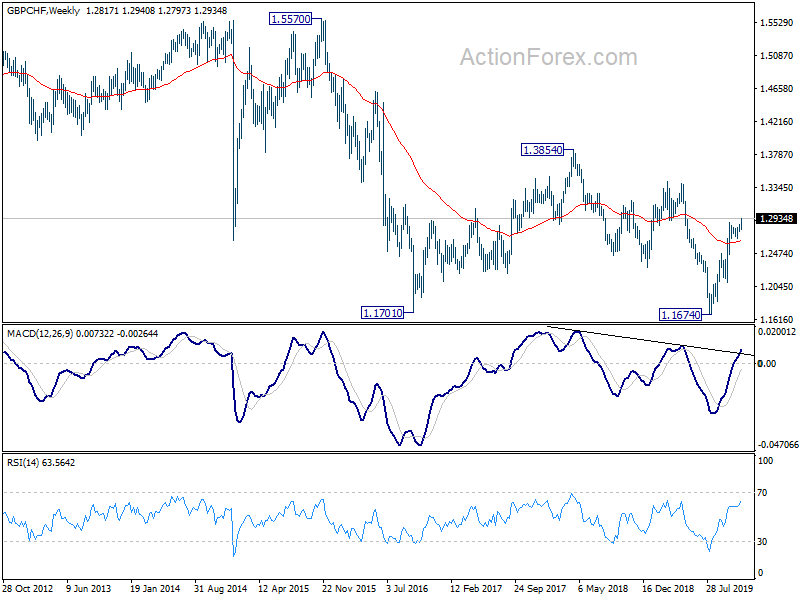
GBP/CHF is among the top movers and finished the week up more than 1%. Rise from 1.1674 finally resumed and further rally is expected as long as 1.2673 support holds. GBP/CHF would target 1.3399 resistance and above. But for now, such rise is seen as the third leg of the consolidation pattern from 1.1701 (2016 low). Hence, we’d look for topping signal between 1.3399 and 1.3854 (2018 high).
US stocks extended record runs, but beware of trade risks
US equities extended record runs last week but there was no corresponding strength seen in other regions. Furthermore, trade uncertainties were resurfacing and their intensification could trigger deep setback in stocks and risk appetite in the coming weeks. In the background, trade negotiations between US and China continued to drag on. No one practically knows if the phase one agreement could be reached to avert the planned tariff escalation on December 15. Even if a deal is reached, it’s highly unsure how much of the imposed tariffs would be rolled back.
Meanwhile, it’s reported on Friday that US Commerce Department is mulling further restrictions on selling technology products to China’s telecom giant Huawei. There were inter-agency discussions on changes to two key rules for allowing US authorities to regulate foreign sales of nonsensitive products with US-origin technology.
Separately, President Donald Trump finally signed that Hong Kong Human Rights and Democracy Acts into law. China has threatened to have strong countermeasures on US backing of Hongkonger’s fight to defend autonomy and for democracy. At this point, it’s unlikely that China would tie trade talks into politics. But it remains a risk that China could pull out of trade talk as retaliation.
Conditions set for a pull back in S&P 500
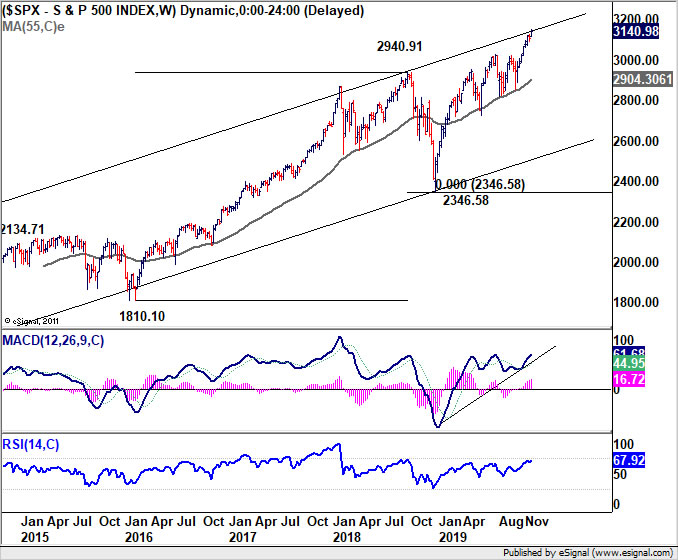
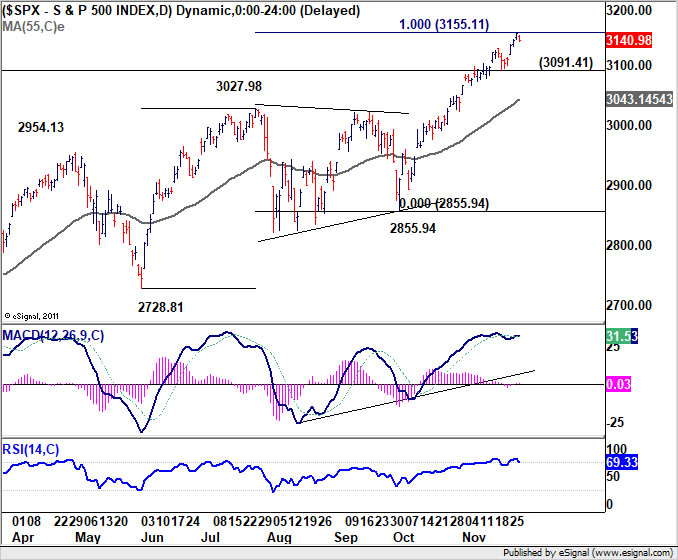
Technically, S&P 500 is seen as losing momentum as displayed in daily MACD. It’s also reasonably close to 100% projection of 2728.81 to 3027.98 from 2855.94 at 3155.11. Also, it’s now pressing long term channel resistance as seen in weekly chart. Hence, the conditions are actually set for a near term pull back. Break of 3091.41 support will indicate short term topping and bring corrective fall back to 55 day EMA (now at 3043.14).
Bearish Hong Kong stocks a risk to global markets
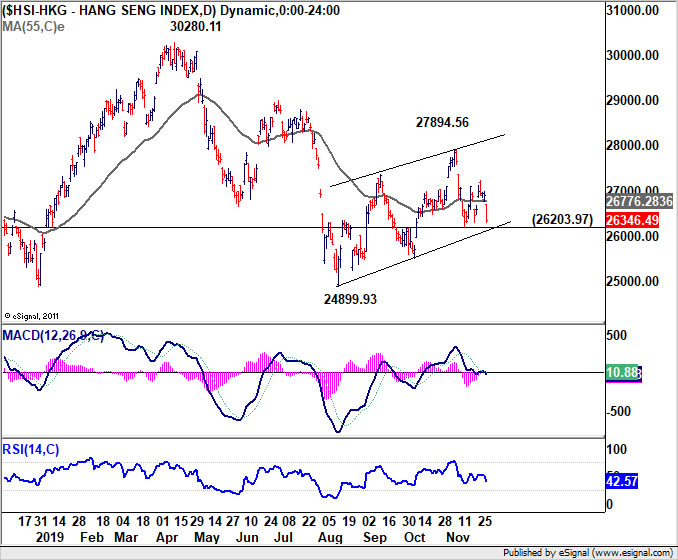
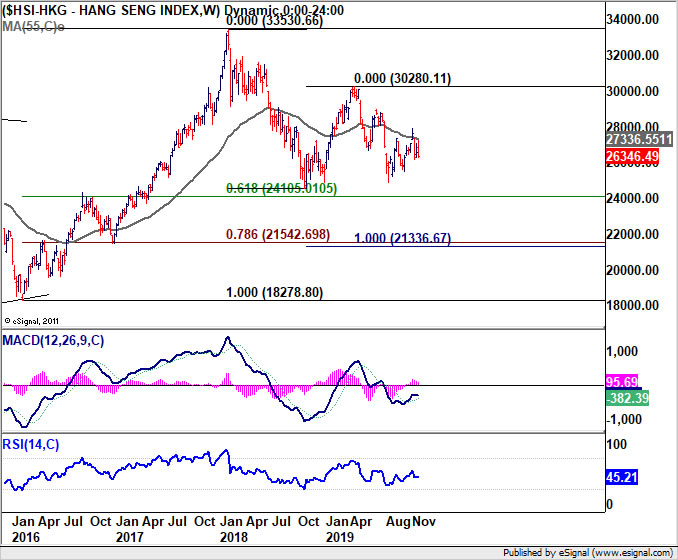
The bearish development in Hong Kong stocks is also a risk to consider ahead. So far, there is little spill over but it could be just a matter of time. Recovery from 26203.97 should have completed after being rejected by falling 55 week EMA. Break of this support should be imminent. That would further affirm the case that corrective rise from 24899.93 has completed at 27894.56. That is, larger down trend from 33530.66 is possibly ready to resume. 213336/21542 cluster fibonacci level could be the target of the next medium term down leg.
Dollar index failed rally attempt, but still in up trend
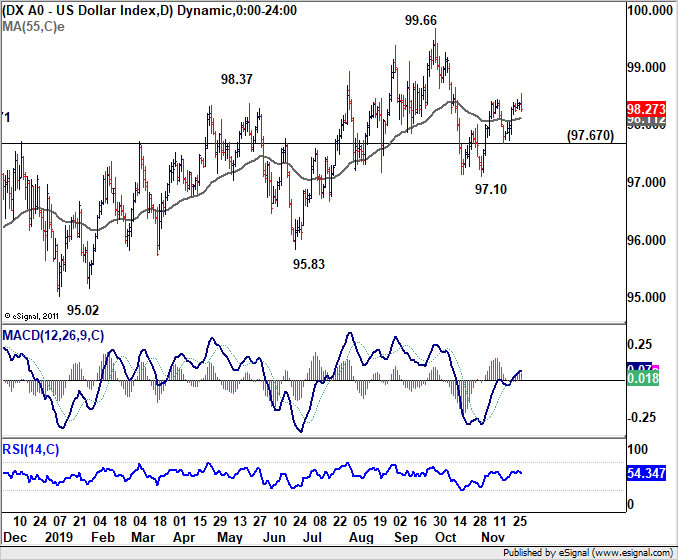
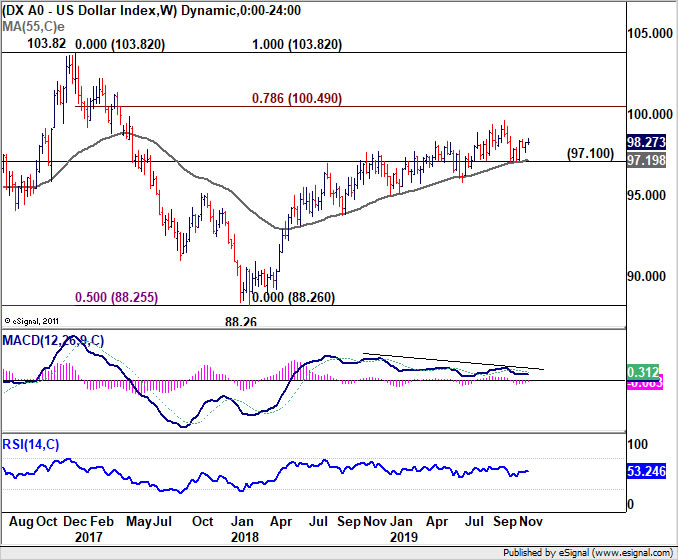
Back to the currency markets, Dollar index edged higher to 98.54 last week but retreated deeply to close at 98.27. Further rise is still expected as long as 97.67 support holds. At this point, we’ll still viewing prior rebound from 55 week EMA as a bullish signal. Later up trend from 88.26 is expected to resume through 99.66 sooner or later. However, break of 97.67 support will now be an early bearish sign. Further rebound of 97.10 will indicate medium term bearish reversal.
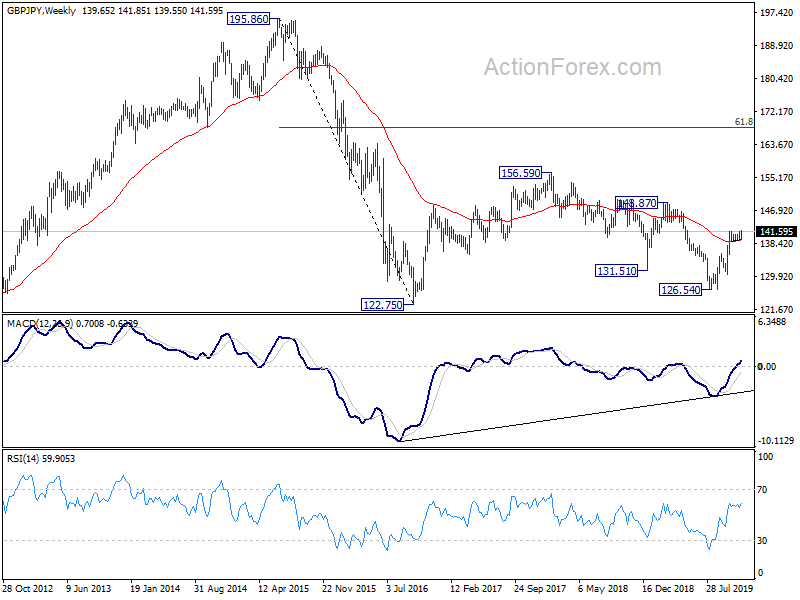
GBP/JPY Weekly Outlook
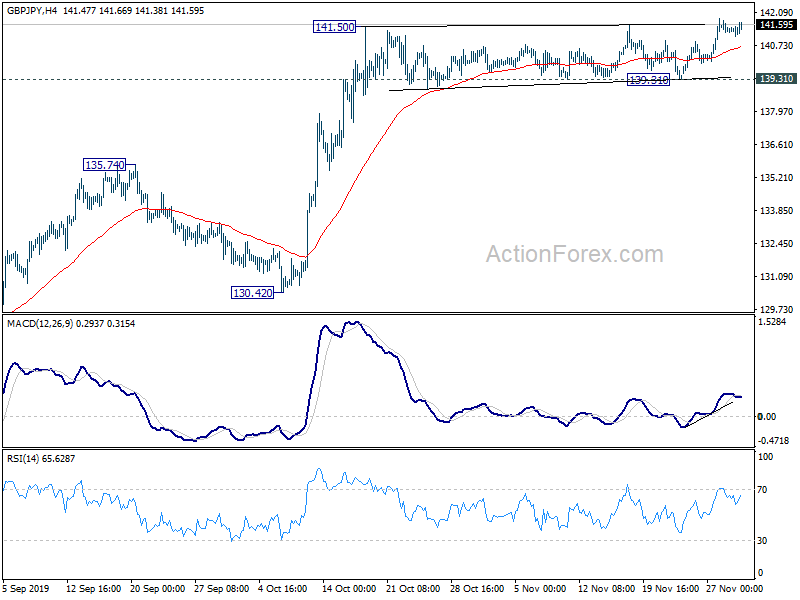
GBP/JPY’s break of 141.57 suggests that larger rise from 126.54 has resumed. Initial bias stays on the upside this week for trend line resistance (now at 143.78) next. Sustained break will pave the way to 148.87 key resistance next. On the downside, break of 139.31 support is needed to indicate short term topping. Otherwise, outlook will remain bullish in case of retreat.
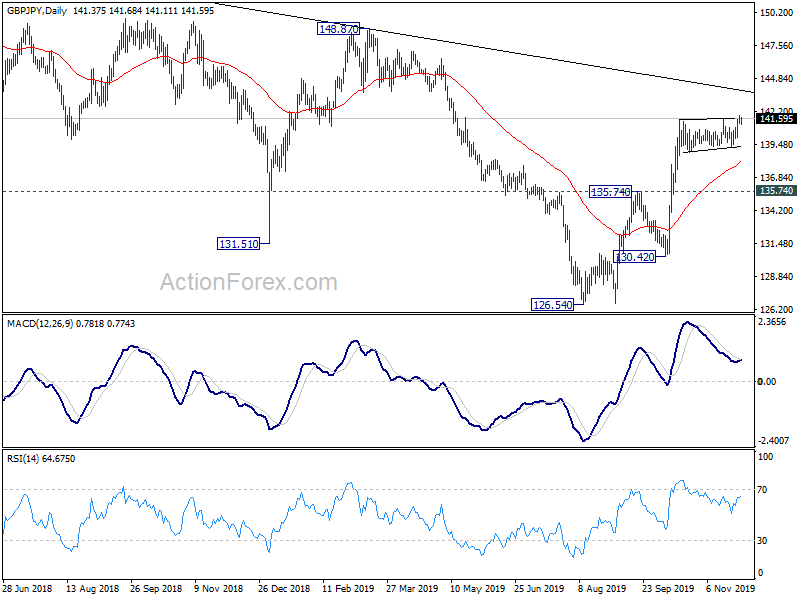
In the bigger picture, current rise from 126.54 is seen as the third leg of the consolidation pattern from 122.75 (2016 low). Further rally could be seen but for now, we’d expect strong resistance from 156.59 to limit upside. On the downside, sustained break of 135.74 resistance turned support will suggest that such rebound has completed. Deeper decline could the be seen to retest 126.54 low.
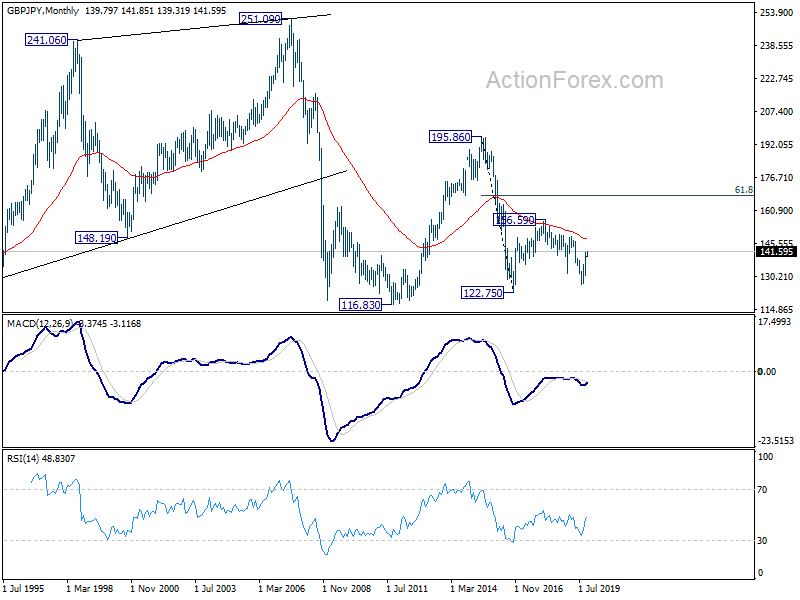
In the longer term picture, price actions from 122.75 (2016 low) are seen as developing into a consolidation pattern. That is, long term down trend from 195.86 (2015 high) and that from 251.09 (2007 high) are still in favor to extend through 116.83 (2011 low). We’ll hold on to this bearish view as long as 156.59 key resistance holds. However, firm break of 156.69 should at least bring further rally to 61.8% retracement of 195.86 to 122.75 at 167.93.


