Markets looked rather indifferent to the resurgence of coronavirus infections. Daily new cases surged to new high above 200k. Total cases broke 11m while deaths is closing in to 530k. But traders and investors couldn’t care less. Instead, sentiments were lifted by hope of recovery ahead, with Q3 already started. US ISM manufacturing turned back into expansion while non-farm payrolls grew 4.8m. France PMIs also turned back into expansion while UK PMIs steadied. China’s PMI services even suggests strong growth ahead.
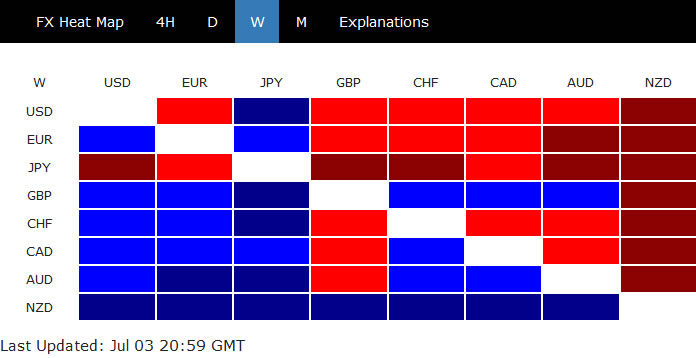
Positive sentiments were reflected in NASDAQ and China’s Shanghai SSE, but not so much in other stock indices. While commodity currencies ended the week higher together with Sterling, strength is Aussie is far too weak considering the late rally in Chinese stocks. Euro also ended as one of the weakest together with Dollar and Yen. It might take a couple of weeks more for the markets to sort out a coherent direction among themselves.
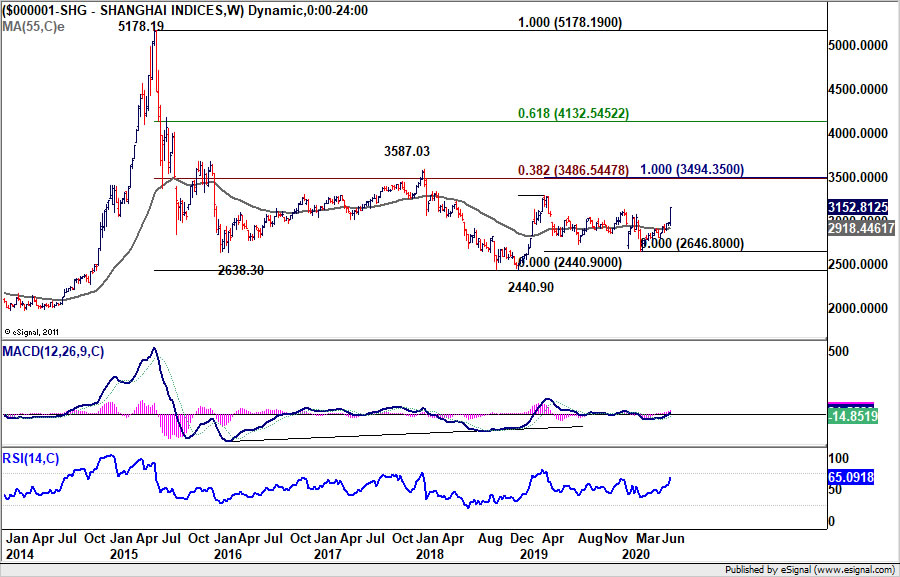
China Shanghai SSE staged massive rally on recovery optimism
Chinese stocks staged a massive rally last week. There seemed to be growing optimism of a solid recovery as both the official PMIs and Caixin PMIs pointed to underlying strengthen in services. The optimism was not much reflected in other markets, including currencies yet. But as China was the first economy hit by the coronavirus, it could also be the first, to come out of the impacts. We’ll see if the rally in Chinese stocks could spread to other markets in Q3.
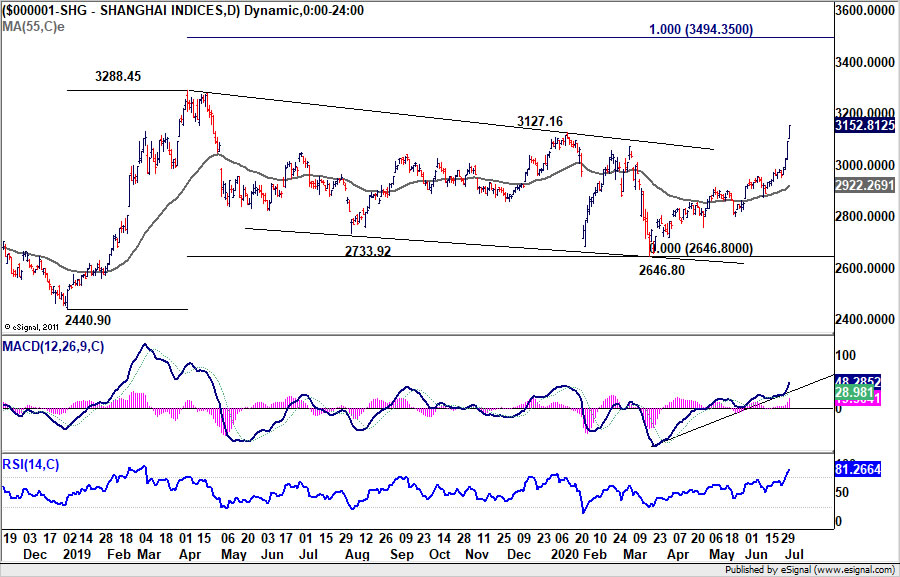
Shanghai SSE’s strong break of 3127.16 resistance should confirm completion of the medium term corrective pattern from 3288.45, with three waves to 2646.80. Further rise should be seen to 100% projection of 2440.9 to 3288.4 from 2646.8 at 3494.35 next. That would be the key hurdle for the index, as it’s close to 38.2% retracement of 5178.19 to 2440.90 at 3486.54.
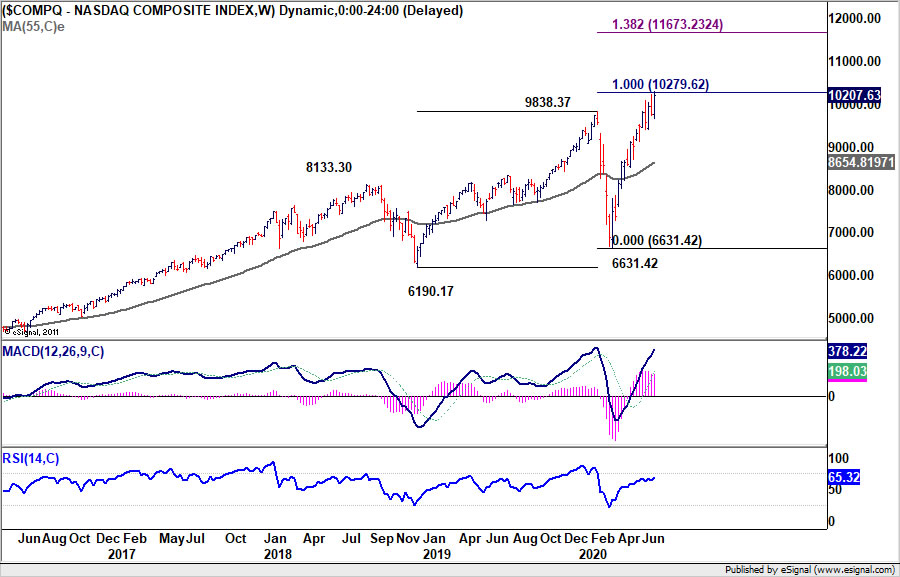
NASDAQ extended record run but up trend looks stretched
US stocks were relatively sluggish except that persistent strength is seen in NASDAQ. In a holiday shortened week, NASDAQ hit record high of 1310.36, before closing at 10207.63. Still, the current up trend looks a bit stretched with bearish divergence condition in both daily MACD and RSI. It’s also closed to 100% projection of 6190.17 to 9838.37 from 6631.42 at 10279.62.
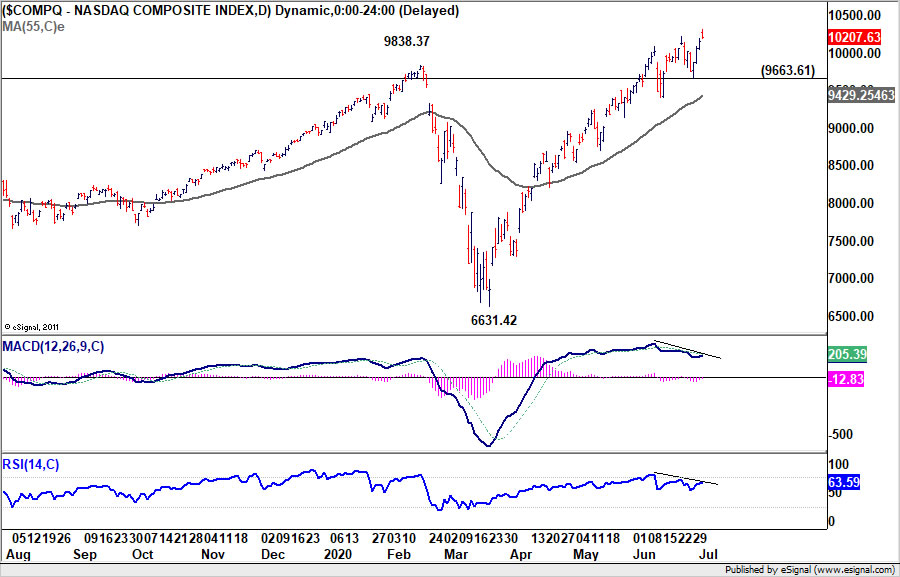
Break of 9663.61 support should indicate that the overdue pull back is starting. Nevertheless, NASDAQ has been defying out calls for tops so many times. Sustained trading above 10279.62 would pave the way to 138.2% projection at 11673.23 next.
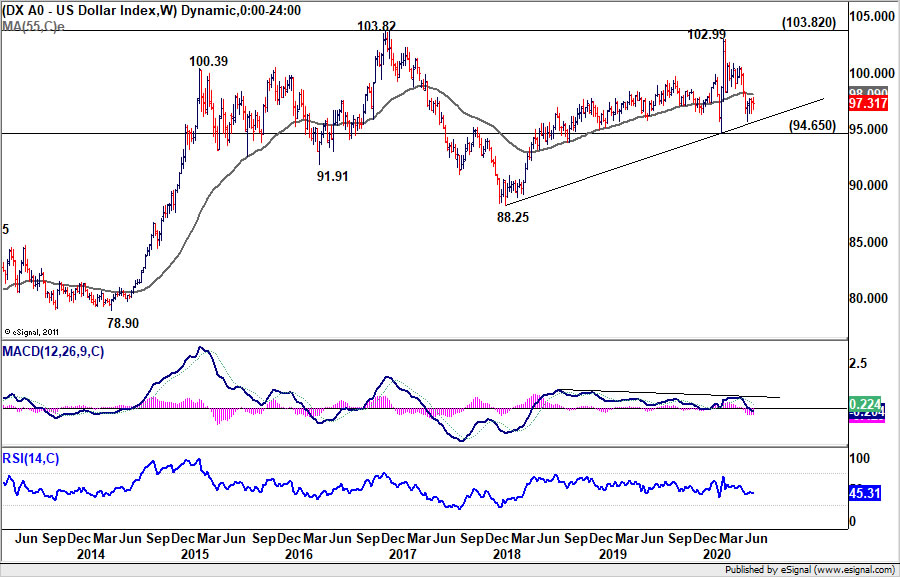
Dollar index staying in sideway consolidations
Dollar index continued to gyrate in range last week. Price actions from 95.71 short term bottom continue to look corrective. Hence even in case of another rise, upside would likely be limited by 38.2% retracement of 102.99 to 95.71 at 98.49, or even lower at 55 day EMA (now at 98.09). Another fall could be seen through 95.71 to 94.65 key support before forming a bottom.
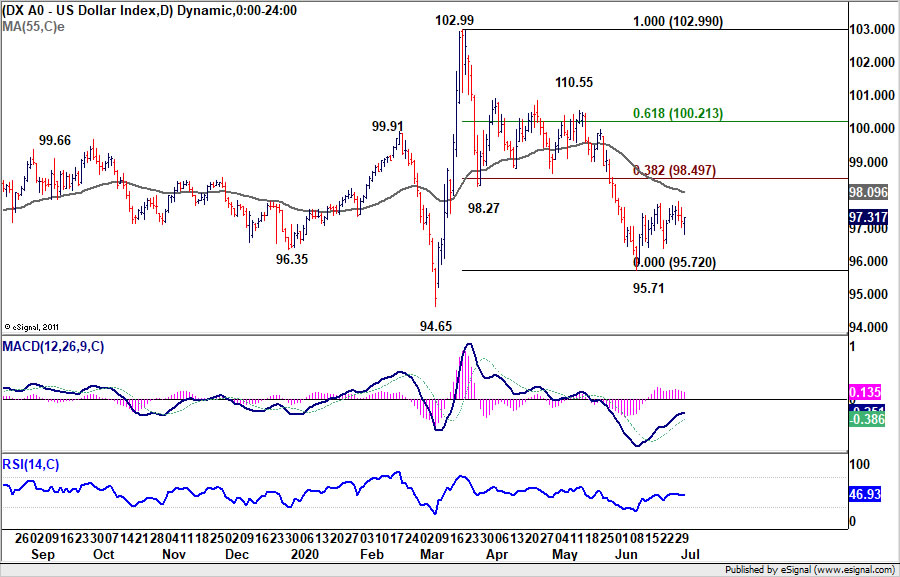
Meanwhile, we’d reiterate that whole up trend from 88.25, as the second leg of the long term consolidation pattern form 103.82, should have completed at 102.99 after missing 103.82 key resistance. Sustained break of 94.65 could pave the way to 88.25 support next.
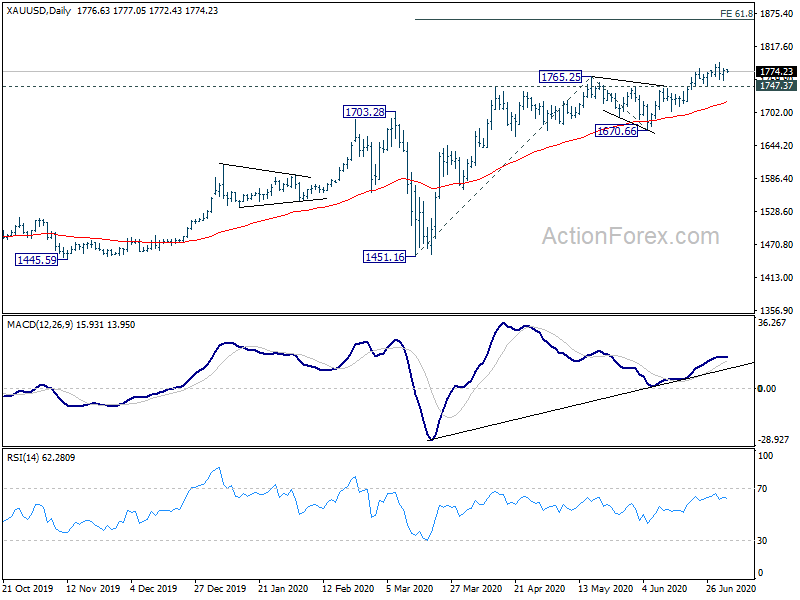
Gold extended up trend with weak momentum
Gold up trend continued last week but lost momentum quickly after hitting 1789.02. Near term outlook will stay bullish as long as 1747.37 support holds. Next target would be 61.8% projection of 1451.16 to 1765.25 from 1670.66 at 1864.76. However, surge in risk markets could drag down gold and break of 1747.37 would at least trigger a pull back to 55 day EMA (now at 1720.28).
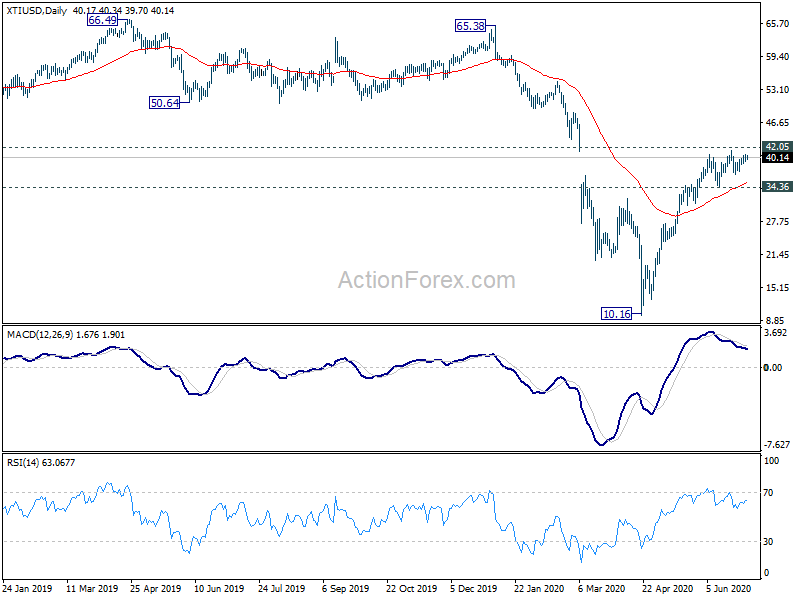
WTI oil should start correction soon
Despite last week’s recovery, there is not change in our view that a correction in WTI crude oil is due. It’s now close to 42.05 key resistance with clear loss of upside momentum in daily MACD. Break of 36.87 support would confirm and bring deeper fall to 34.36 support and below. If happens, that could be a drag in the stock markets, and support safe haven currencies.
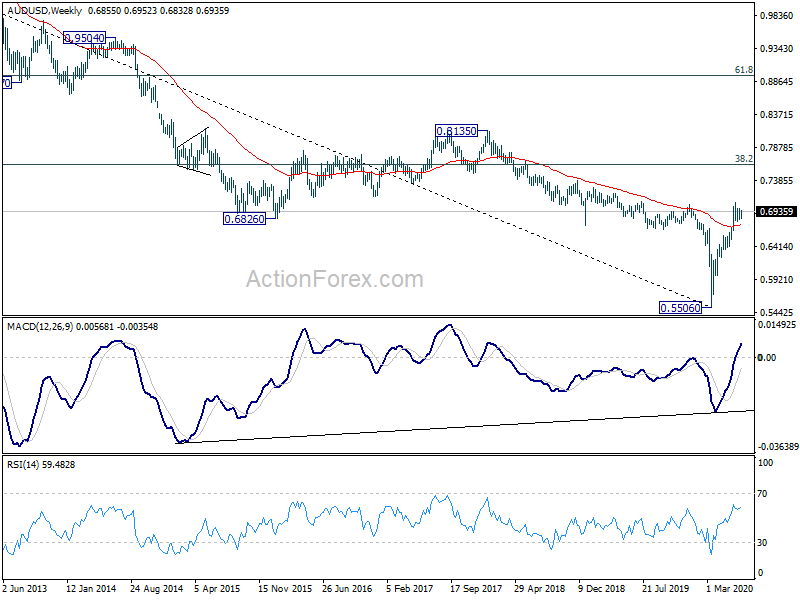
AUD/USD Weekly Outlook
AUD/USD’s consolidative trading continued last week and outlook is unchanged. Initial bias remains neutral this week first. We’d still expect correction from 0.7064 to extend with another falling leg. On the downside, break of 0.6776 will turn bias to the downside for 38.2% retracement of 0.5506 to 0.7064 at 0.6469. Nevertheless, sustained break of 0.7064 will resume whole rise from 0.5506 instead.
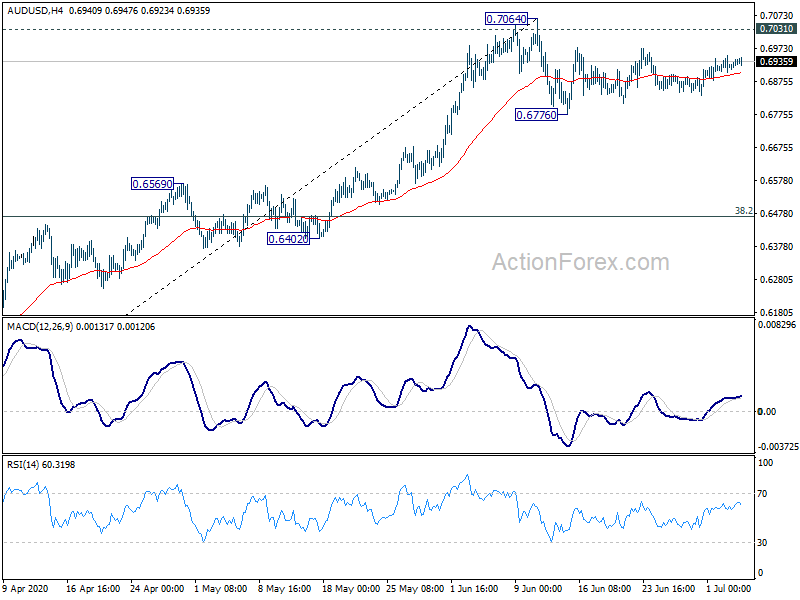
In the bigger picture, rebound from 0.5506 medium term bottom could be correcting whole long term down trend from 1.1079 (2011 high). Further rally would be seen to 55 month EMA (now at 0.7310). This will remain the preferred case as long as it stays above 55 week EMA (now at 0.6734). Sustained trading below 55 week EMA will turn focus back to 0.5506 low instead.
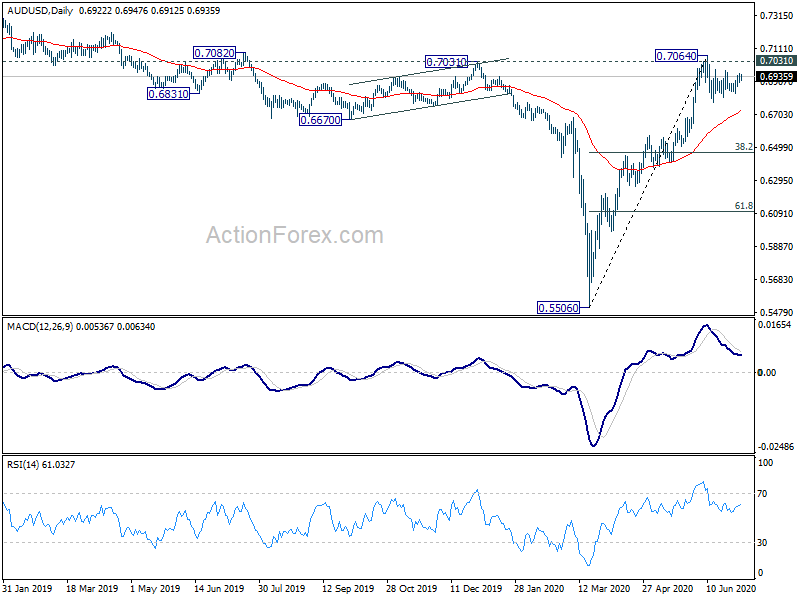
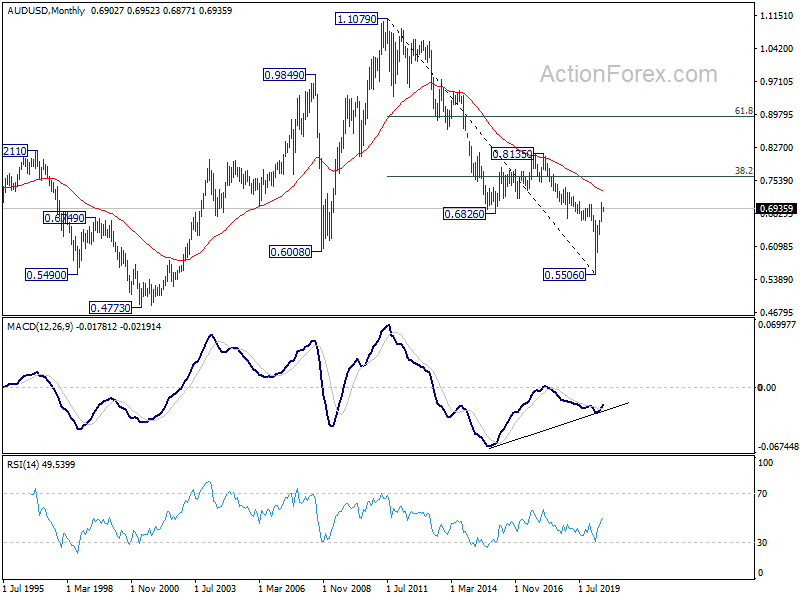
In the longer term picture, there is no change in the view that down trend from 1.1079 (2011 high) is still in progress. Such down trend could extend through 0.5506 low after completing the corrective rise from there. However, sustained break of 55 month EMA (now at 0.7310) will raise the chance of long term reversal and turn focus back to 0.8135 key resistance.