
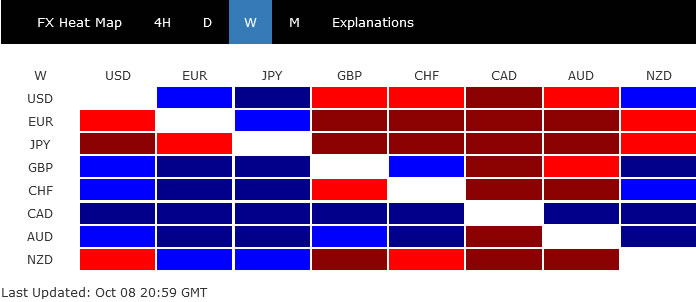
Yen was once again sold off broadly last week, following late rally in treasury yields despite disappointing US job report. Resilience in overall risk appetite also kept the Japanese currency pressured. Meanwhile, Euro followed as as distant second worst on selloff in crosses, as well as Dollar. New Zealand Dollar’s weakness was a surprise as RBNZ did deliver the anticipated rate hike.
On the other hand, Canadian Dollar jumped as the strongest, following both solid employment data and extended rise in oil prices. Australian Dollar was also helped by rally in coal price, even though RBA is set to lag behind major counterparts in exiting stimulus. Sterling was the third strongest one, on speculation that BoE could be forced to hike interest rate sooner.
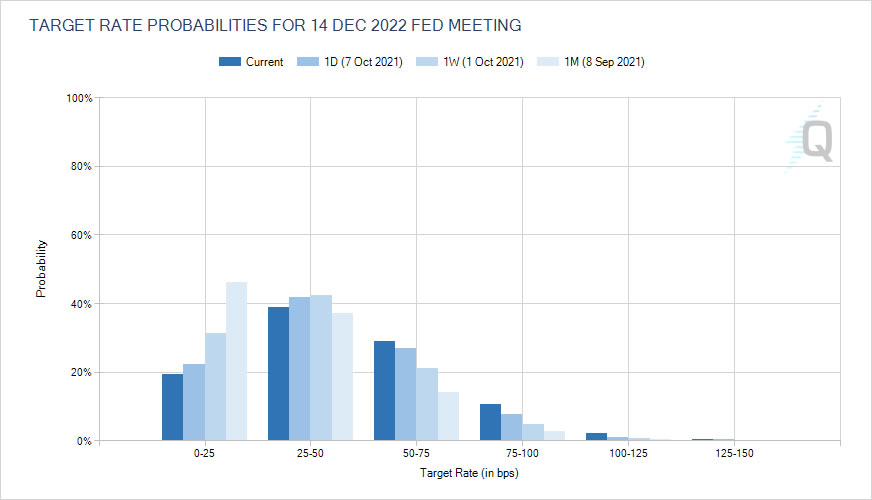
10-year yield surged past 1.6 as traders added to Fed hike bets
Despite disappointing non-farm payroll data, there was basically no change in expectations that Fed is on track to start tapering later this year. Indeed, traders continued to add bet on a Fed hike by the end of next year. Fed funds futures are pricing in less than 20% chance of Fed keeping interest rate at 0-0.25%, comparing to over 46% a month ago.
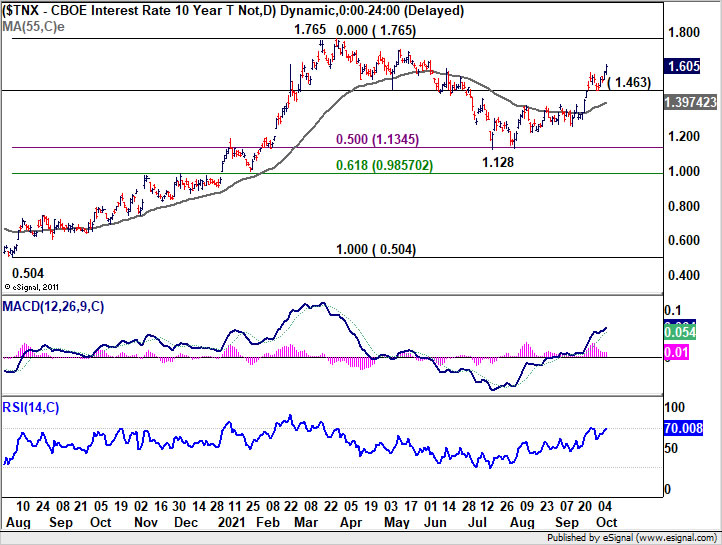
10-year yield also surged to close the week strongly at 1.605 as rise form 1.128 resumed. Further rise is expected as long as 1.463 support holds. TNX should target a test on 1.765 high in the near term. For now it’s still unsure if upside momentum in TNX is able to push it through 1.765 to resume larger up trend from 0.504. That could very much depends on upcoming inflation data, and thus Fed hike speculations.
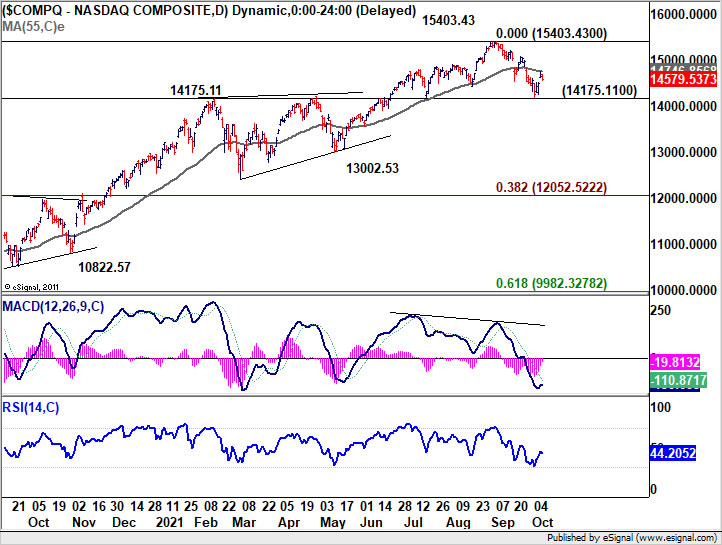
NASDAQ defended key support as stocks showed resilience
Stocks were also resilient last week. NASDAQ defended 14175.11 support and rebounded. Current development argues that the corrective pattern from 15403.43 is a relatively shallow one only, even if it’s going to extend. Sustained trading above 55 day EMA would pave the way to retest this high. However, firm break of 1415.11 support would argue that NASAQ is already is a deep medium term correction, that should target 13002.53 structural support and possibly below.
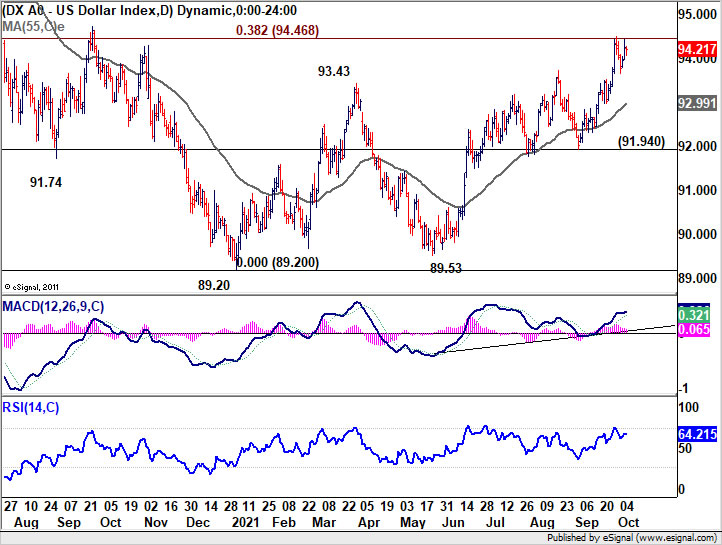
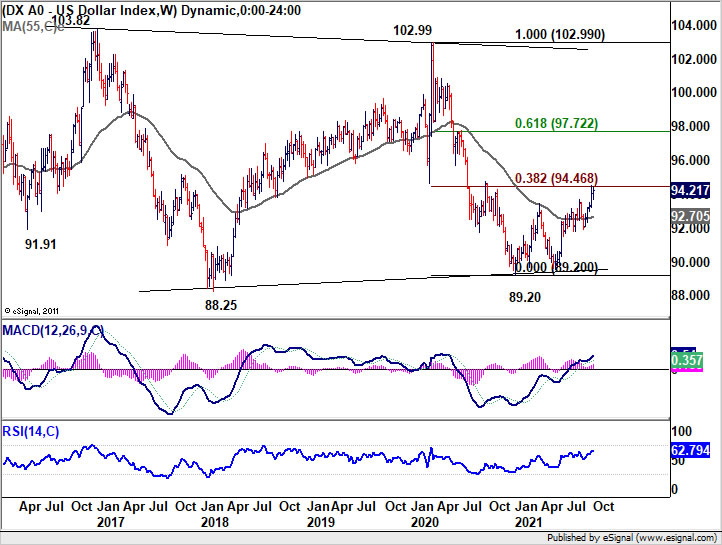
Dollar index still struggling to break through 94.46 fibonacci level
Dollar index continued to struggle to break through 38.2% retracement of 102.99 to 89.20 at 94.46 decisively last week. Dollar is partly supported by surging yield by capped by resilient risk appetite. For now, further rise is still in favor in DXY as long as 55 day EMA (now at 92.99) holds.
Sustained break of 94.46 carry larger bullish implication. That is, rise from 89.20 is already reversing the whole down trend from 102.99 (2020 high). In this case, stronger rally would be seen to 61.8% retracement of 97.72 and possibly above. However, firm break of 55 day EMA will dampen near term bullishness and turn focus back to 91.94 support instead.
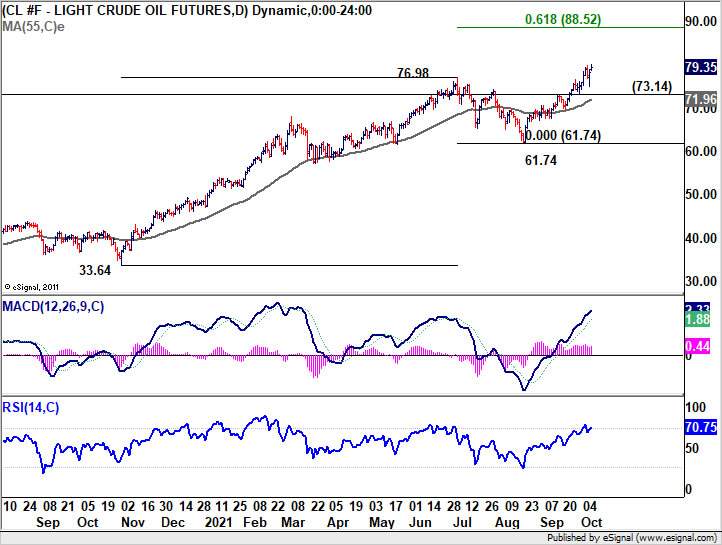
WTI breached 80 handle, on track to 88 fibonacci projection
WTI crude oil stayed firm last week and breached 80 handle for the first time since 2014, before closing at 79.35. Oil price followed broad based rally in energy and commodities including natural gas and coal. It’s also supported by OPEC decision to stick to a prior agreement to increase production by a modest 400k bpd.
For now, near term outlook in WTI will stay bullish as long as 73.14 support holds. While daily RSI is slightly in overbought zone, there is no sign of loss of momentum in daily MACD yet. Further rise would be seen to 61.8% projection of 33.64 to 76.98 from 61.74 at 88.52, if WTI could sustain above 80 and build a base there.
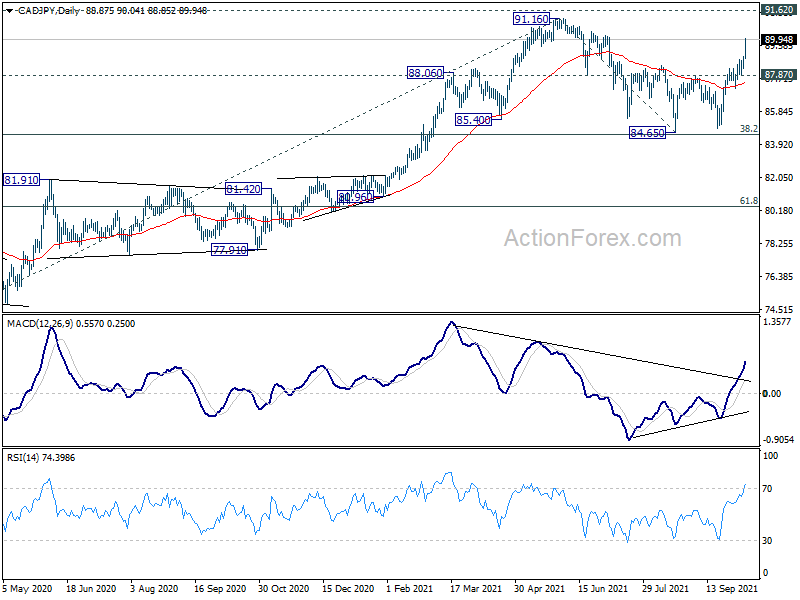
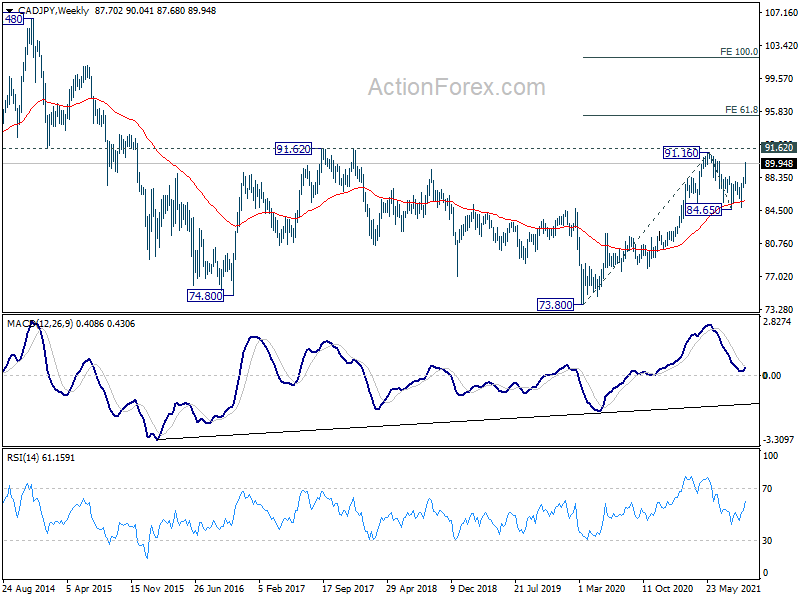
CAD/JPY ended as top mover, to retest 91.16/62 resistance zone soon
CAD/JPY ended as the biggest mover last week, on the back of solid Canadian job data, strong oil price, and selloff in Yen on rising yields. The development affirmed the case that correction from 91.16 has completed at 84.65, after defending 38.2% retracement of 73.80 to 84.65 at 84.52. The strong support from 55 week EMA also affirms medium term bullishness.
Further rise is now expected as long as 87.87 support holds. Decisive break of 91.16 will likely power CAD/JPY through 91.62 long term resistance. In the case, up trend from 73.80 should target 61.8% projection of 73.80 to 91.16 from 84.65 at 95.37 next.
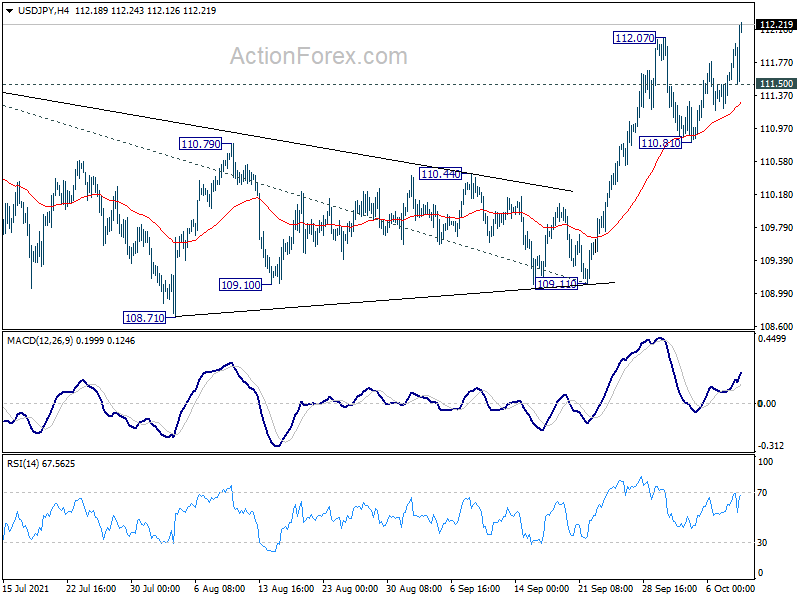
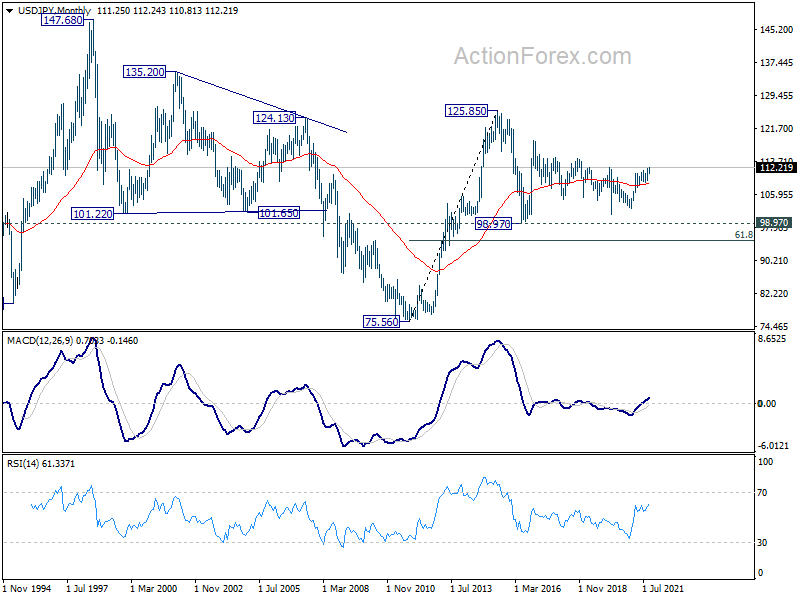
USD/JPY Weekly Outlook
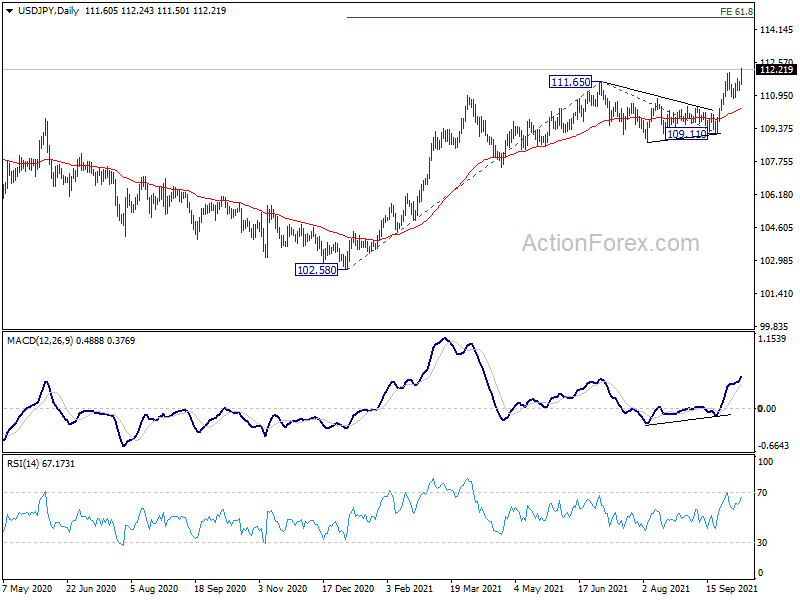
USD/JPY’s rally resumed last week by breaking 112.07 temporary top and hit as high as 112.24. Initial bias stays on the upside this week. Current up trend from 102.58 should target 61.8% projection of 102.58 to 111.65 from 109.11 at 114.71 next. On the downside, below 111.50 minor support will turn intraday bias neutral first. But near term outlook will stay bullish as long as 110.81 support holds.
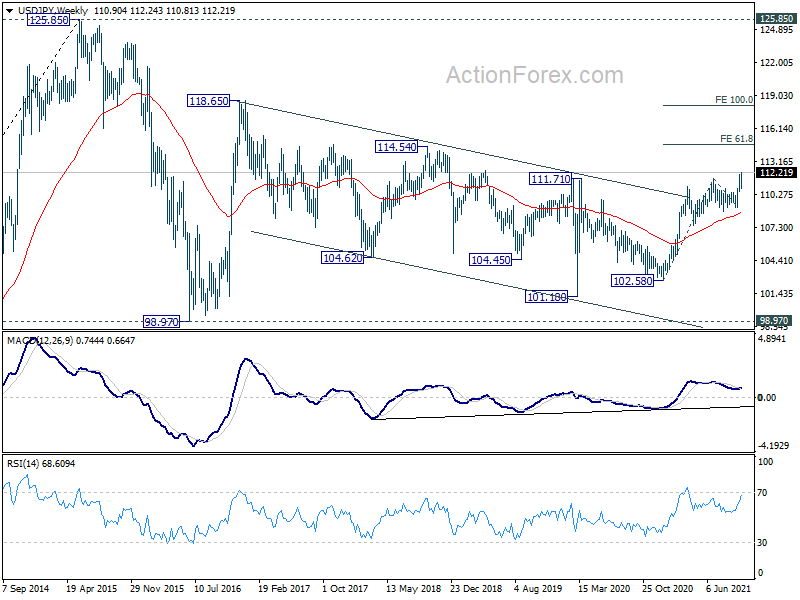
In the bigger picture, corrective decline from 118.65 (2016 high) should have completed at 101.18 already. Rise from the 102.58 is seen as the third leg of the up trend from 101.18. Next target is 114.54 resistance and then 118.65 high. This will now be the preferred case as long as 108.71 support hold, even in case of pull back.
In the long term picture, the rise from 75.56 (2011 low) long term bottom to 125.85 (2015 high) is viewed as an impulsive move, no change in this view. Price actions from 125.85 are seen as a corrective pattern which could still extend. In case of deeper fall, downside should be contained by 61.8% retracement of 75.56 to 125.85 at 94.77. Up trend from 75.56 is expected to resume at a later stage for above 135.20/147.68 resistance zone.


