
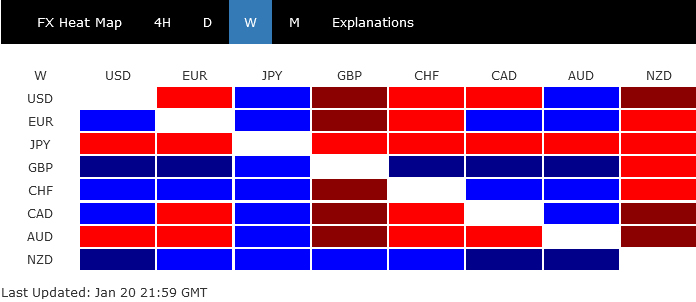
BoJ and Davos were the major focuses of last week. Much volatility was seen in Nikkei, JGB yields, and Yen. As dusts settled, the Japanese currencies ended as the worst performer, but closed inside prior week’s range. Australian Dollar was the next weakest after poor job data. Dollar was the third, after many Fed officials indicated their support for a 25bps hike in February.
New Zealand Dollar ended the strongest despite Prime Minister Jacinda Ardern’s surprised resignation. Sterling and Swiss Franc followed. But it should noted that Euro did stage a strong rebound against European peers after ECB President Christine Lagarde pledged to “stay the course”, countering rumors of a slower rate hike.
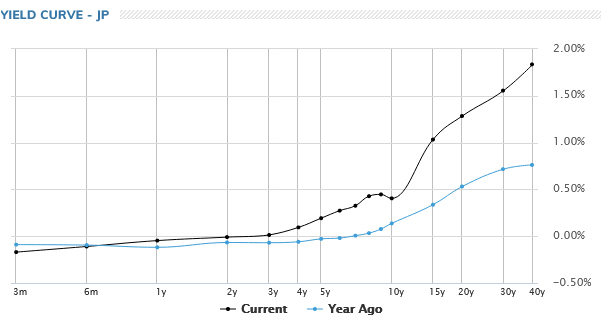
A look at JGB yield, Nikkei, and NZD/JPY after BoJ drama
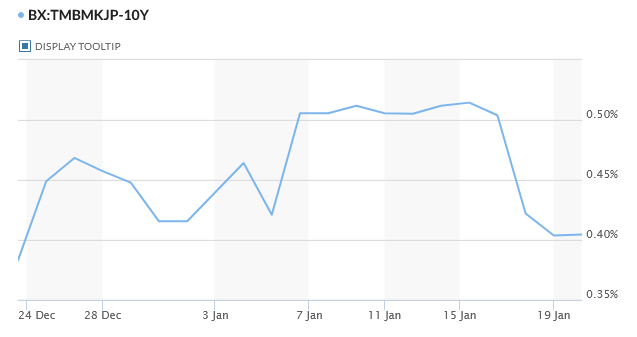
Despite all the speculations, BoJ eventually decided to keep monetary policy unchanged last week, maintaining short term interest rate at -0.10% and the 10-year yield cap at 0.50%. Governor Haruhiko Kuroda reiterated the pledge to maintain extremely accommodative monetary for the time being. Much volatility was seen in JGB yields, Nikkei and Yen. However, as BoJ won’t meet again until March 8, speculations on policy move should cool for a while.
10-year JGB yield closed lower at 0.404 after hitting as high as 0.585.
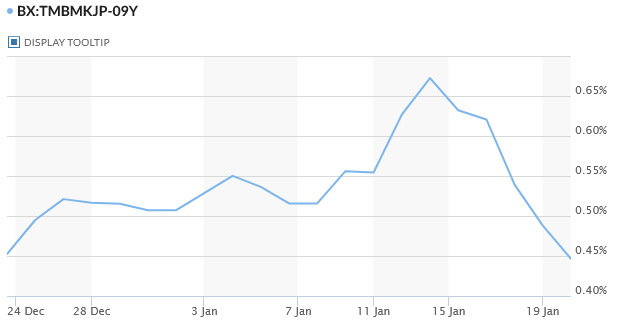
The move in 9-year JGB yield was more drastic, hitting as high as 0.700 before eventually closing at 0.488…
and 8-year yield which surged to 0.674 before closing at 0.473.
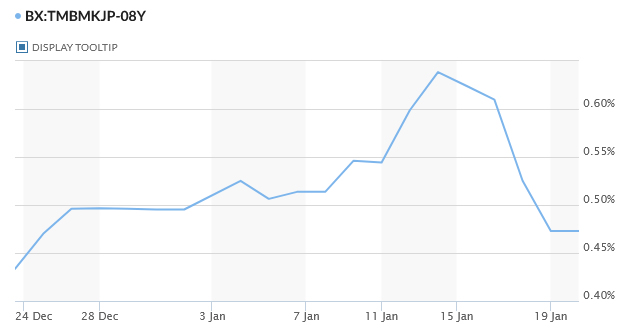
Yield curve remains “distorted” with a dip at 10-year, but the distortion became much less serious.
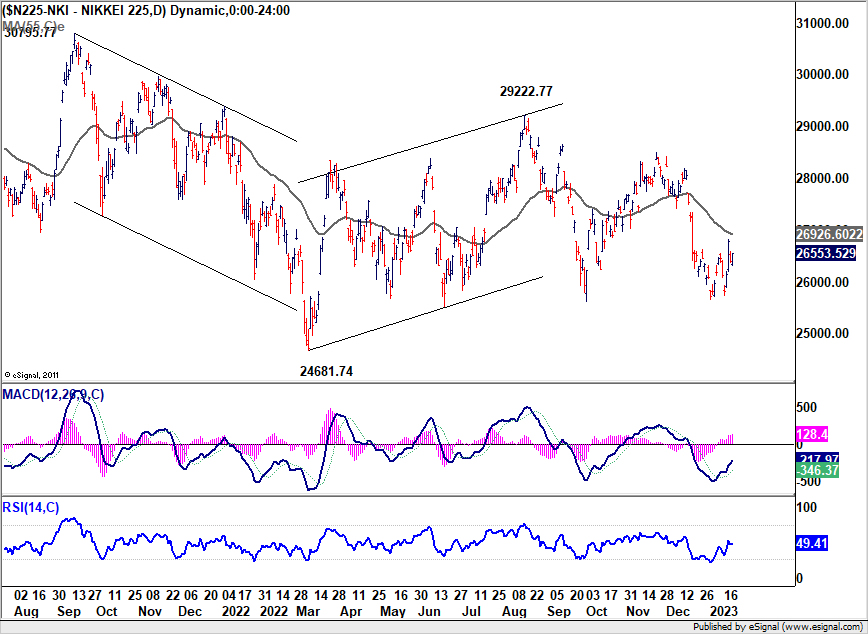
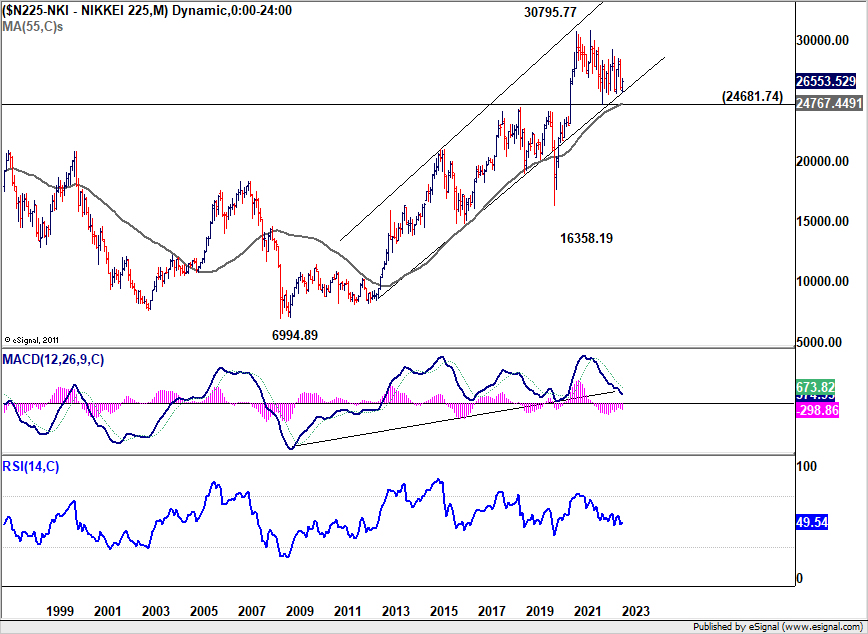
Nikkei had a wild ride, hitting 25748.10, the rebounded to 26816.68, then closed the week at 26553.52. For the near term, risk is still mildly on the downside as long as the index stays below the falling 55 day EMA (now at 26926.60), i.e. around 27k handle. A break through 25661.89 support cannot be ruled out. But even in case of a fall, strong support should be seen around 24681.74 to contain downside. The level is close to 55 month EMA, which stands at 24767.44.
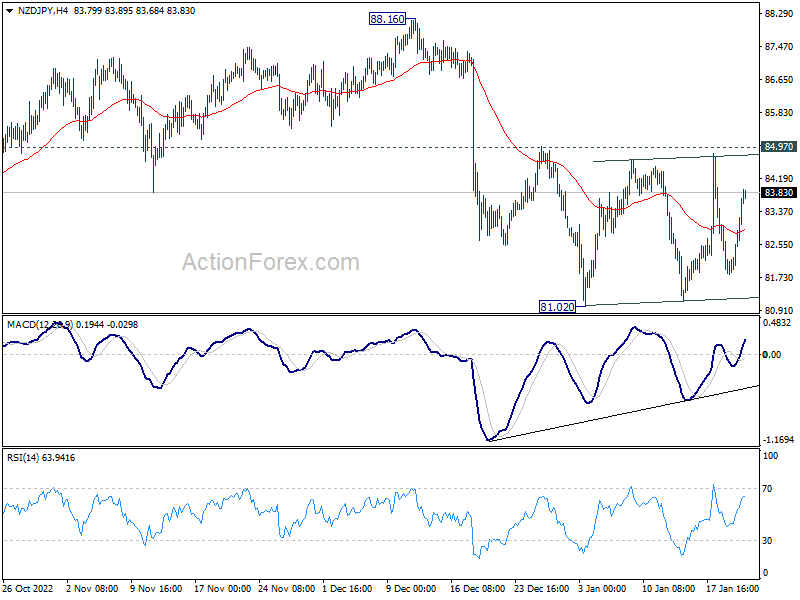
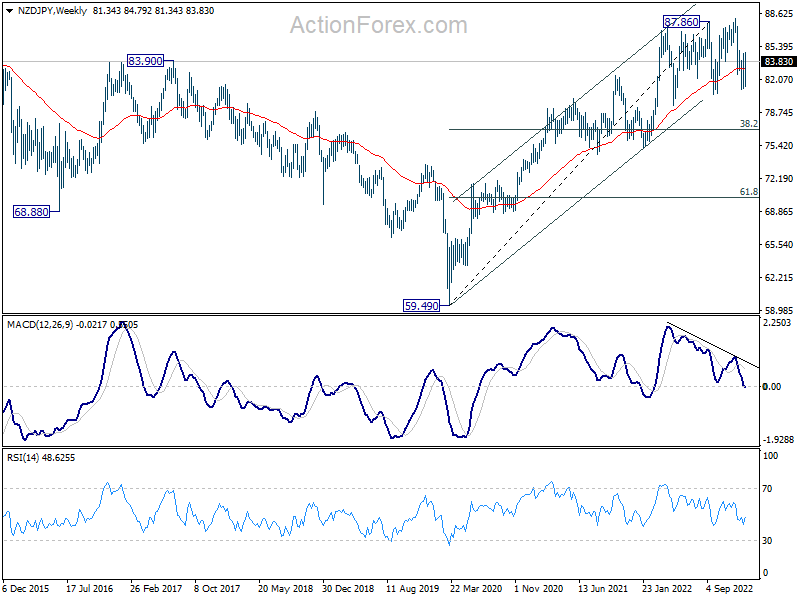
While Yen was sold off towards the end of the week, all Yen crosses just closed inside prior week’s range. The 2.64% gain in the top mover NZD/JPY might look huge. It’s indeed just a leg inside a near term sideway pattern. For the near term, risk will stay on the downside as long as 84.97 resistance holds. Break of 81.02 will extend the corrective pattern from 87.86 (with fall from 88.16 as the third leg) towards 38.2% retracement of 59.49 (2020 low) to 87.86 at 77.02. But break of 84.97 will bring stronger rebound back to 87.86/88.16 resistance zone.
Risk sentiment mixed but Bitcoin hints underlying appetite?
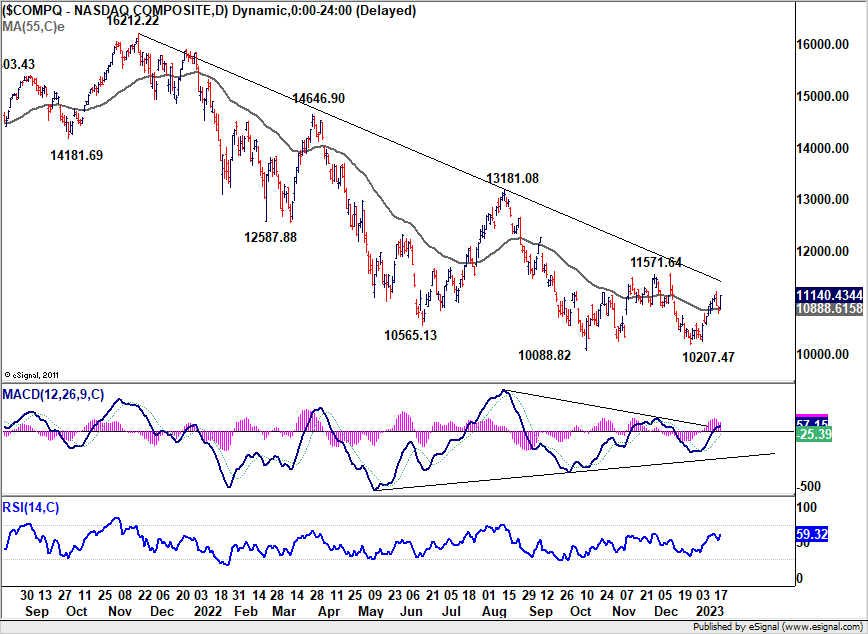
In the US, sentiment was mixed with DOW finished lower by -2.7% for the week, and S&P 500 lost -0.66%. But NASDAQ bucked the trend and gained 0.55%. As for NASDAQ the support from 55 day EMA is a positive sign. Near term focus is back on 11571.64 resistance. Firm break there will indicate at least a stronger rebound back to 13181.08 resistance, with prospect of bullish reversal.
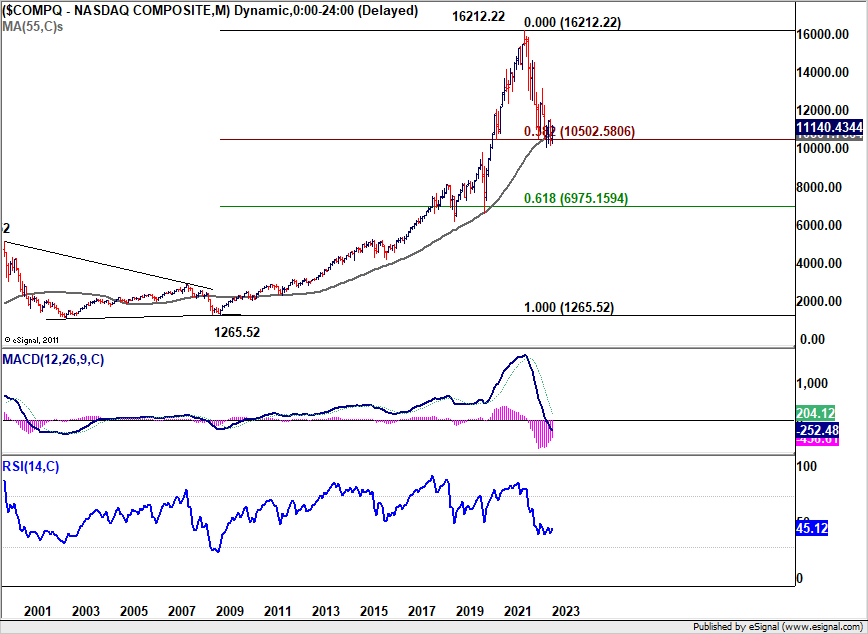
Meanwhile, even though the reversal might still be delayed. It’s looking increasing likely that correction from 16212.22 will finish at around current level at 10k handle, with 55 month EMA at 10801.78 and 38.2% retracement of 1265.52 to 16212.22 at 10502.58.
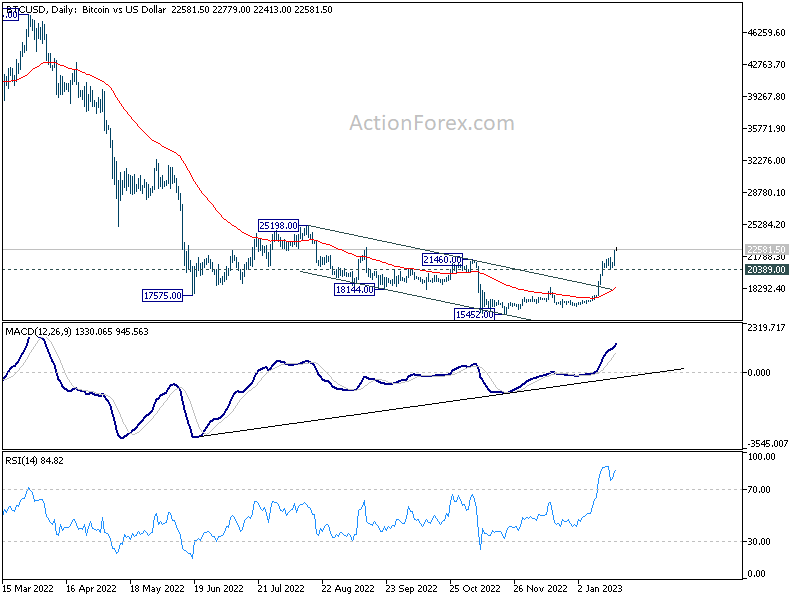
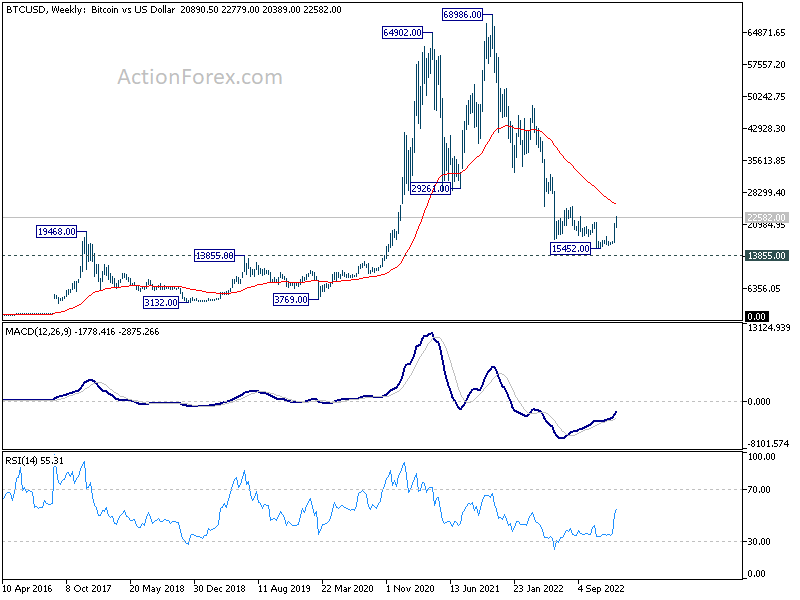
While, again, overall sentiment was mixed, the bullish development in Bitcoin argues that there might be some risk appetite building up underneath. The strong break of 21468 resistance should confirm medium term bottoming at 15452 on bullish convergence condition in daily and week MACD.
It’s still early to call for a large scale up trend. But further rally is now expected as long as 20389 support holds. Bitcoin would target 25198 resistance, or even further to 55 week EMA (now at 25730). Reactions from there will reveal the underlying buying momentum.
But anyways, rise in Bitcoin could happen in tandem with NASDAQ, which takes overall markets higher.
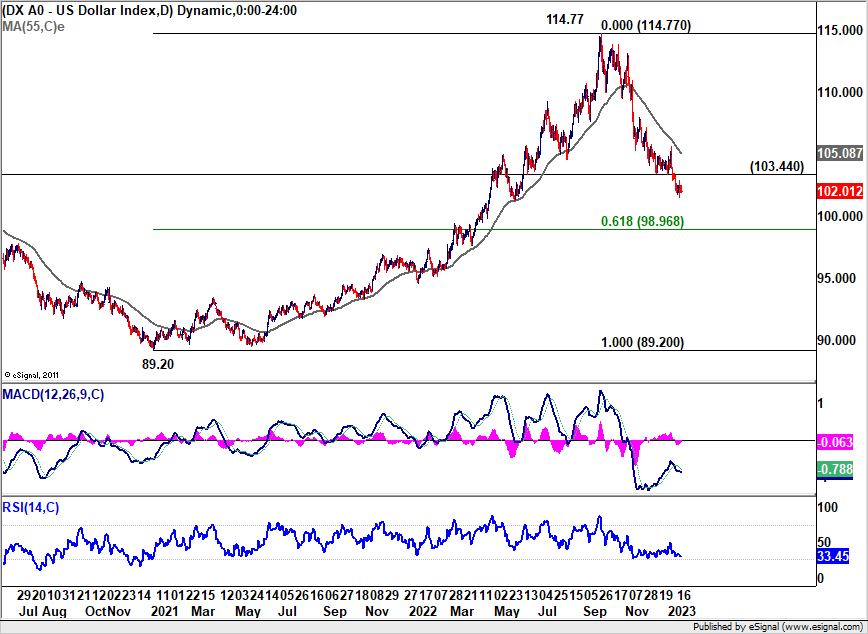
Dollar index extending the fall from 114.77
Dollar index’s fall from 114.77 has somewhat slowed slightly, but there is no sign of bottoming yet. USD/JPY’s mild recovery doesn’t warrant a strong rebound yet. At the same time, EUR/USD’s up trend is still on the risk track. Additionally, risk on sentiment could continue cap any upside in DXY.
For the near term, further decline is expected as long as 103.44 support turned resistance holds. Fall from 114.77 could extend to 61.8% retracement of 89.20 to 114.77 at 98.96 before getting enough support. Nevertheless, break of 103.44 should at least trigger an attempt towards 55 day EMA (now at 105.08).
USD/JPY Weekly Outlook
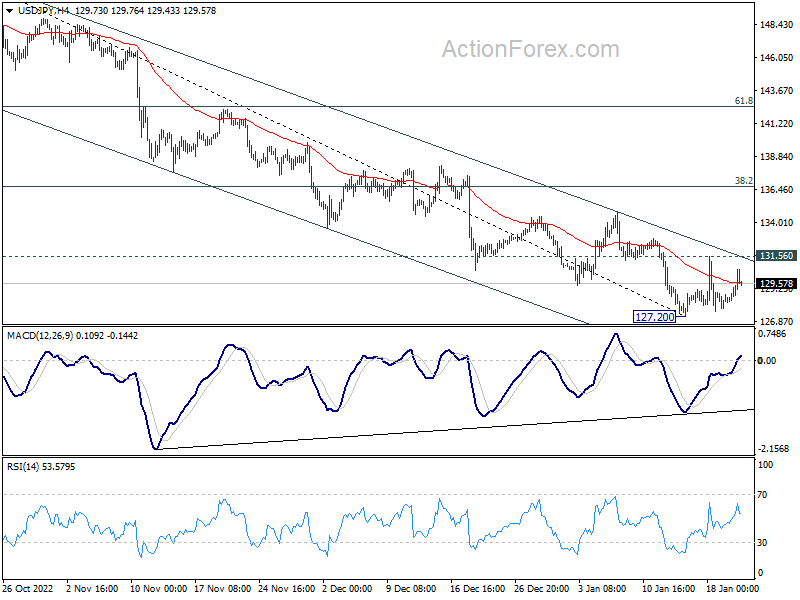
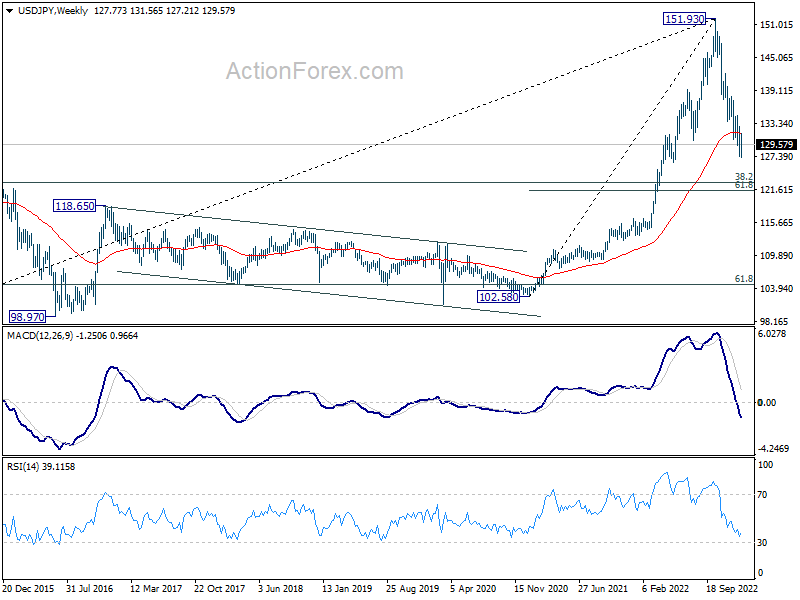
USD/JPY edged lower to 127.20 last week but turned sideway since then. Initial bias stays neutral this week first. There is no clear sign of bottoming yet, and another fall remains mildly in favor. Break of 127.20 will resume the whole decline from 151.93 and target 121.43 fibonacci level. Nevertheless, break of 131.56 should confirm short term bottoming, and turn bias back to the upside for stronger rebound.
In the bigger picture, the break of 55 week EMA (now at 131.52) raises the chance of medium term bearish reversal, but that’s not confirmed yet. Strong support could be seen around 61.8% retracement of 102.58 to 151.93 at 121.43 and 38.2% retracement of 75.56 to 151.93 at 122.75 to bring rebound. But break of 131.56 resistance is needed to indicate bottoming first. Otherwise further fall will remain in favor.
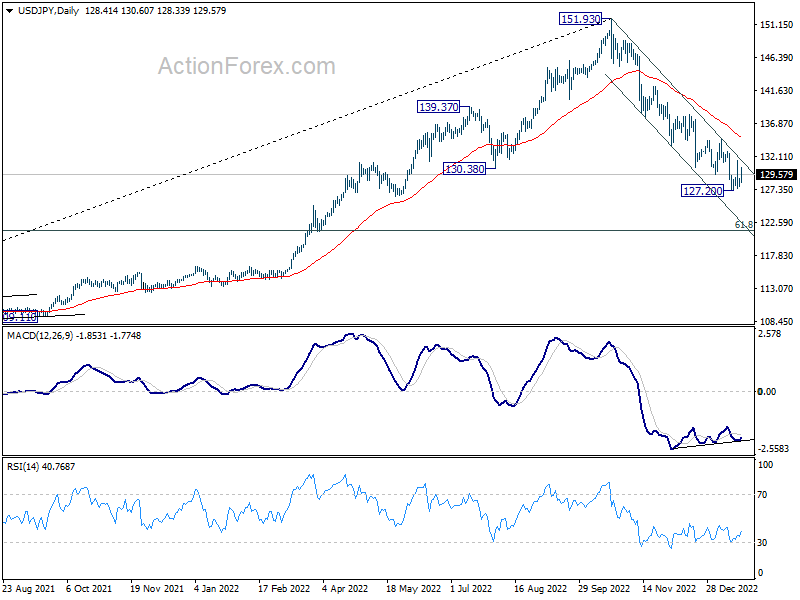
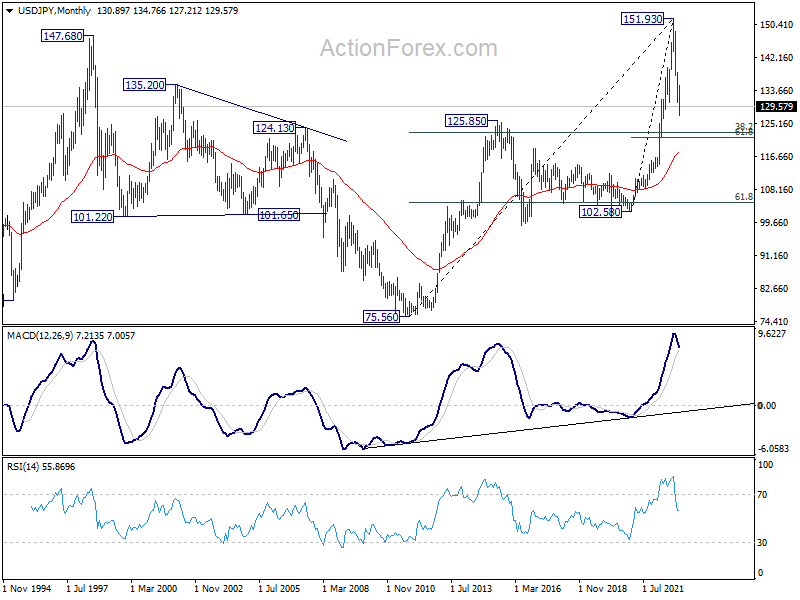
In the long term picture, 151.93 looks increasingly likely a major top. But it’s too early to call for long term bearish reversal at this point. Rebound from around 38.2% retracement of 75.56 to 151.93 at 122.75 will keep the case open for price action from 151.93 to be just a corrective pattern.


