
As geopolitical tensions rise, the financial markets are inundated with heightened volatility and uncertainty. The bond market is particularly sensitive, evidenced by the 10-year Treasury yield soaring to 5% for the first time since 2007. This spike is multifaceted, driven in large part by a ballooning bond supply and the persistent geopolitical crises.
Amidst these turbulent times, US yield curve continues to undergo a rapid normalization, echoing the historical pattern where bear steepening of yield curve precedes a recession. This ominous signal is being corroborated by the prevailing bearish sentiment sweeping across global stock markets. Gold’s strong rally is also a result of increasing uncertainties.
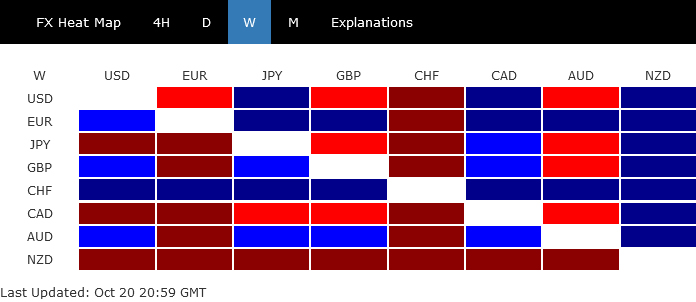
In the currency realm, Dollar didn’t capitalize on the prevailing risk-off sentiment and surging yield, and ended the week just mixed. While Dollar Index’s near term consolidation could extend, overall bullish outlook is maintained, with rising yields and market risks fortifying, not undermining, its standing.
Swiss Franc asserted its dominance as a safe-haven asset and ended as the best performer of the week. However, that also places SNB at a pivotal juncture that could prompt a rethink of its intervention strategy. Euro followed as the second strongest, despite being pushed to an important support by the Franc.
Australian Dollar clinched the title of the third strongest currency, aided in part by its performance against New Zealand Dollar. Kiwi found itself at the opposite end of the spectrum, bearing the brunt of disappointing Q3 inflation data that dampened the urgency for another imminent rate hike by RNBZ. Canadian Dollar and Yen didn’t fare much better, while Sterling found its place in the middle ground, showcasing a mixed performance as the week wound to a close.
Treasury yields surge amid surging bond supply and geopolitical tensions
The fervent rally in long-dated US Treasury yields surged anew last week. In a significant movement, the 10-year Treasury yield pierced the 5% mark for the first time since 2007, although it later receded to close the week at 4.924%. Current market dynamics suggest that this rally is far from over, with increasing evidence indicating a supply-demand imbalance as a principal factor behind the recent dramatic selloff in US government bonds.
Diving into the details, the supply of bonds has seen an explosive rise, with some market watchers likening it to a “tsunami of issuances”. This surge is attributed to the expanding US government budget deficit, which ballooned to a whopping USD 1.695T in fiscal 2023, reflecting a 23% increase from the previous year. Further compounding the situation, the federal government rolled out USD 15.7T in new securities this year, marking a 26% ascent compared to the same duration last year. Amplifying these figures, the Fed’s aggressive tightening stance has consequently elevated debt-servicing costs.
Global geopolitical tensions add another layer to this complex scenario. With escalating conflicts in the Middle East and the ongoing Ukraine-Russia confrontation, the US is being pulled into multiple fronts of tension. In a televised address last week, US President Joe Biden rallied the nation around fortifying the “arsenal of democracy” and championing the “cause of freedom”. He further noted intentions to allocate an additional USD 100B towards new foreign aid and security spending. This funding is earmarked for multiple regions, including Ukraine, Israel, Indo-Pacific, and border security initiatives. The deficit, and by extension the bond supply, could burgeon further if new conflict zones emerge.
Balancing this overwhelming supply, the purchase of US securities by international holders isn’t catching up. While countries like Japan and financial powerhouses such as London, Belgium, Luxembourg, Switzerland, the Cayman Islands, and Ireland continue to bolster their holdings, China and Hong Kong – the second-largest US creditors – appear to be trimming their positions. This shift is particularly significant as the Fed is concurrently embarking on a quantitative tightening journey.
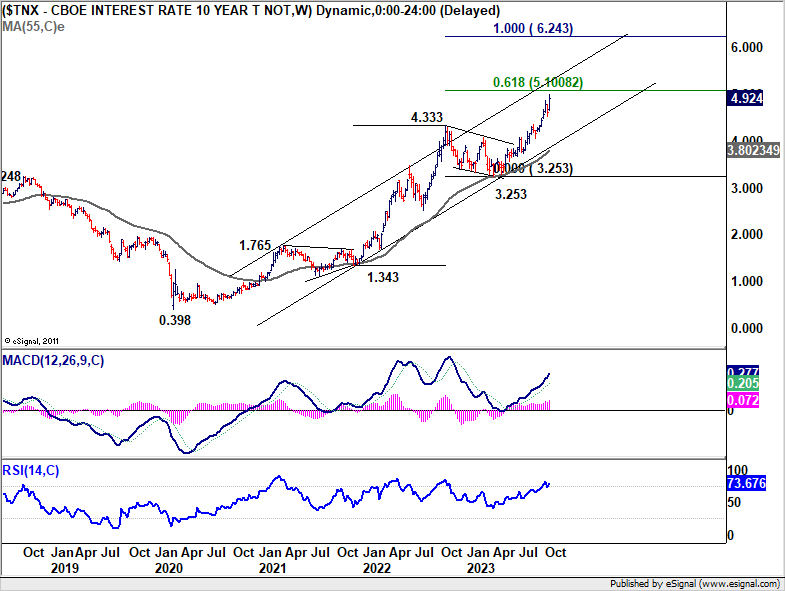
From a technical perspective, the current levels of 10-year yield were barely conceivable six months ago when rates were languishing below 3.5%. But today, the reality is different. TNX’s up trend is now in progress to 61.8% projection of 1.343 to 4.333 from 3.253 at 5.100. A break there is likely, based on current momentum.
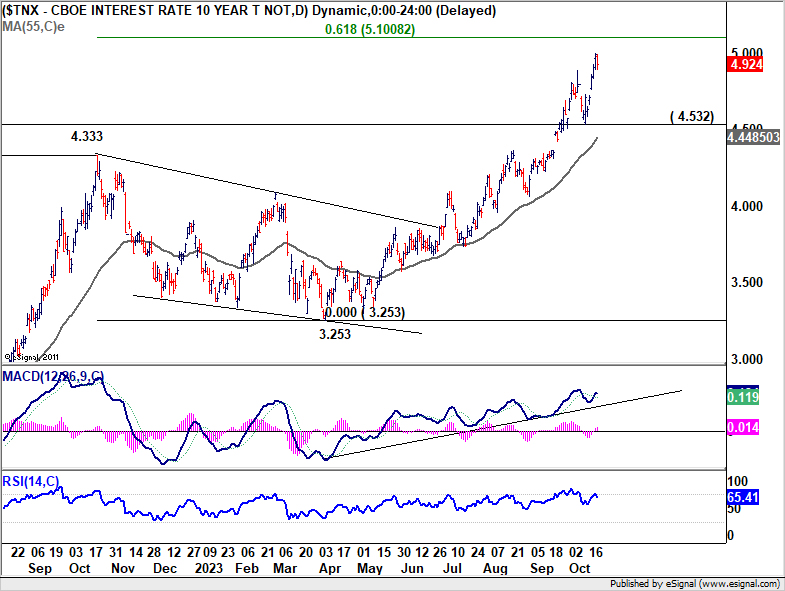
What remains to be seen is how the market will respond to the long-term channel resistance, currently approximated at around 5.25%. If this resistance proves robust and rejects further advances, it could indicate a stabilization of sorts for the US bond markets, suggesting the formation of a yield top. Conversely, if TNX manages to break through this critical resistance decisive, it could herald further upward acceleration, altering market dynamics and expectations profoundly.
Bear steepening of yield curve, while global stock markets reflect rising concerns
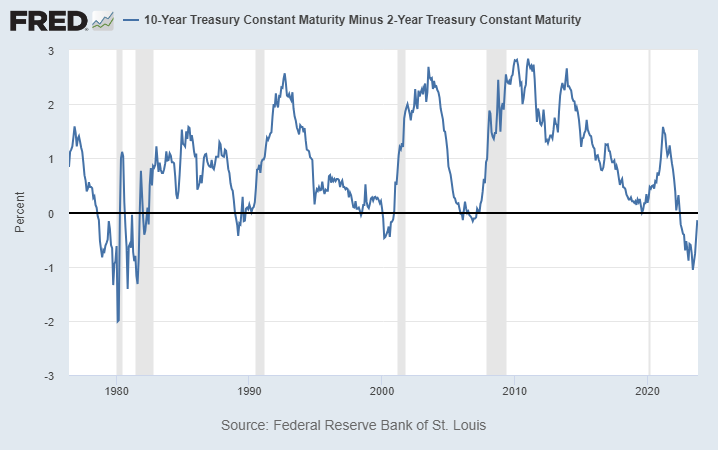
Another significant development must also be mentioned again. Some called it yield curve’s “bear steepening”, some call it “de-inverting.” What ever it’s called, US yield curve normalized swiftly again, with 10- to 2-yr spread narrowing to just -0.14, comparing to as much as -1.08 just in July.
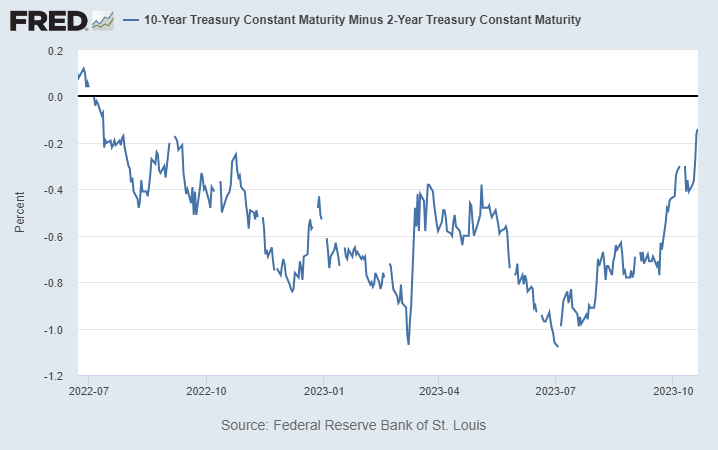
In the past four recessions in the US, before the recession begins, every single time, you see the un-inversion happening. That is the steepening occurs before the beginning of the recession.
A look at the global stock markets indicate bearish sentiment in brewing, which is inline with an upcoming recession in the US, and possibly a global one.
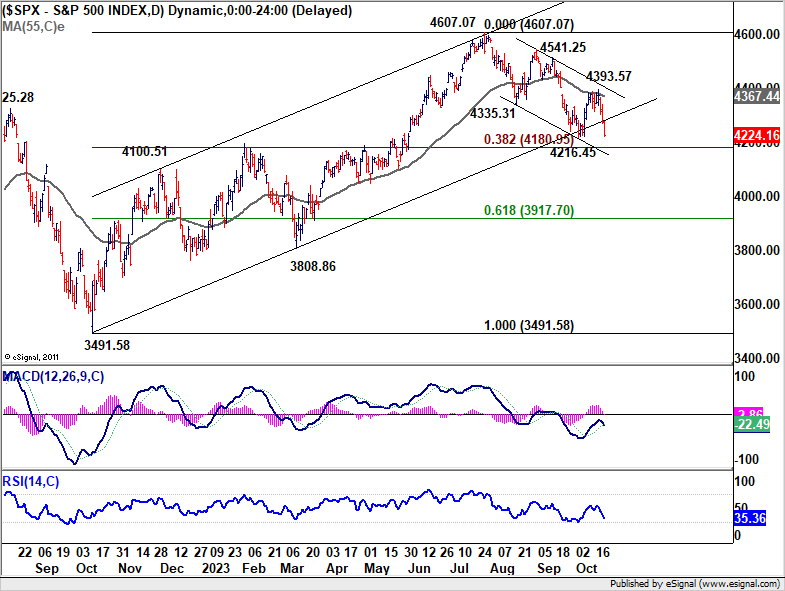
S&P 500’s steep decline last week confirms rejection by falling 55 D EMA (now at 4367.44), keeping near term outlook bearish. Break of 4216.45 support should be seen very soon as fall from 4607.07 resumes. The key support level is in 38.2% retracement of 3491.58 to 4607.07 at 4180.95. Strong rebound from there would keep the up trend from 3491.58 intact. However, sustained break of 4180.95 would strengthen the case of trend reversal, and trigger downside acceleration to 61.8% retracement at 3917.70 next.
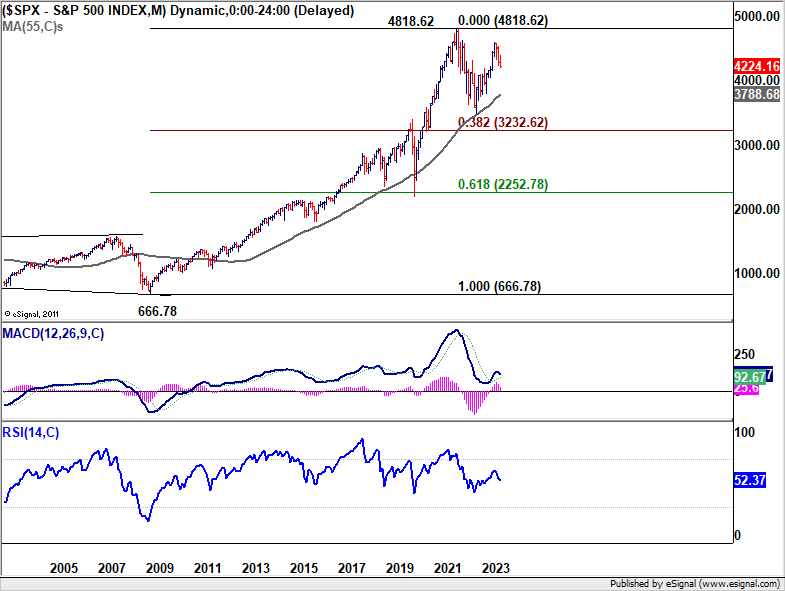
More importantly, if it turns out that the fall from 4670.07 is a medium term down trend, it could then be seen as the third leg of the long term corrective pattern from 4818.62 (2022 high). Next line of defense will be 55 M EMA (now at 3788.68). But SPX might need to take on 38.2% retracement of 666.78 (2009 low) to 4818.62 at 3232.62 before completing the pattern.
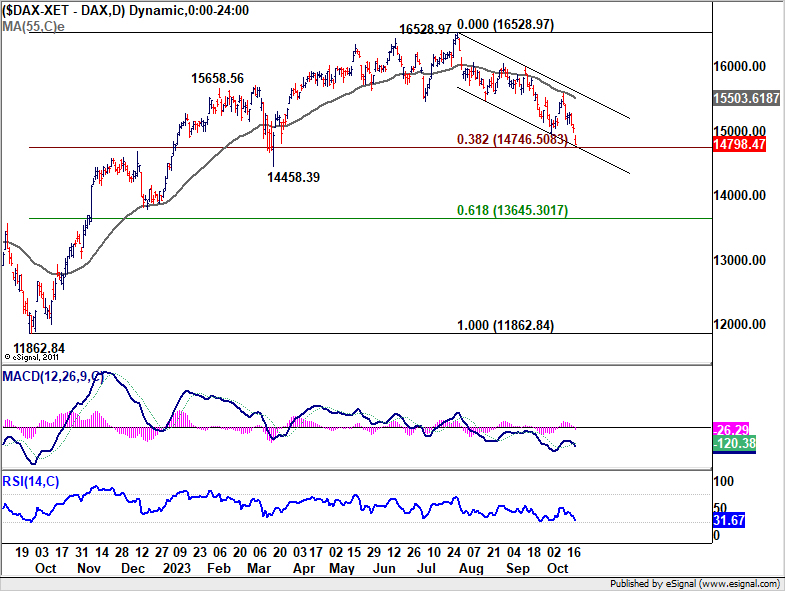
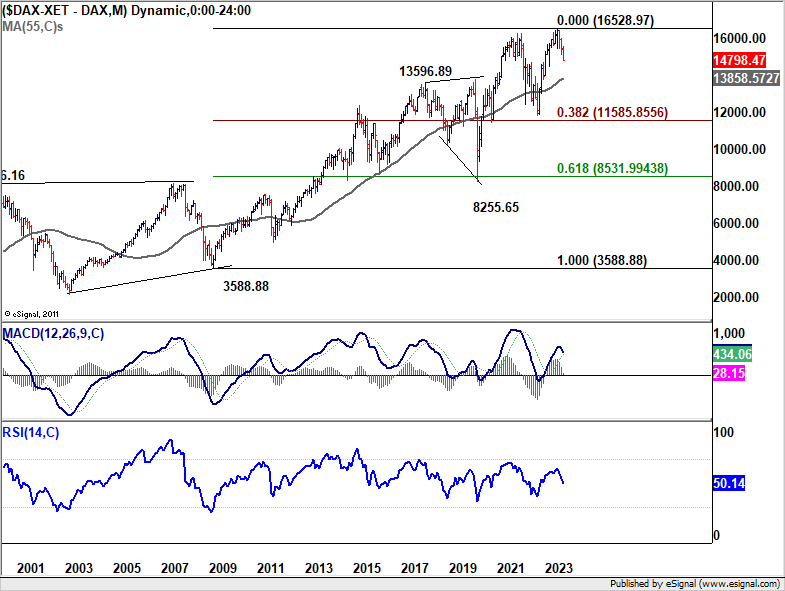
DAX resumed the decline from 16528.97 last week. Near term outlook is kept bearish with prior rejection by falling 55 D EMA (now at 15503.61). Immediate focus is now on 38.2% retracement of 11862.84 to 16528.97 at 14746.50. Strong rebound from this level will keep the up trend from 11862.84 intact. However, sustained break will raise the chance of trend reversal and target 61.8% retracement at 13645.30.
In the bearish case for DAX, fall from 16528.97 could extend to 38.2% retracement of 3588.88 (2009 low) to 16528.97 at 11585.85), which is close to 11862.84 support, before finding a bottom.
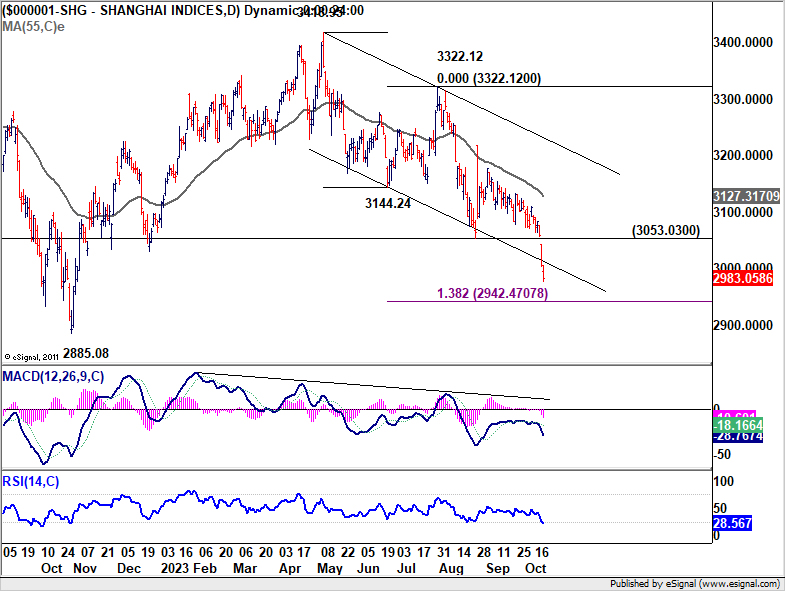
The selloff in Chinese stocks was even worse as Shanghai SSE broke below 3000 psychological level for the first time in nearly a year. Ongoing troubles in the real estate sector have affected the risk appetite. Rising bond yields around the world weighed on the Chinese market as well. Morgan Stanley also issued a noted advising investors against buying the dip in Chinese stock. It pointed out that foreign investors’ outflow has entered “an unprecedented stage.”
Technically, the break of medium term channel support in SSE indicates downside acceleration. Near term outlook will remain bearish as long as 3053.03 support turned resistance holds. Next target is 138.2% projection of 3418.95 to 3144.24 from 3322.12 at 2942.47.
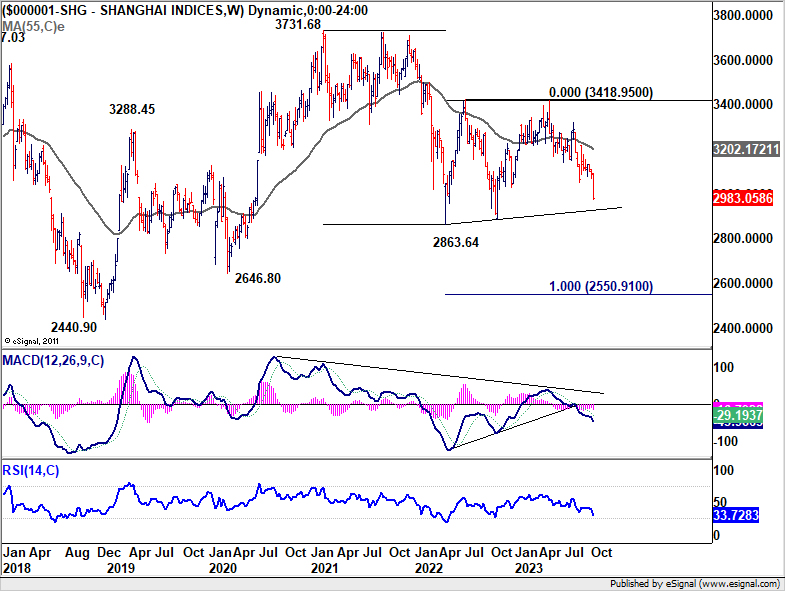
More importantly, it’s possible that fall from 3148.95 is resuming whole down trend from 3731.68. Firm break could 2863.63 support could set the stage for deeper medium term decline to 100% projection of 3731.68 to 2863.64 from 3418.95 at 2550.91.
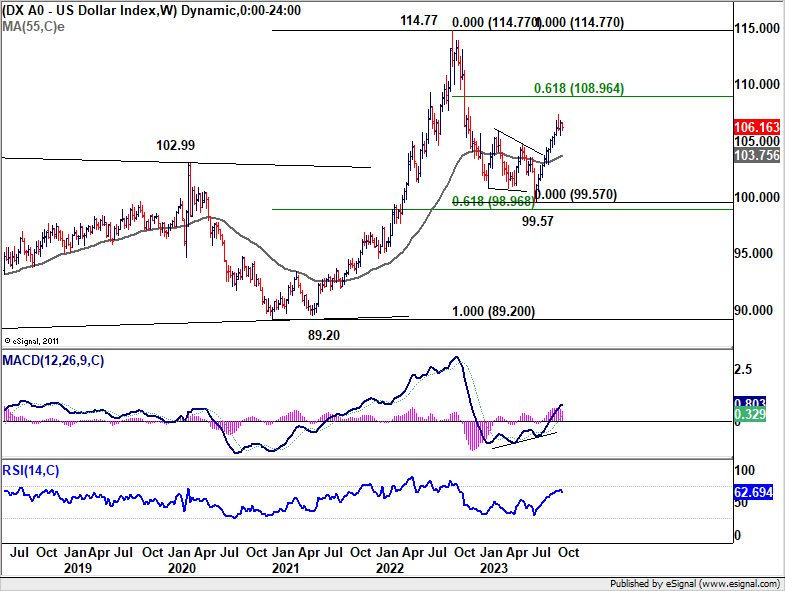
Dollar index continued near term consolidations, but stays bullish
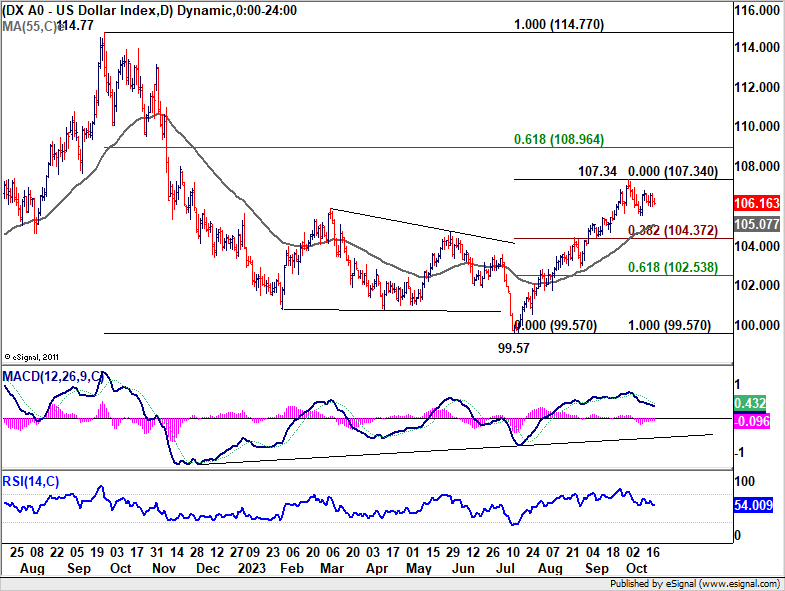
Despite the tumultuous nature of last week’s financial markets characterized by escalating yields and intensifying risk aversion, Dollar Index remained relatively unmoved, just engaged in sideway trading below 107.34 short term top.
This inertia, however, isn’t an indication of weakened prospects. The bullish outlook on Dollar Index remains steadfast. Rising yields and heightened sense of market trepidation are anticipated to floor Dollar’s retreat and could potentially underpin a resurgence in its value at a subsequent stage.
While deeper pull back cannot be ruled out, downside should be contained by 38.2% retracement of 99.57 to 107.34 at 104.37 to bring rebound. On the other hand, above 107.34 will resume the rise from 99.57 to 61.8% retracement of 114.77 to 99.57 at 108.96.
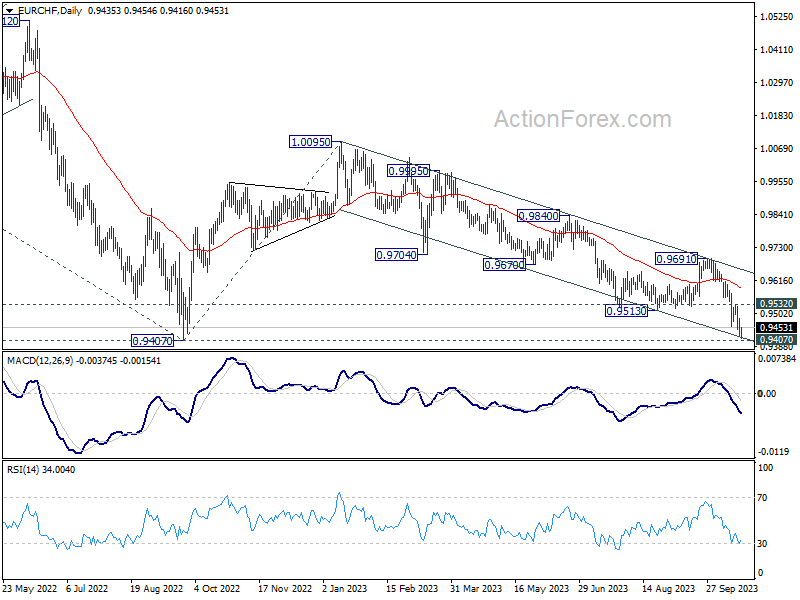
Will Swiss Franc’s safe haven allure challenge SNB’s intervention approach?
Swiss Franc magnified its allure as the safe-haven asset of choice last week, outperforming even the resilient Euro.
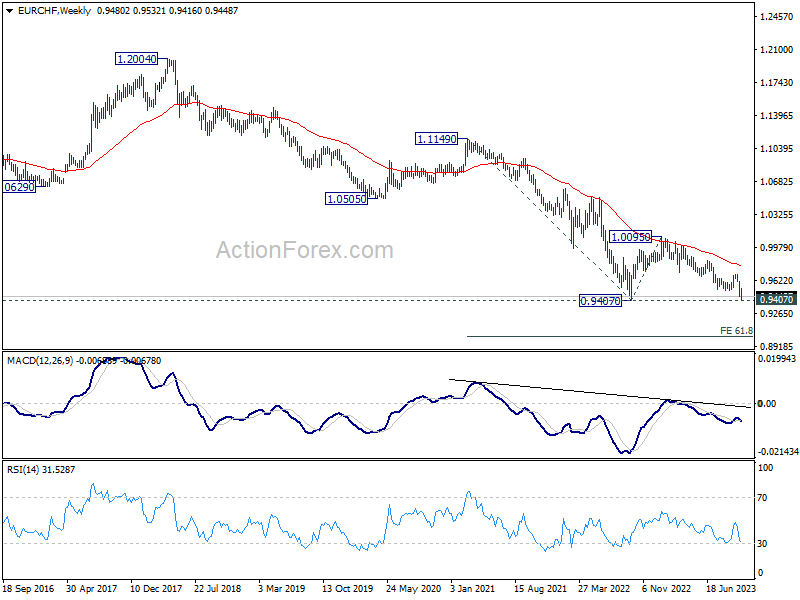
EUR/CHF resumed the down trend from 1.0095 and it’s now pressing 0.9407 key support level. Strong bounce from the current level, followed by break of 0.9532 resistance, will temporarily neutralize bearishness and indicates stabilization in the cross.
However, decisive break of 0.9407 will confirm resumption of whole down trend from 1.2004 (2018 high). Next target will be 61.8% projection of 1.1149 to 0.9407 from 1.0095 at 0.9018.
A pivotal aspect deserving of meticulous attention in this unfolding narrative is SNB’s strategic posture. The institution has consistently signaled its intention to remain “active” in the foreign exchange arena.
Interestingly, SNB’s current activities focus on selling foreign assets, effectively “purchasing” the Franc. This strategy is primarily aimed at mitigating impact of imported inflation. This is a marked departure from their approach during the global financial crisis when the emphasis was on offloading the Franc to stem its appreciation.
It’s noteworthy that a reversal in SNB’s strategy, especially in light of break of 0.9407 support in EUR/CHF and further downside acceleration, could send clear signals to the market that something more substantial is happening, globally.
EUR/USD Weekly Outlook
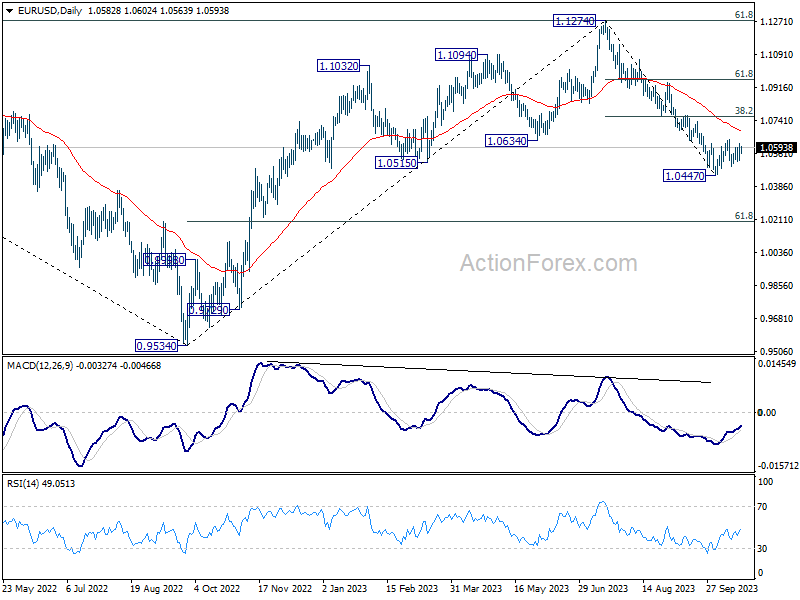
EUR/USD continued to engage in sideway trading last week and outlook is unchanged. Initial bias remains neutral this week first, and downside breakout is in favor. On the downside, firm break of 1.0447 will resume whole fall from 1.1274 and target 1.0199 fibonacci level. On the upside, however, break of 1.0639 turn bias to the upside for 1.0764 cluster resistance (38.2% retracement of 1.1274 to 1.0447 at 1.0763).
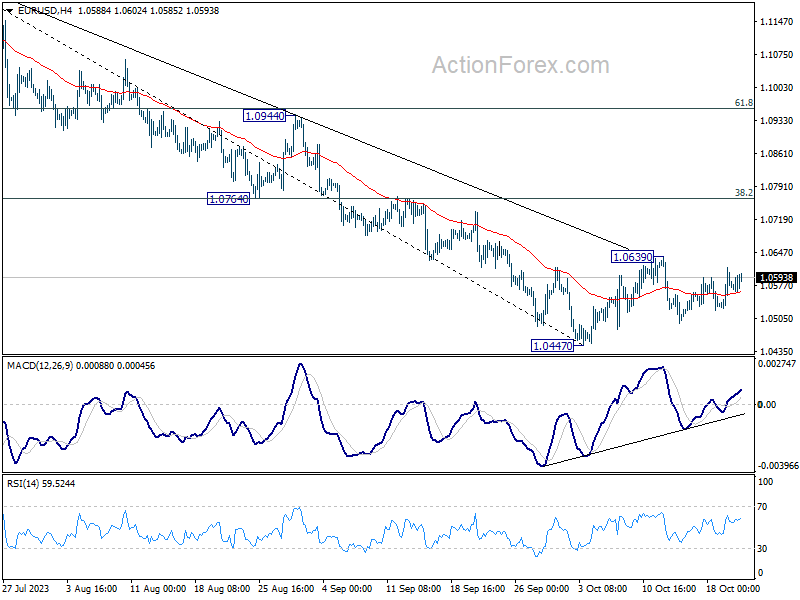
In the bigger picture, fall from 1.1274 medium term top could still be a correction to rise from 0.9534 (2022 low). But chance of a complete trend reversal is rising. In either case, current fall should target 61.8% retracement of 0.9534 to 1.1274 at 1.0199 next. For now, risk will stay on the downside as long as 55 D EMA (now at 1.0684) holds, in case of rebound.
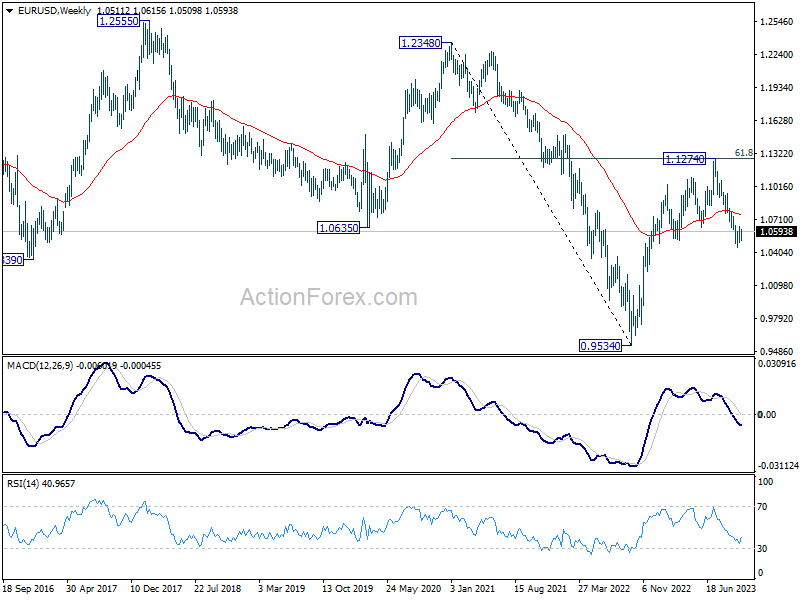
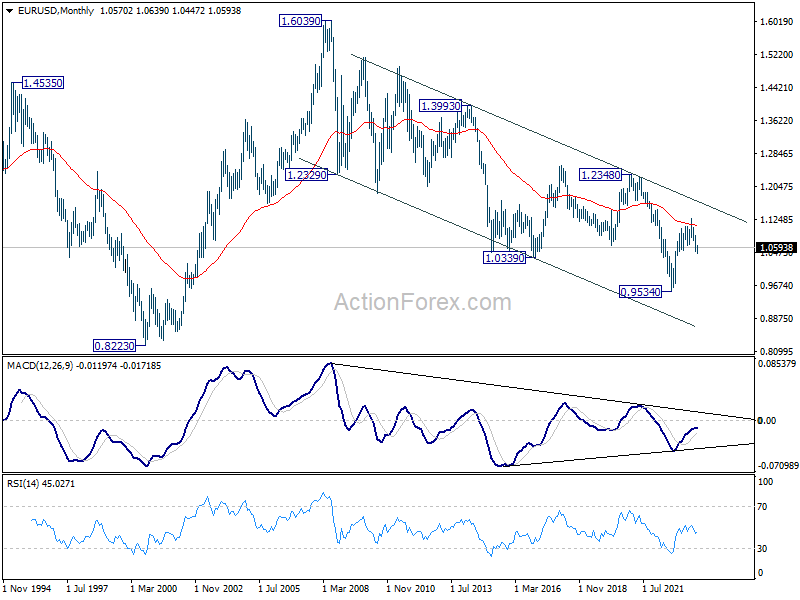
In the long term picture, there is no clear sign of trend reversal yet. That is, down trend from 1.6039 (2008 high) might still be in progress. Rejection by 55 M EMA (now at 1.1087) will retain long term bearishness, for another fall through 0.9534 at a later stage.


