
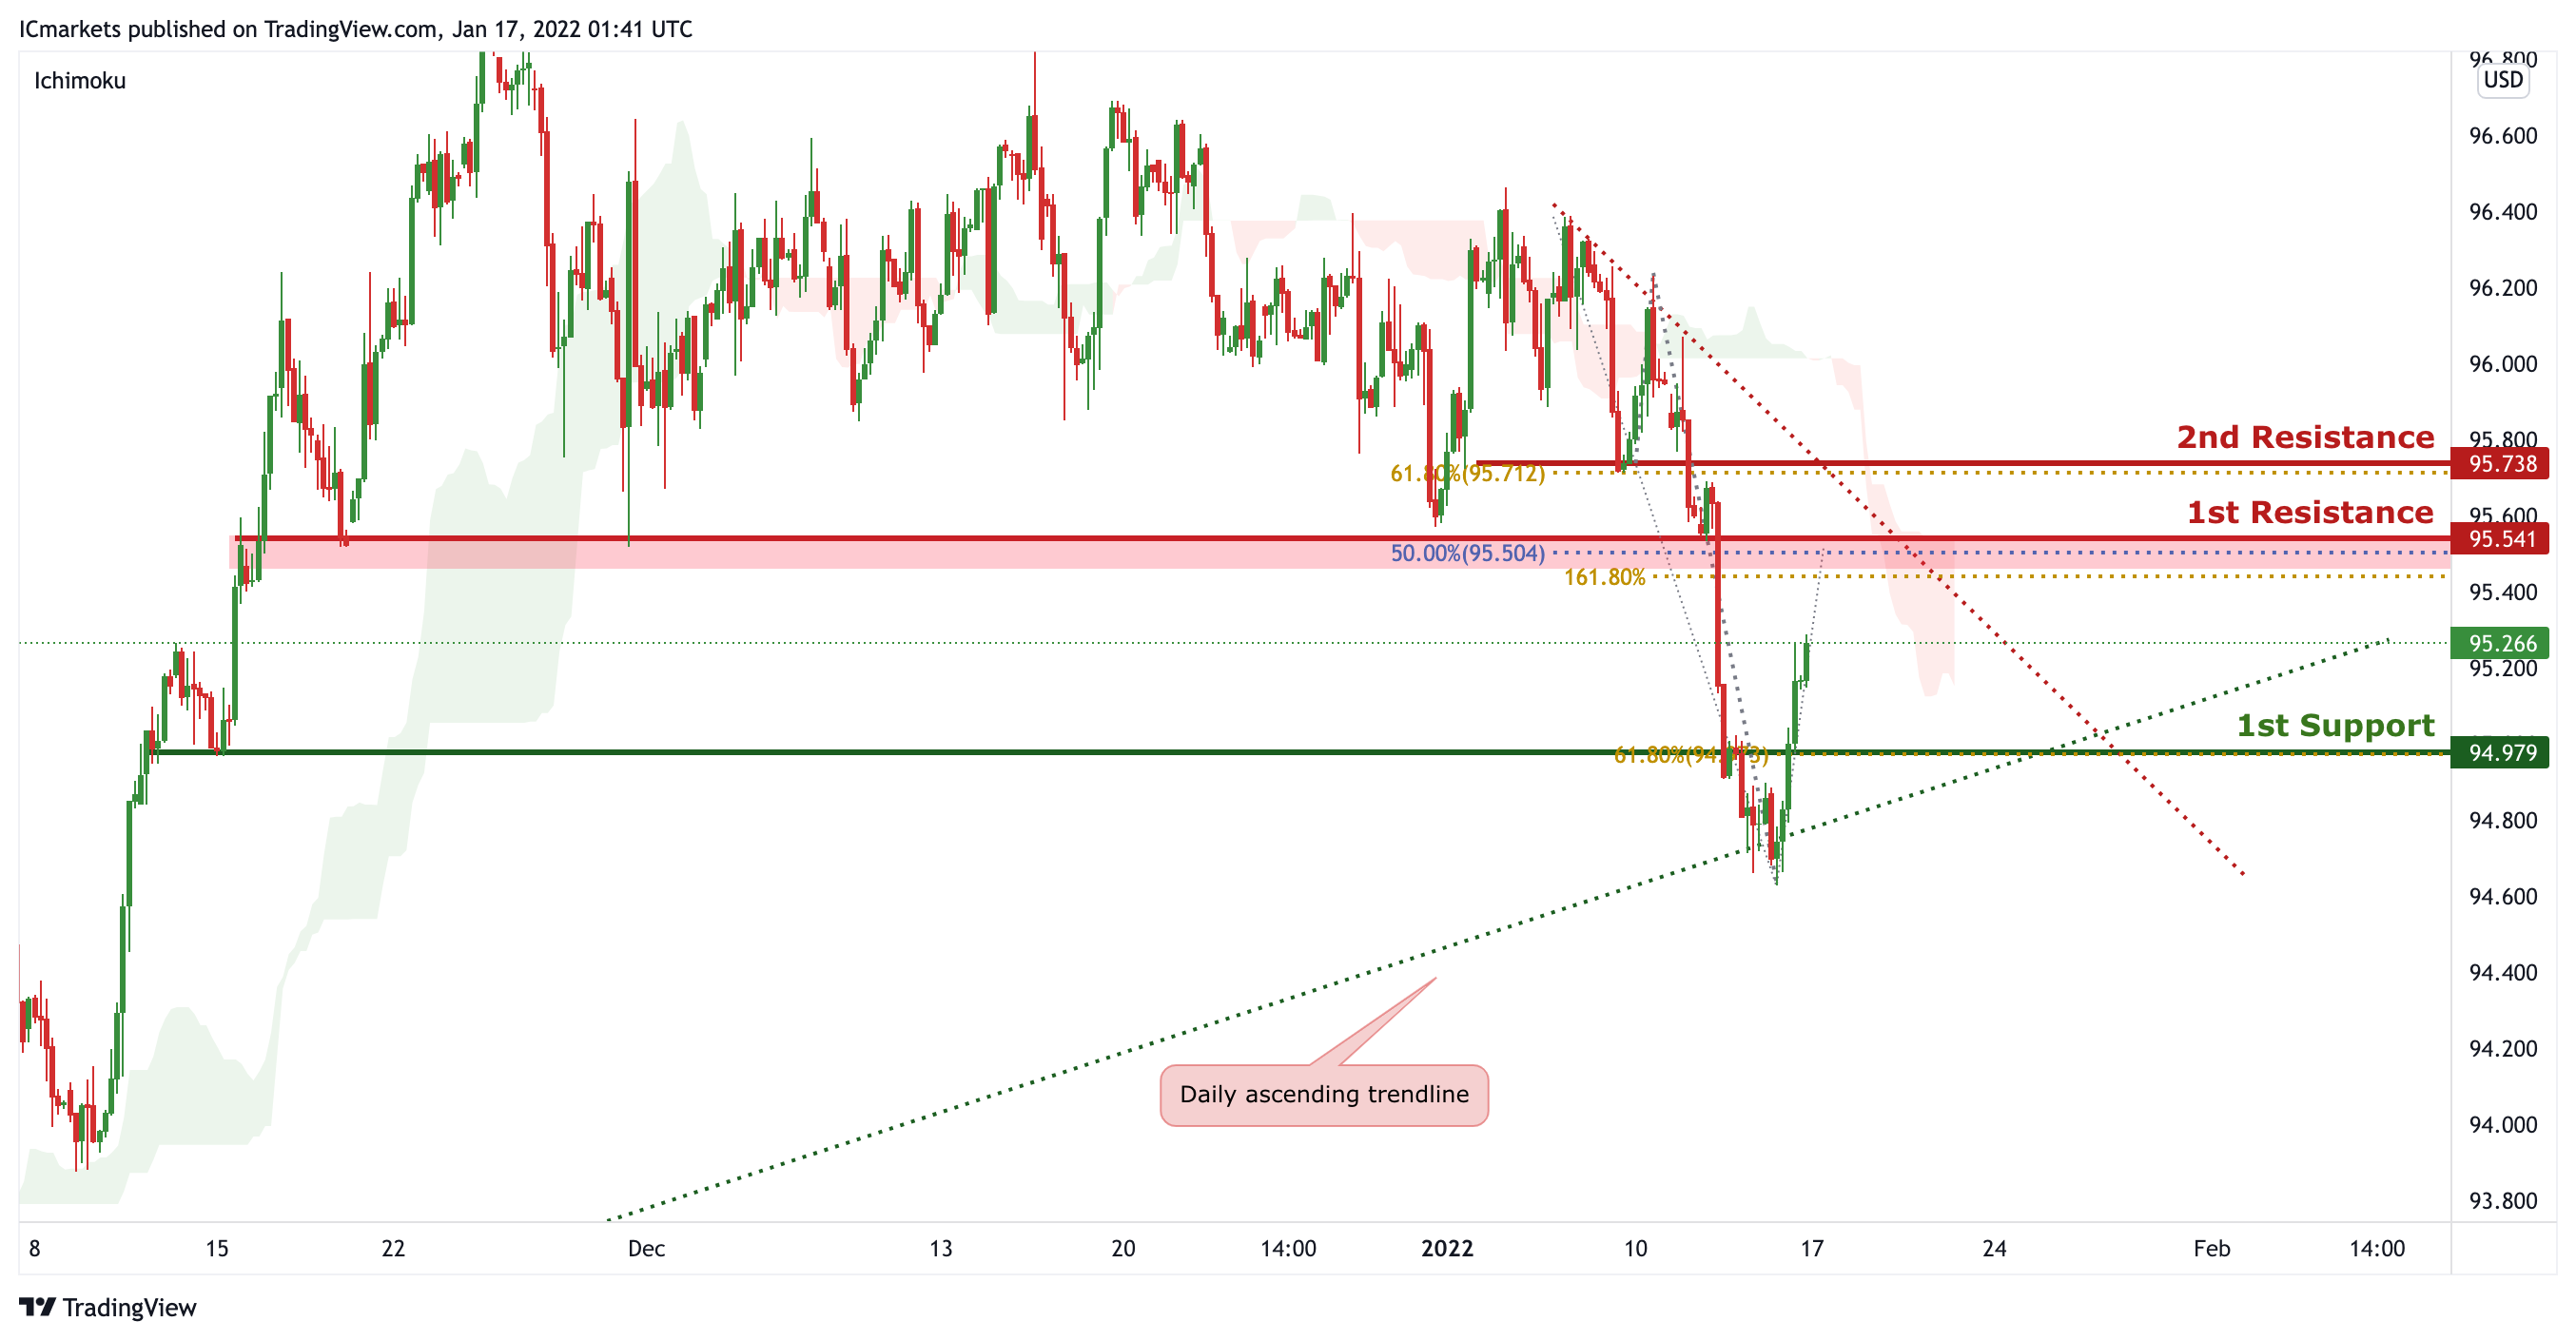
DXY:
On the H4 timeframe, price is abiding to the ascending trendline support on the daily and descending trendline resistance on the H4. We can now expect price to push higher up to the 1st Resistance in line with 50% Fibonacci retracement and 161.8% Fibonacci projection and drop to 1st Support in line with 61.8% Fibonacci retracement. Our short-term bearish bias is further supported by the Ichimoku cloud indicator acting as a resistance.
Areas of consideration:
- H4 time frame, 1st resistance at 95.541
- H4 time frame, 1st support at 94.979
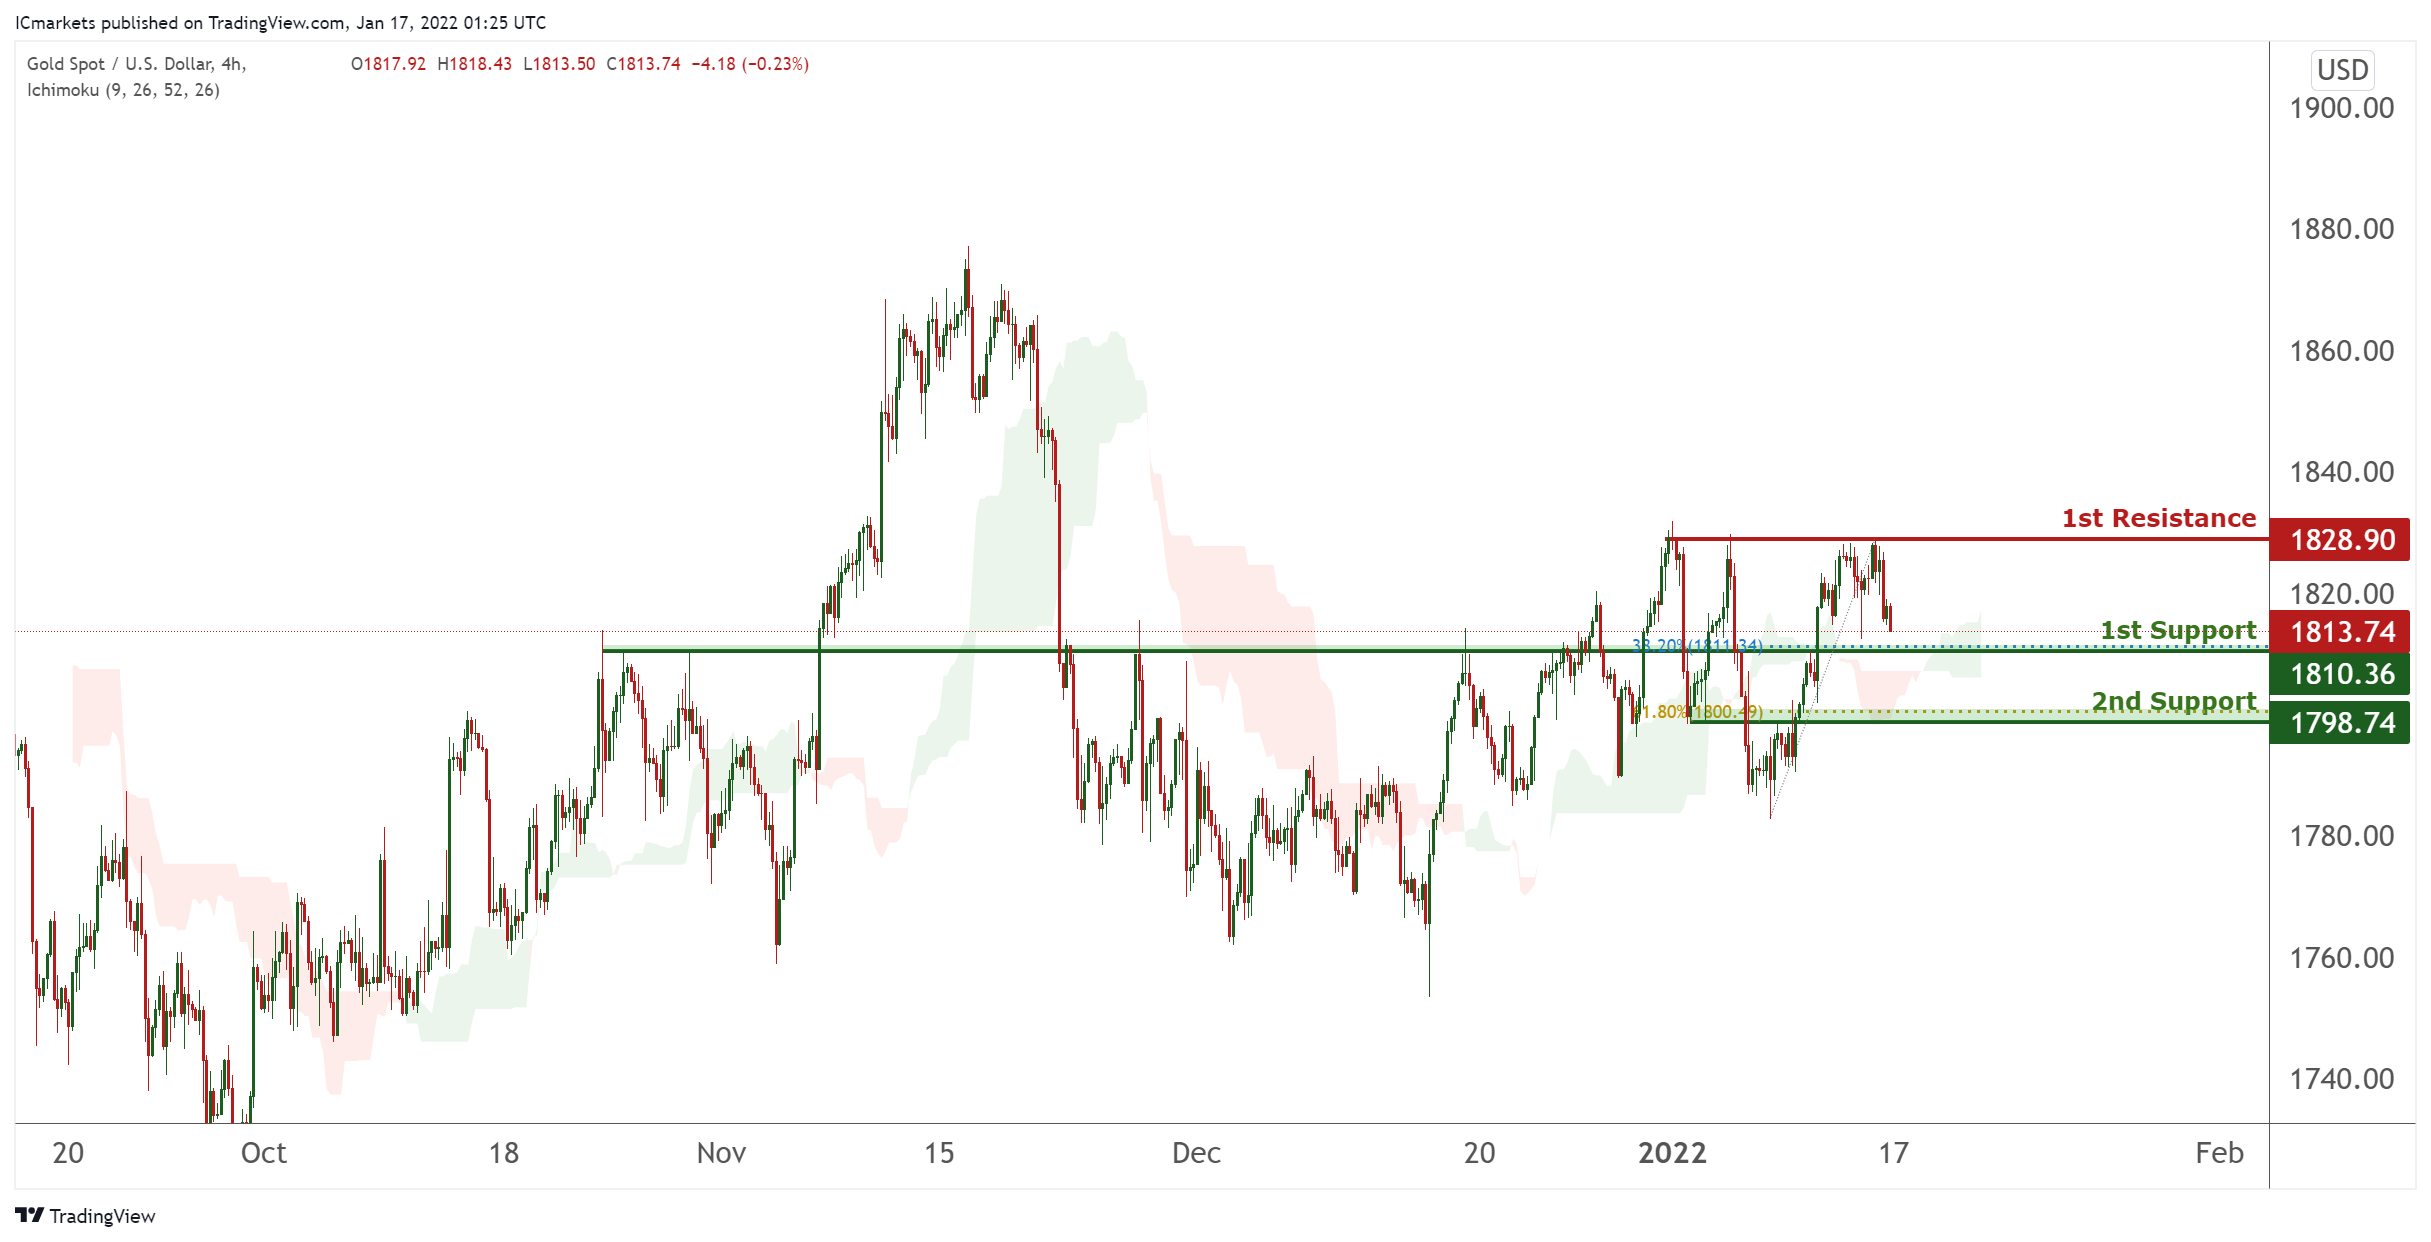
XAU/USD (GOLD):
On the H4, with price moving above the ichimoku cloud, we have a bullish bias that price will rise to our 1st resistance at 1828 which is in line with horizontal swing high resistance from 1st support at 1810, which is in line with horizontal overlap support and 738.2% Fibonacci retracement level. Alternatively, price may break 1st support structure and head for 2nd support at 1798, which coincides with horizontal swing overlap support and 61.8% Fibonacci retracement level .
Areas of consideration:
- 4h 1st support at 1828
- 4h 1st resistance at 1810
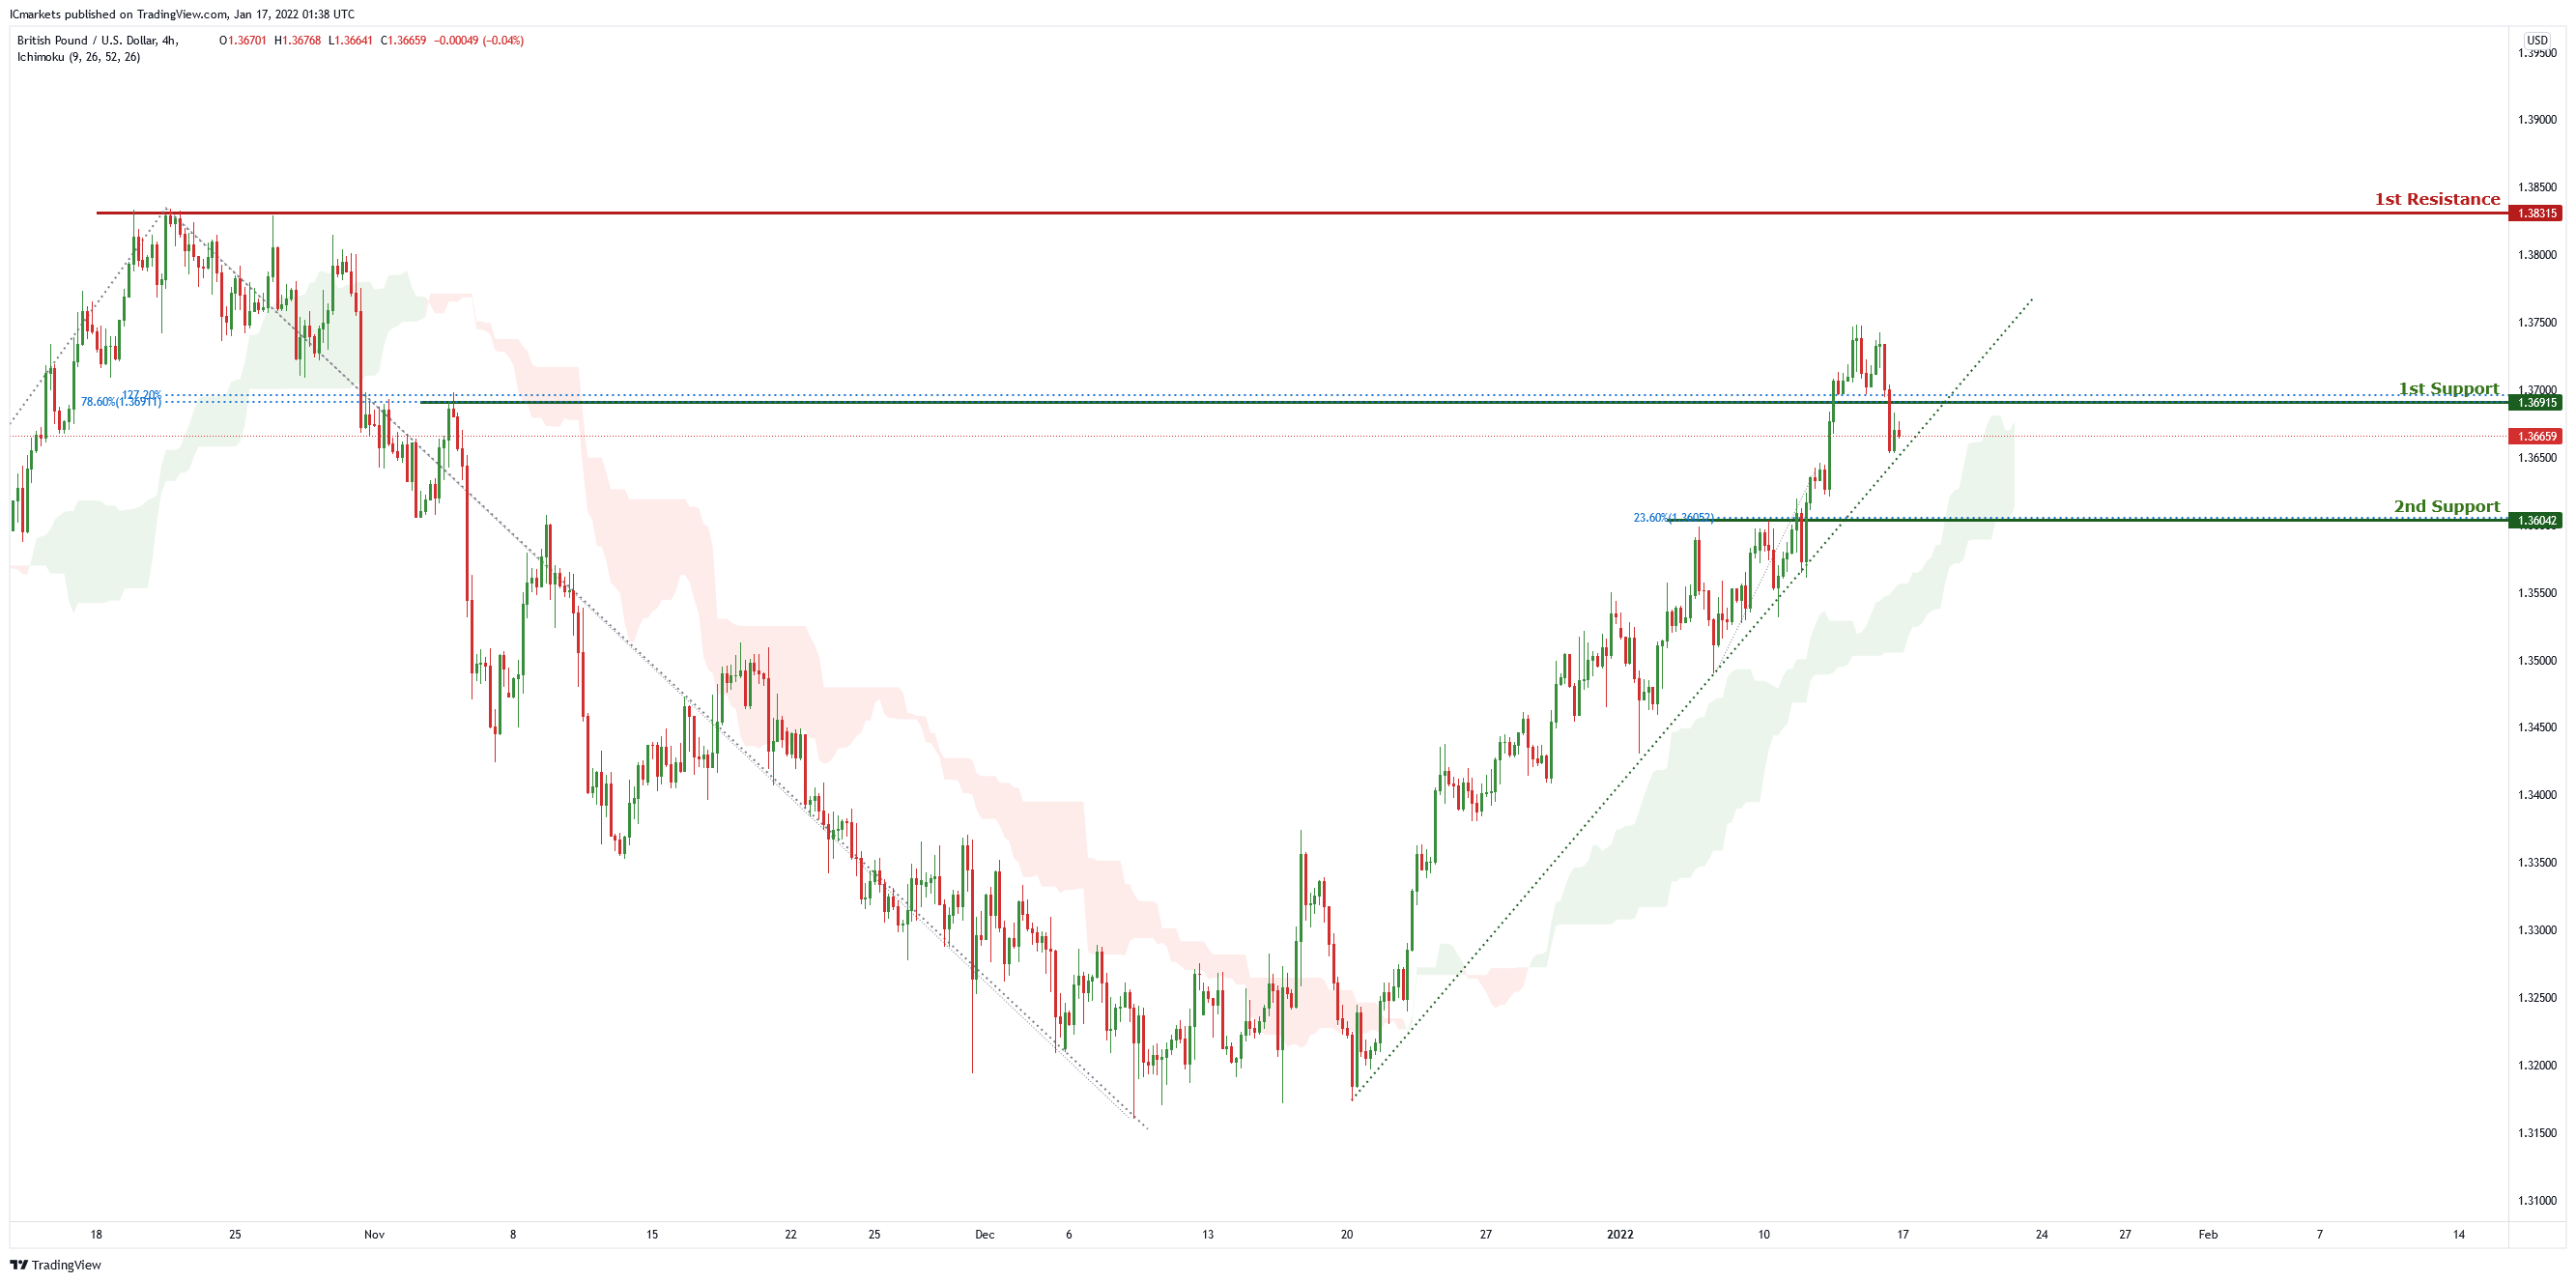
GBP/USD
On the H4 chart price is abiding by an ascending trendline and near the first support level of 1.36915 which is also 78.6%% Fibonacci retracement and 127.2% Fibonacci projection . Price can potentially go to the 1st resistance level of 1.38315 which is the graphical swing high level. Our bullish bias is supported by the ichimoku cloud indicator as price is trading above it.
Areas of consideration:
- H4 1st resistance at 1.38315
- H4 1st support 1.36915
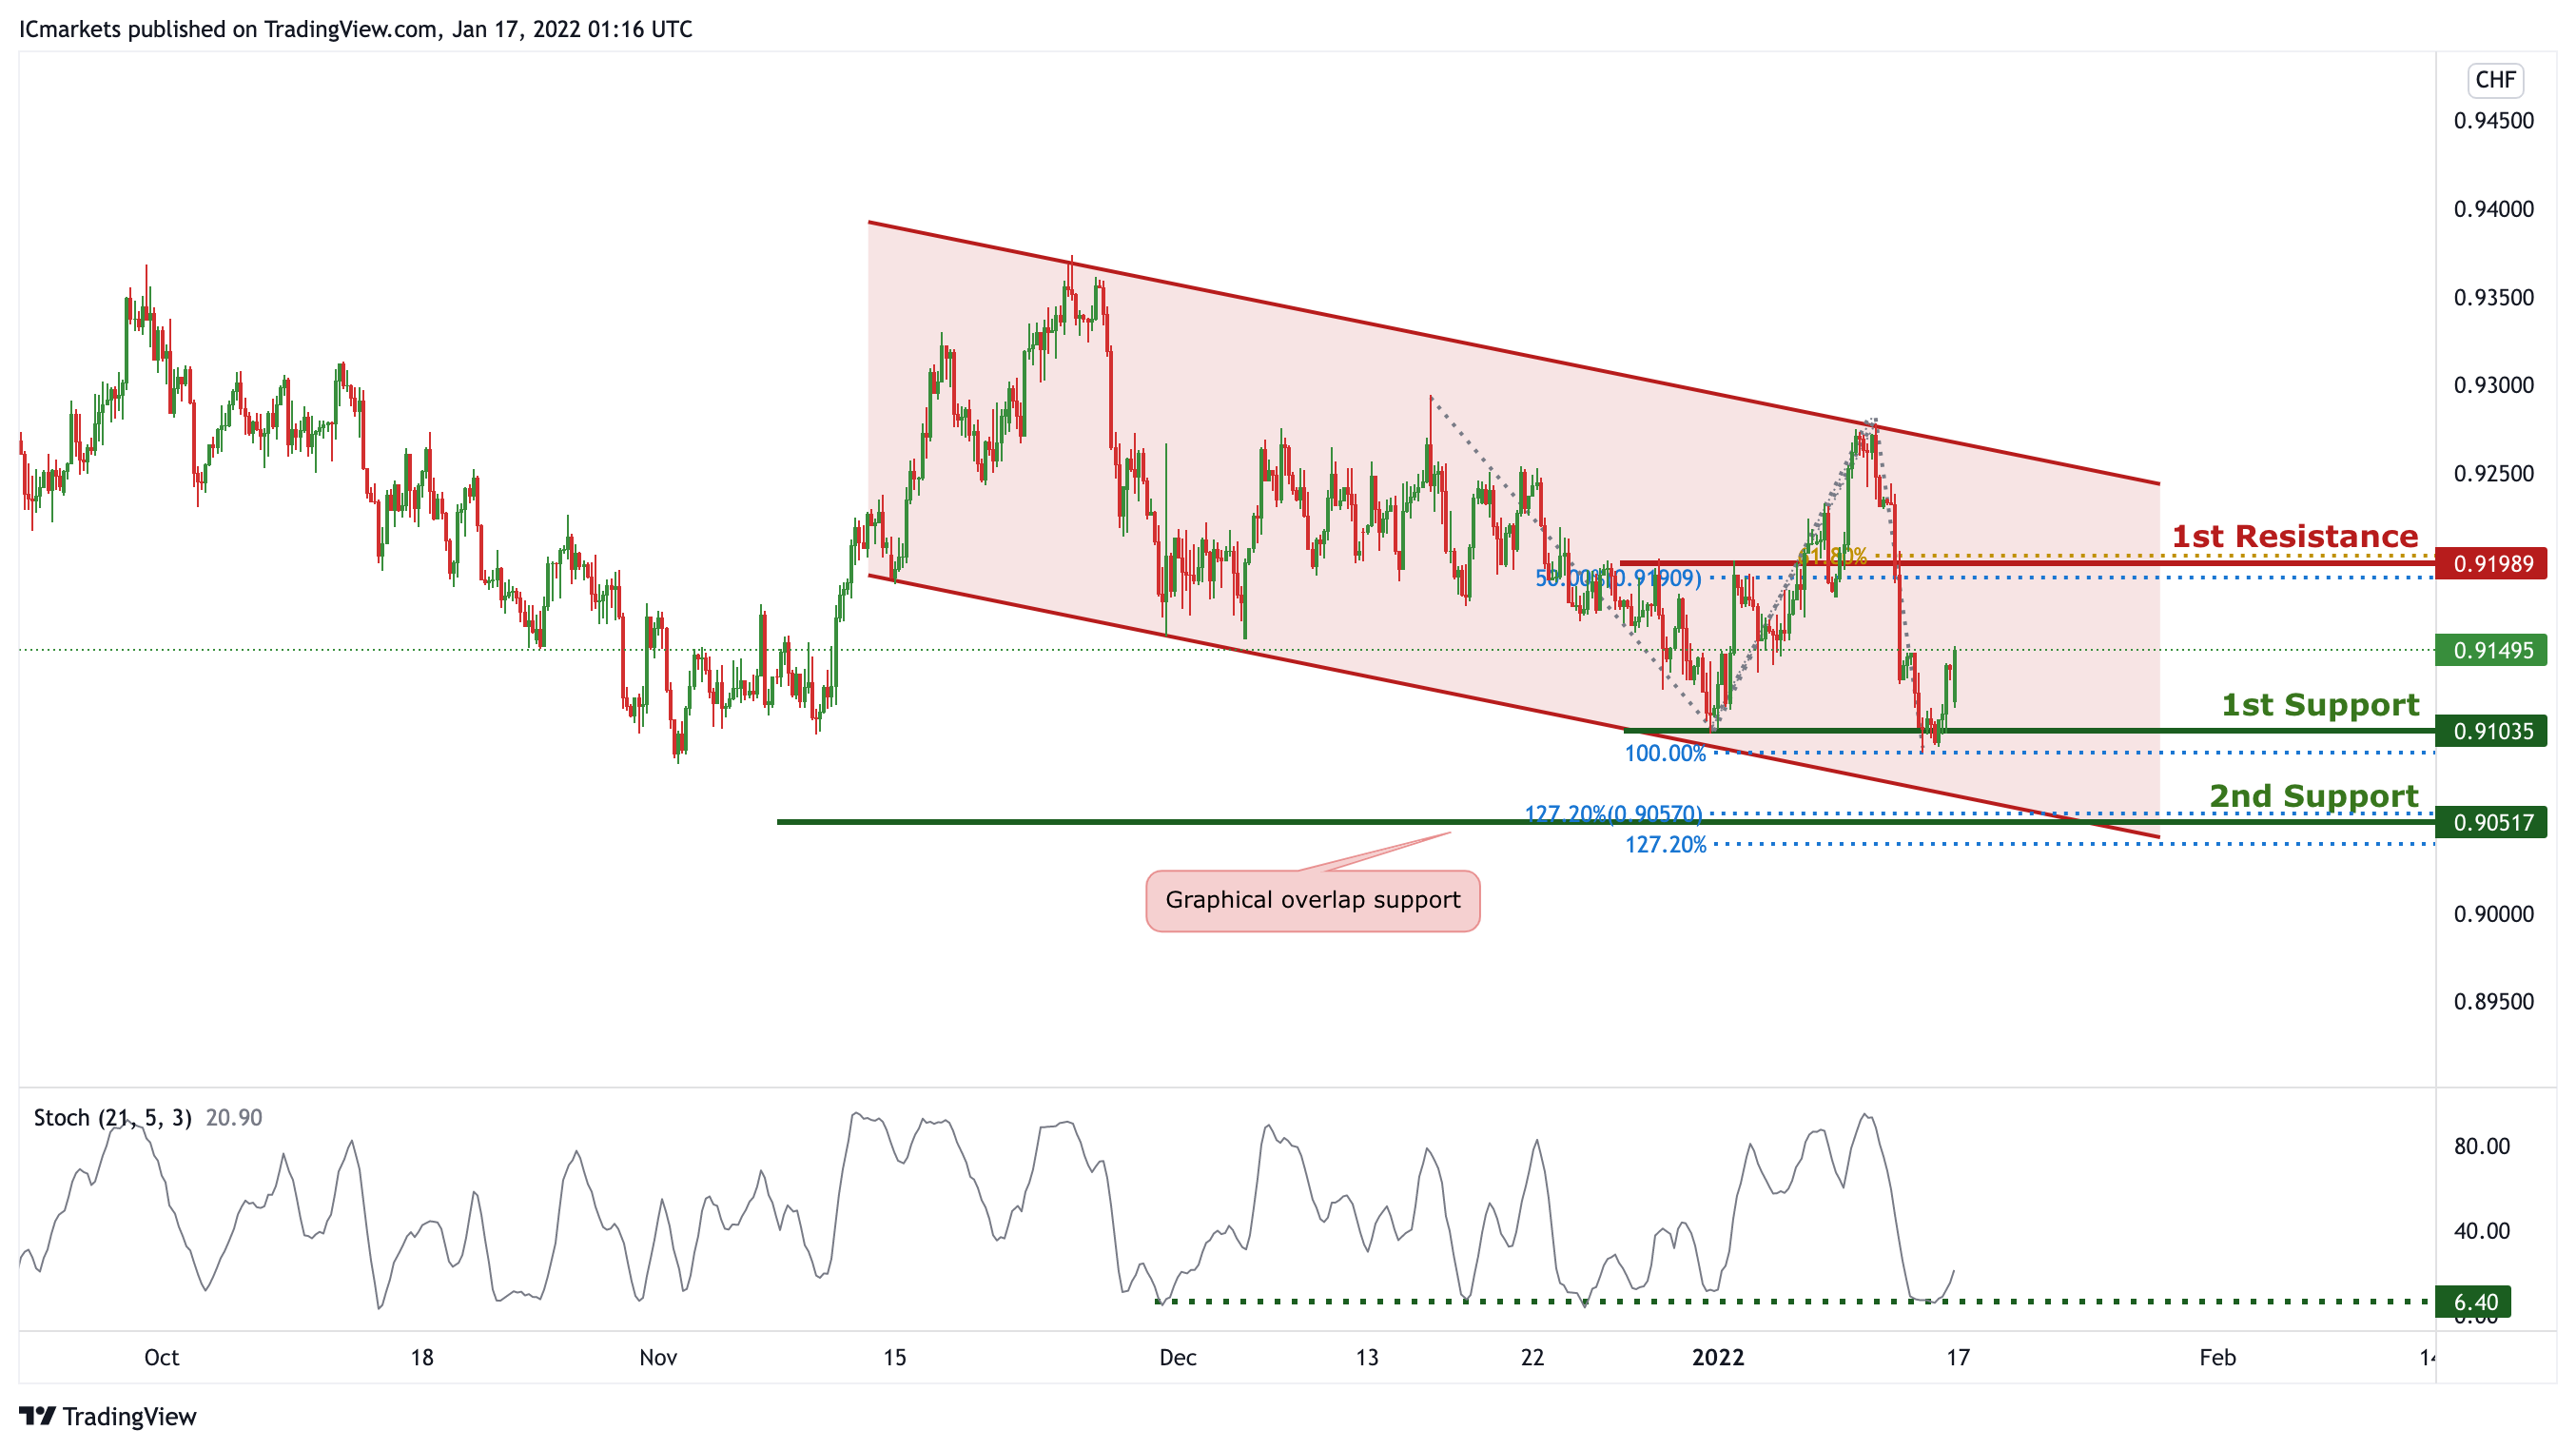
USD/CHF
On the H4 timeframe, price is abiding to a descending channel, signifying a bearish momentum. Price is approaching a support level, we can expect price to make a short-term bullish bounce in line with 78.6% Fibonacci Projection and 161.8% Fibonacci retracement towards 1st Resistance in line with 78.6% Fibonacci projection. Our short-term bullish bias is further supported by the stochastic indicator where the %K line is approaching the support level.
Areas of consideration:
- Watch 1st Support at 0.91113
- Watch 1st Resistance at 0.92698
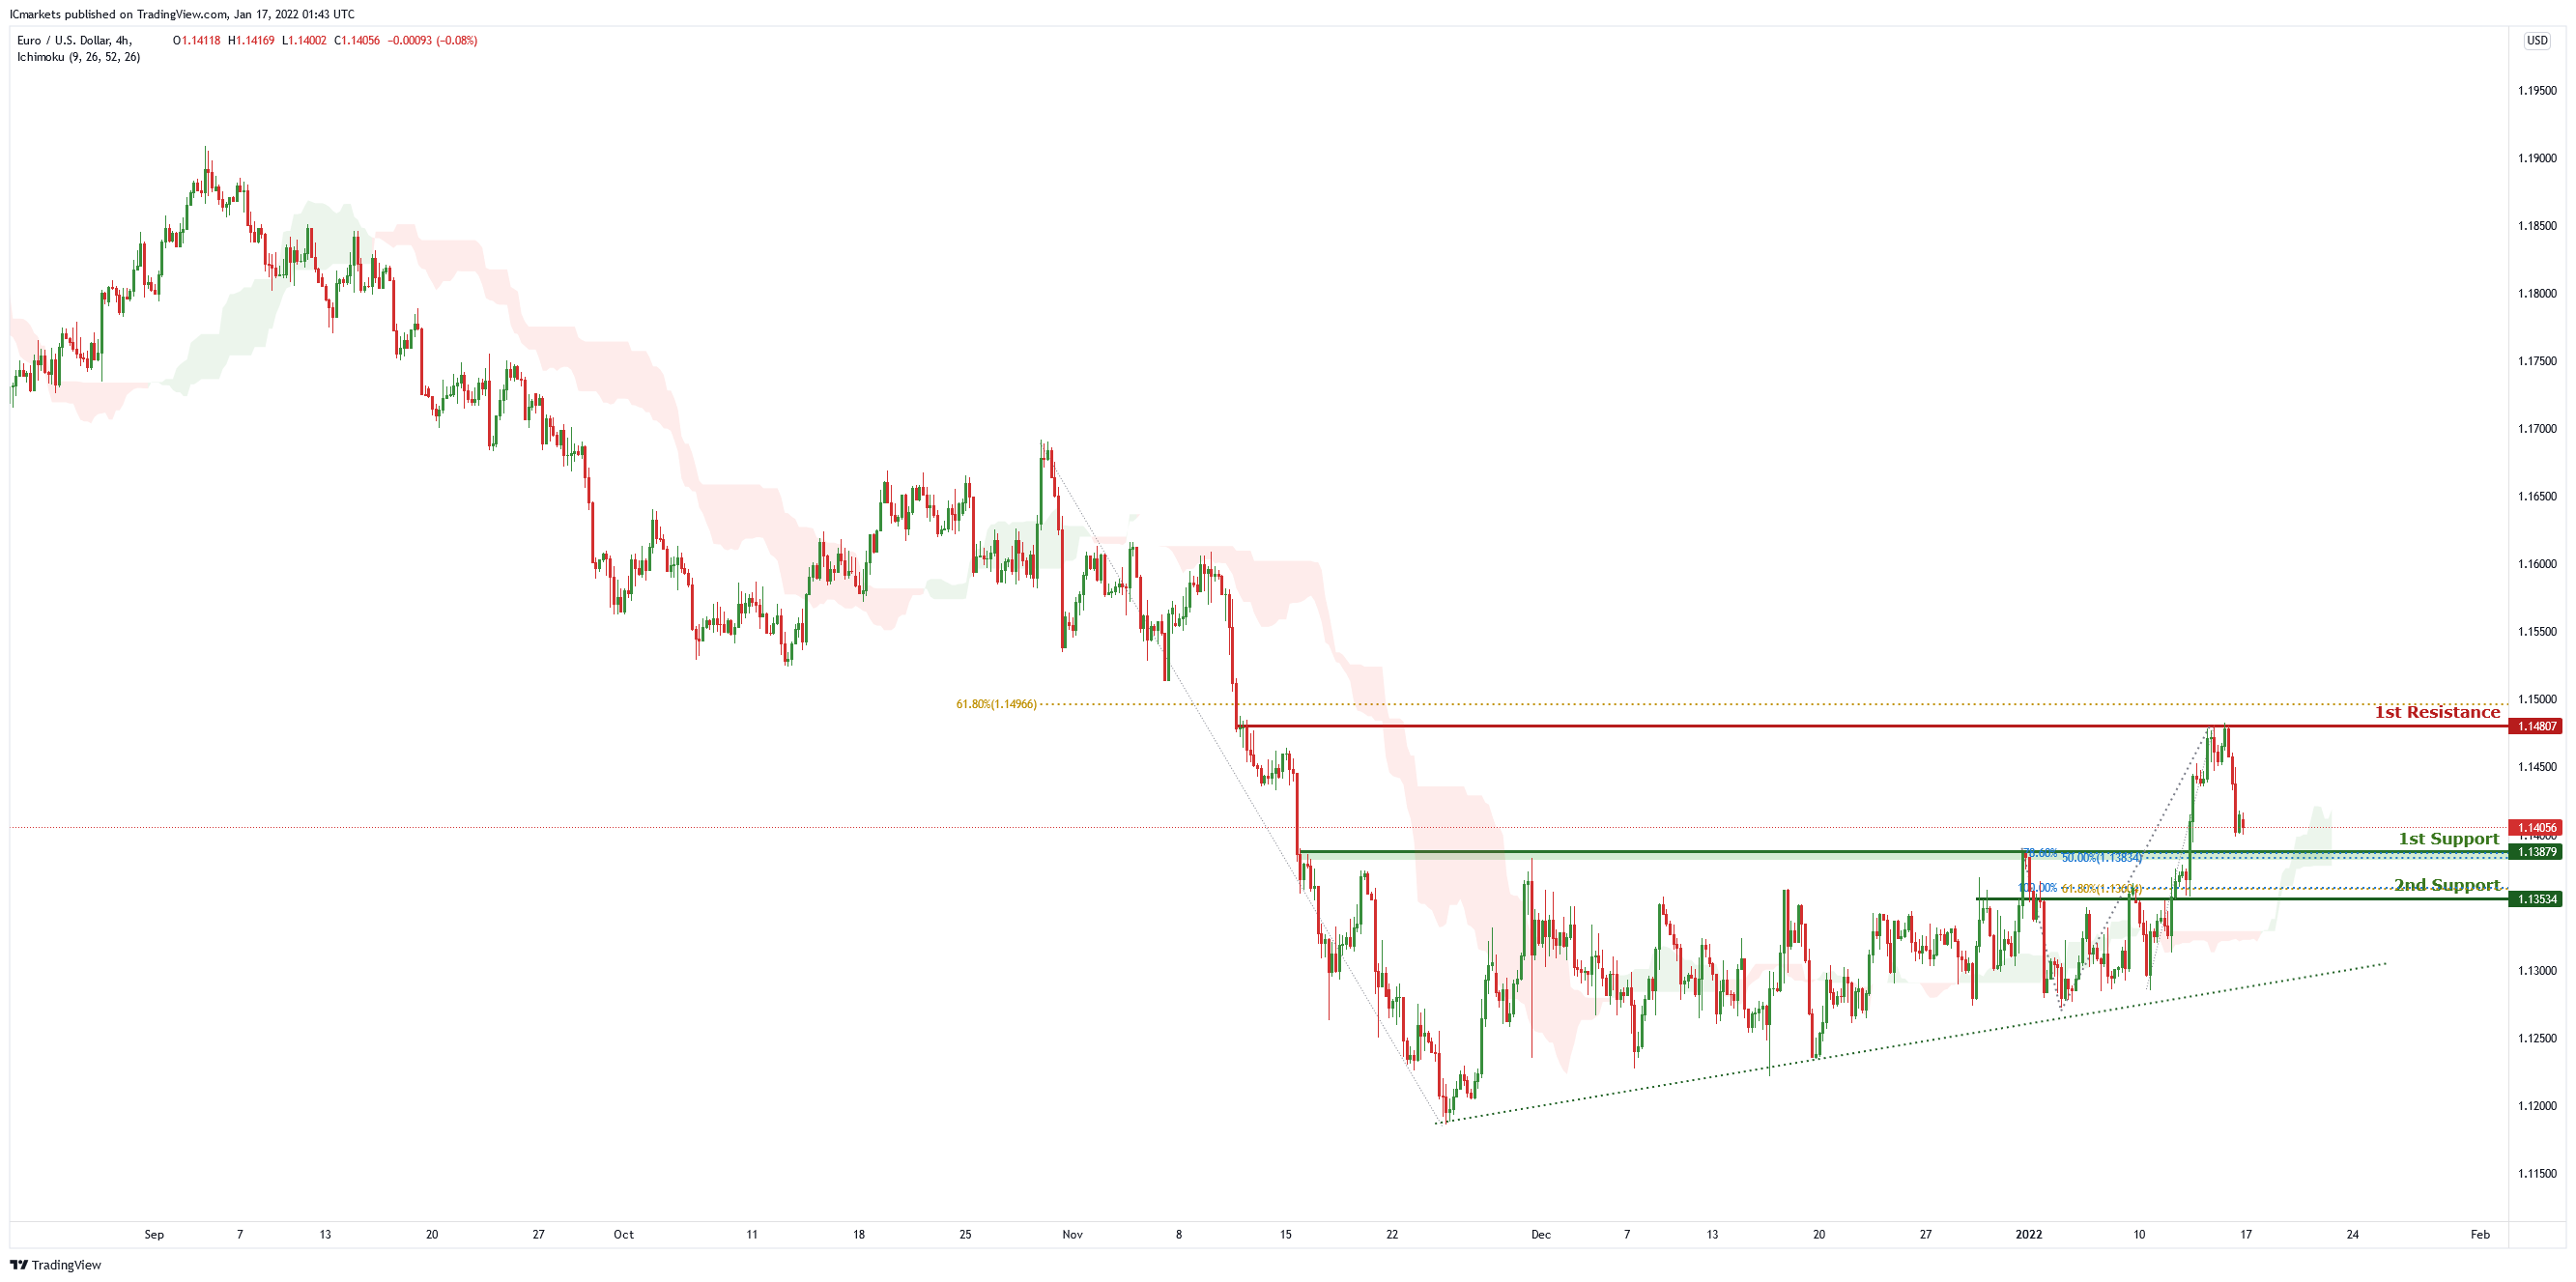
EUR/USD :
On the H4 chart , price is abiding by an ascending trendline and is near 1st support level of 1.13879 which is also 78.6% Fibonacci projection and 50% Fibonacci retracement. Price can potentially go to the 1st resistance level of 1.14807 which is also 61.8% Fibonacci retracement. Our bullish bias is supported by the ichimoku cloud indicator as price is trading above it.
Areas of consideration:
- H4 1st resistance at 1.14807
- H4 1st support at 1.13879
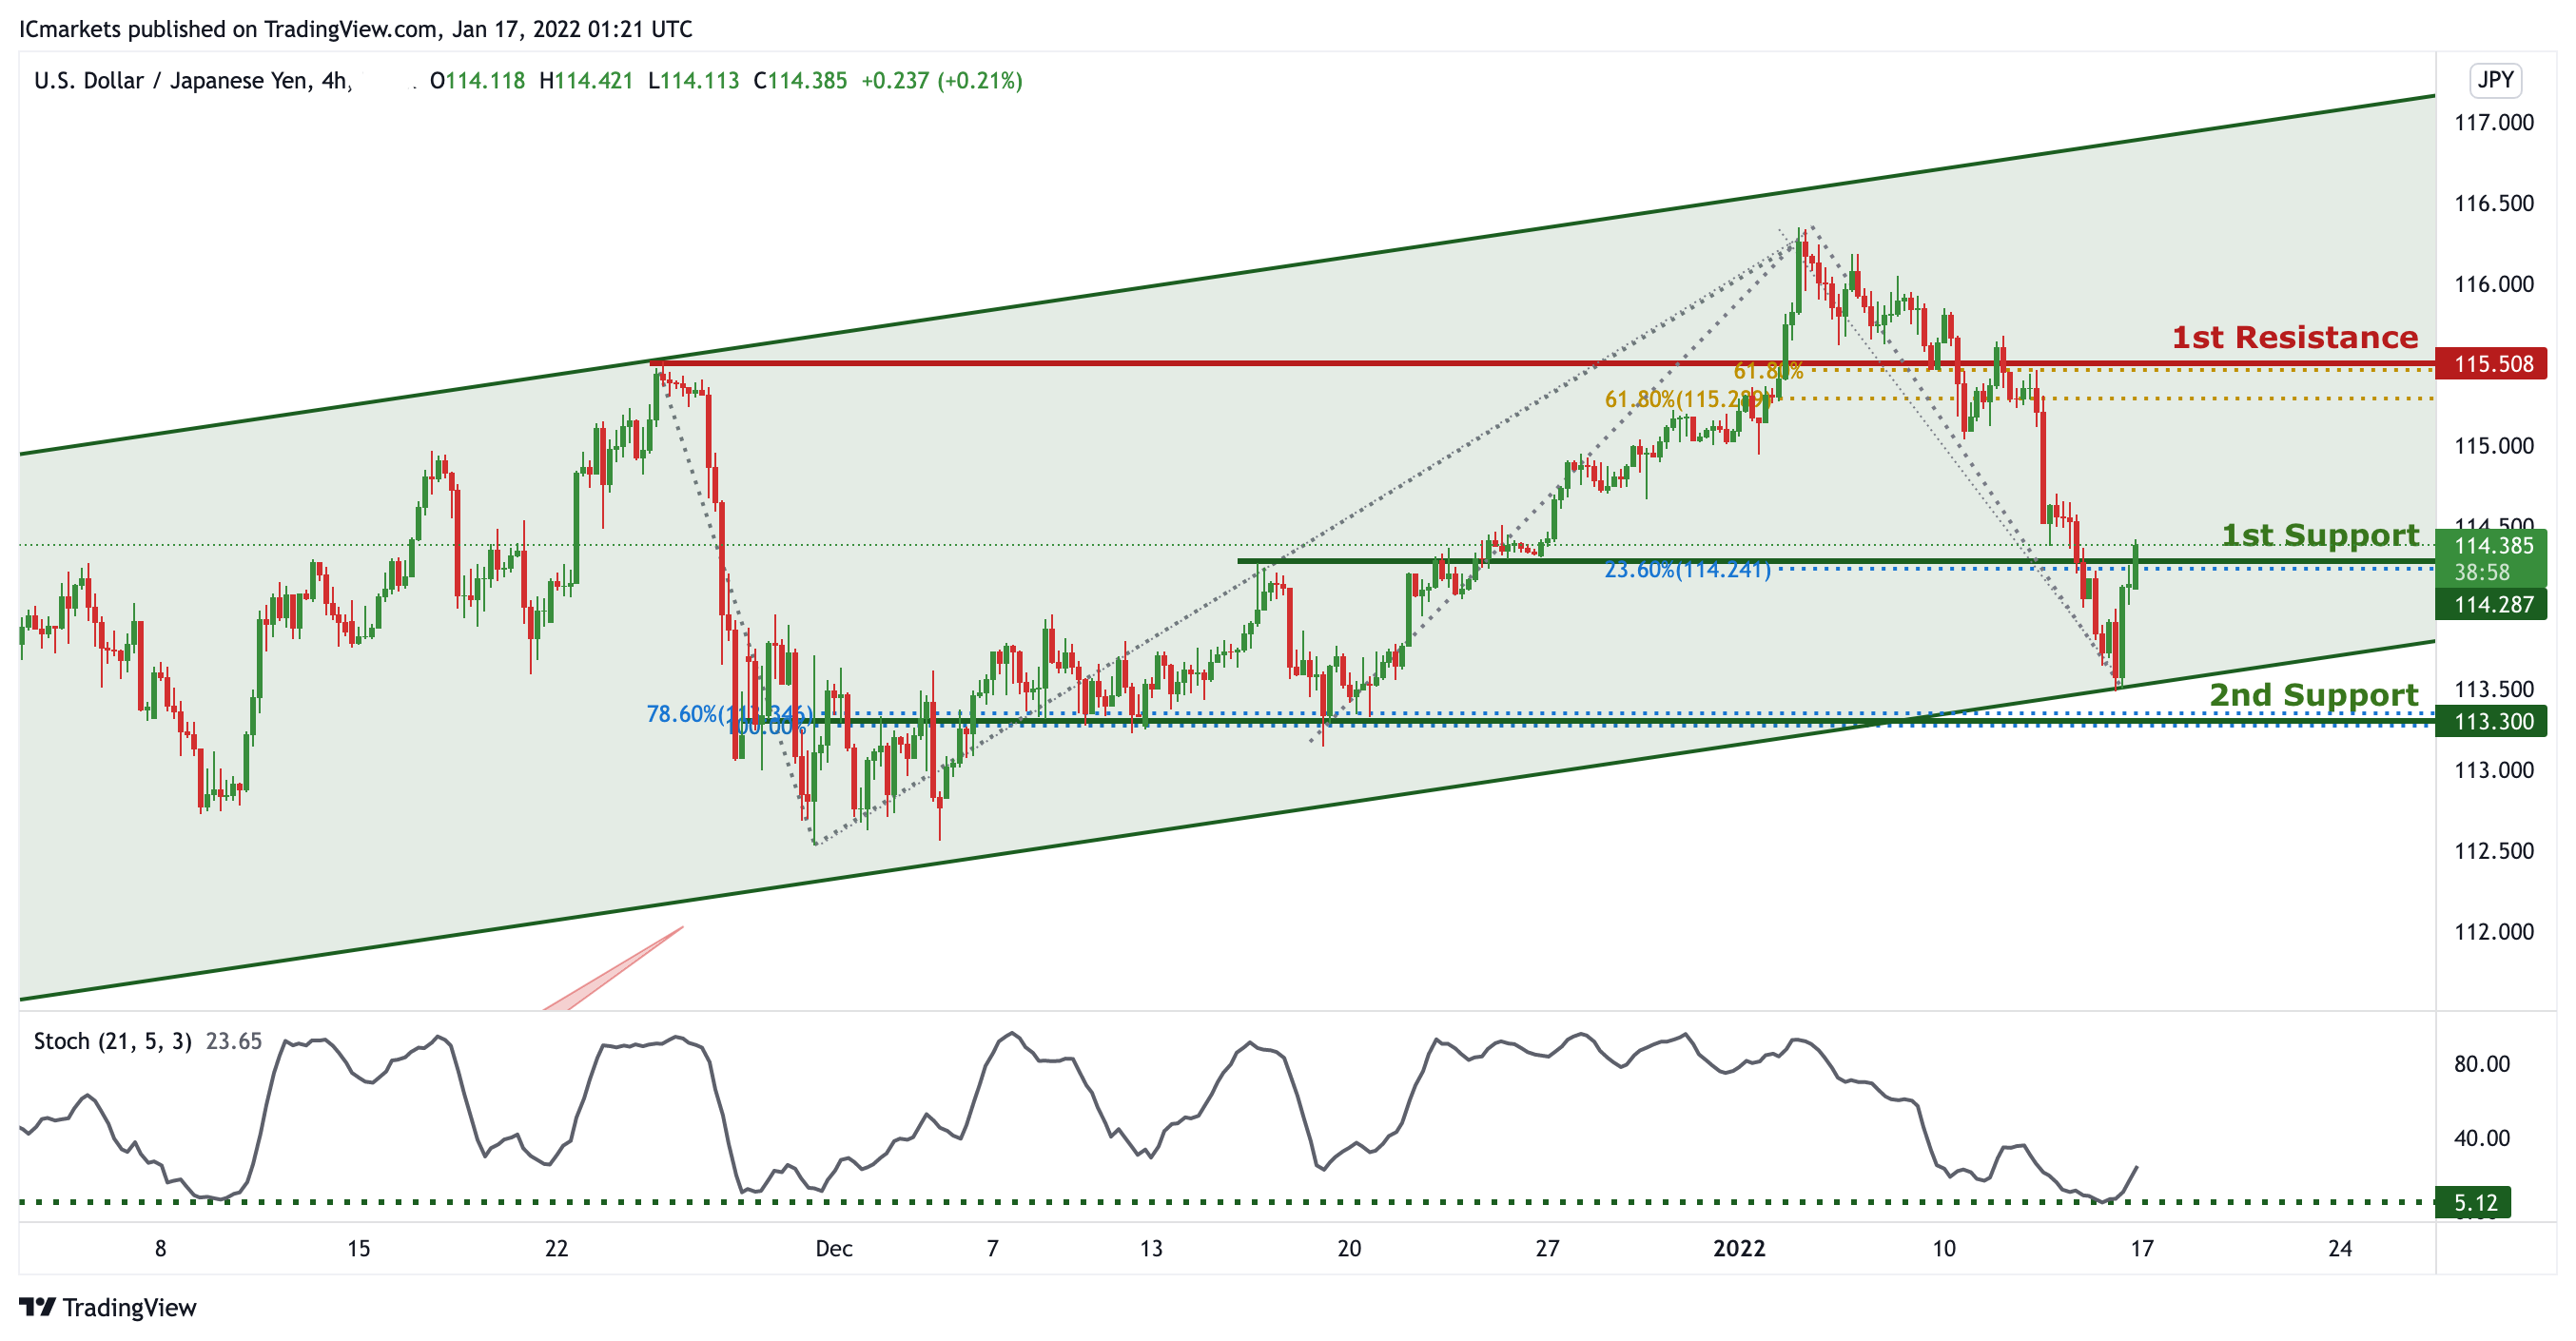
USD/JPY:
In reference to last week’s analysis, price indeed bounced at previous 1st Support. On the H4 timeframe, is abiding to the ascending channel on the daily, signifying an overall bullish momentum. We can now expect price to push higher from 1st Support in line with 23.6% Fibonacci retracement and graphical overlap support towards 1st Resistance in line with 61.8% Fibonacci projection and 61.8% Fibonacci retracement. Our bullish bias is further supported by the stochastic indicator where the %K line is at the support level.
Areas of consideration:
- H4 1st resistance level 115.508
- H4 1st support level 114.287
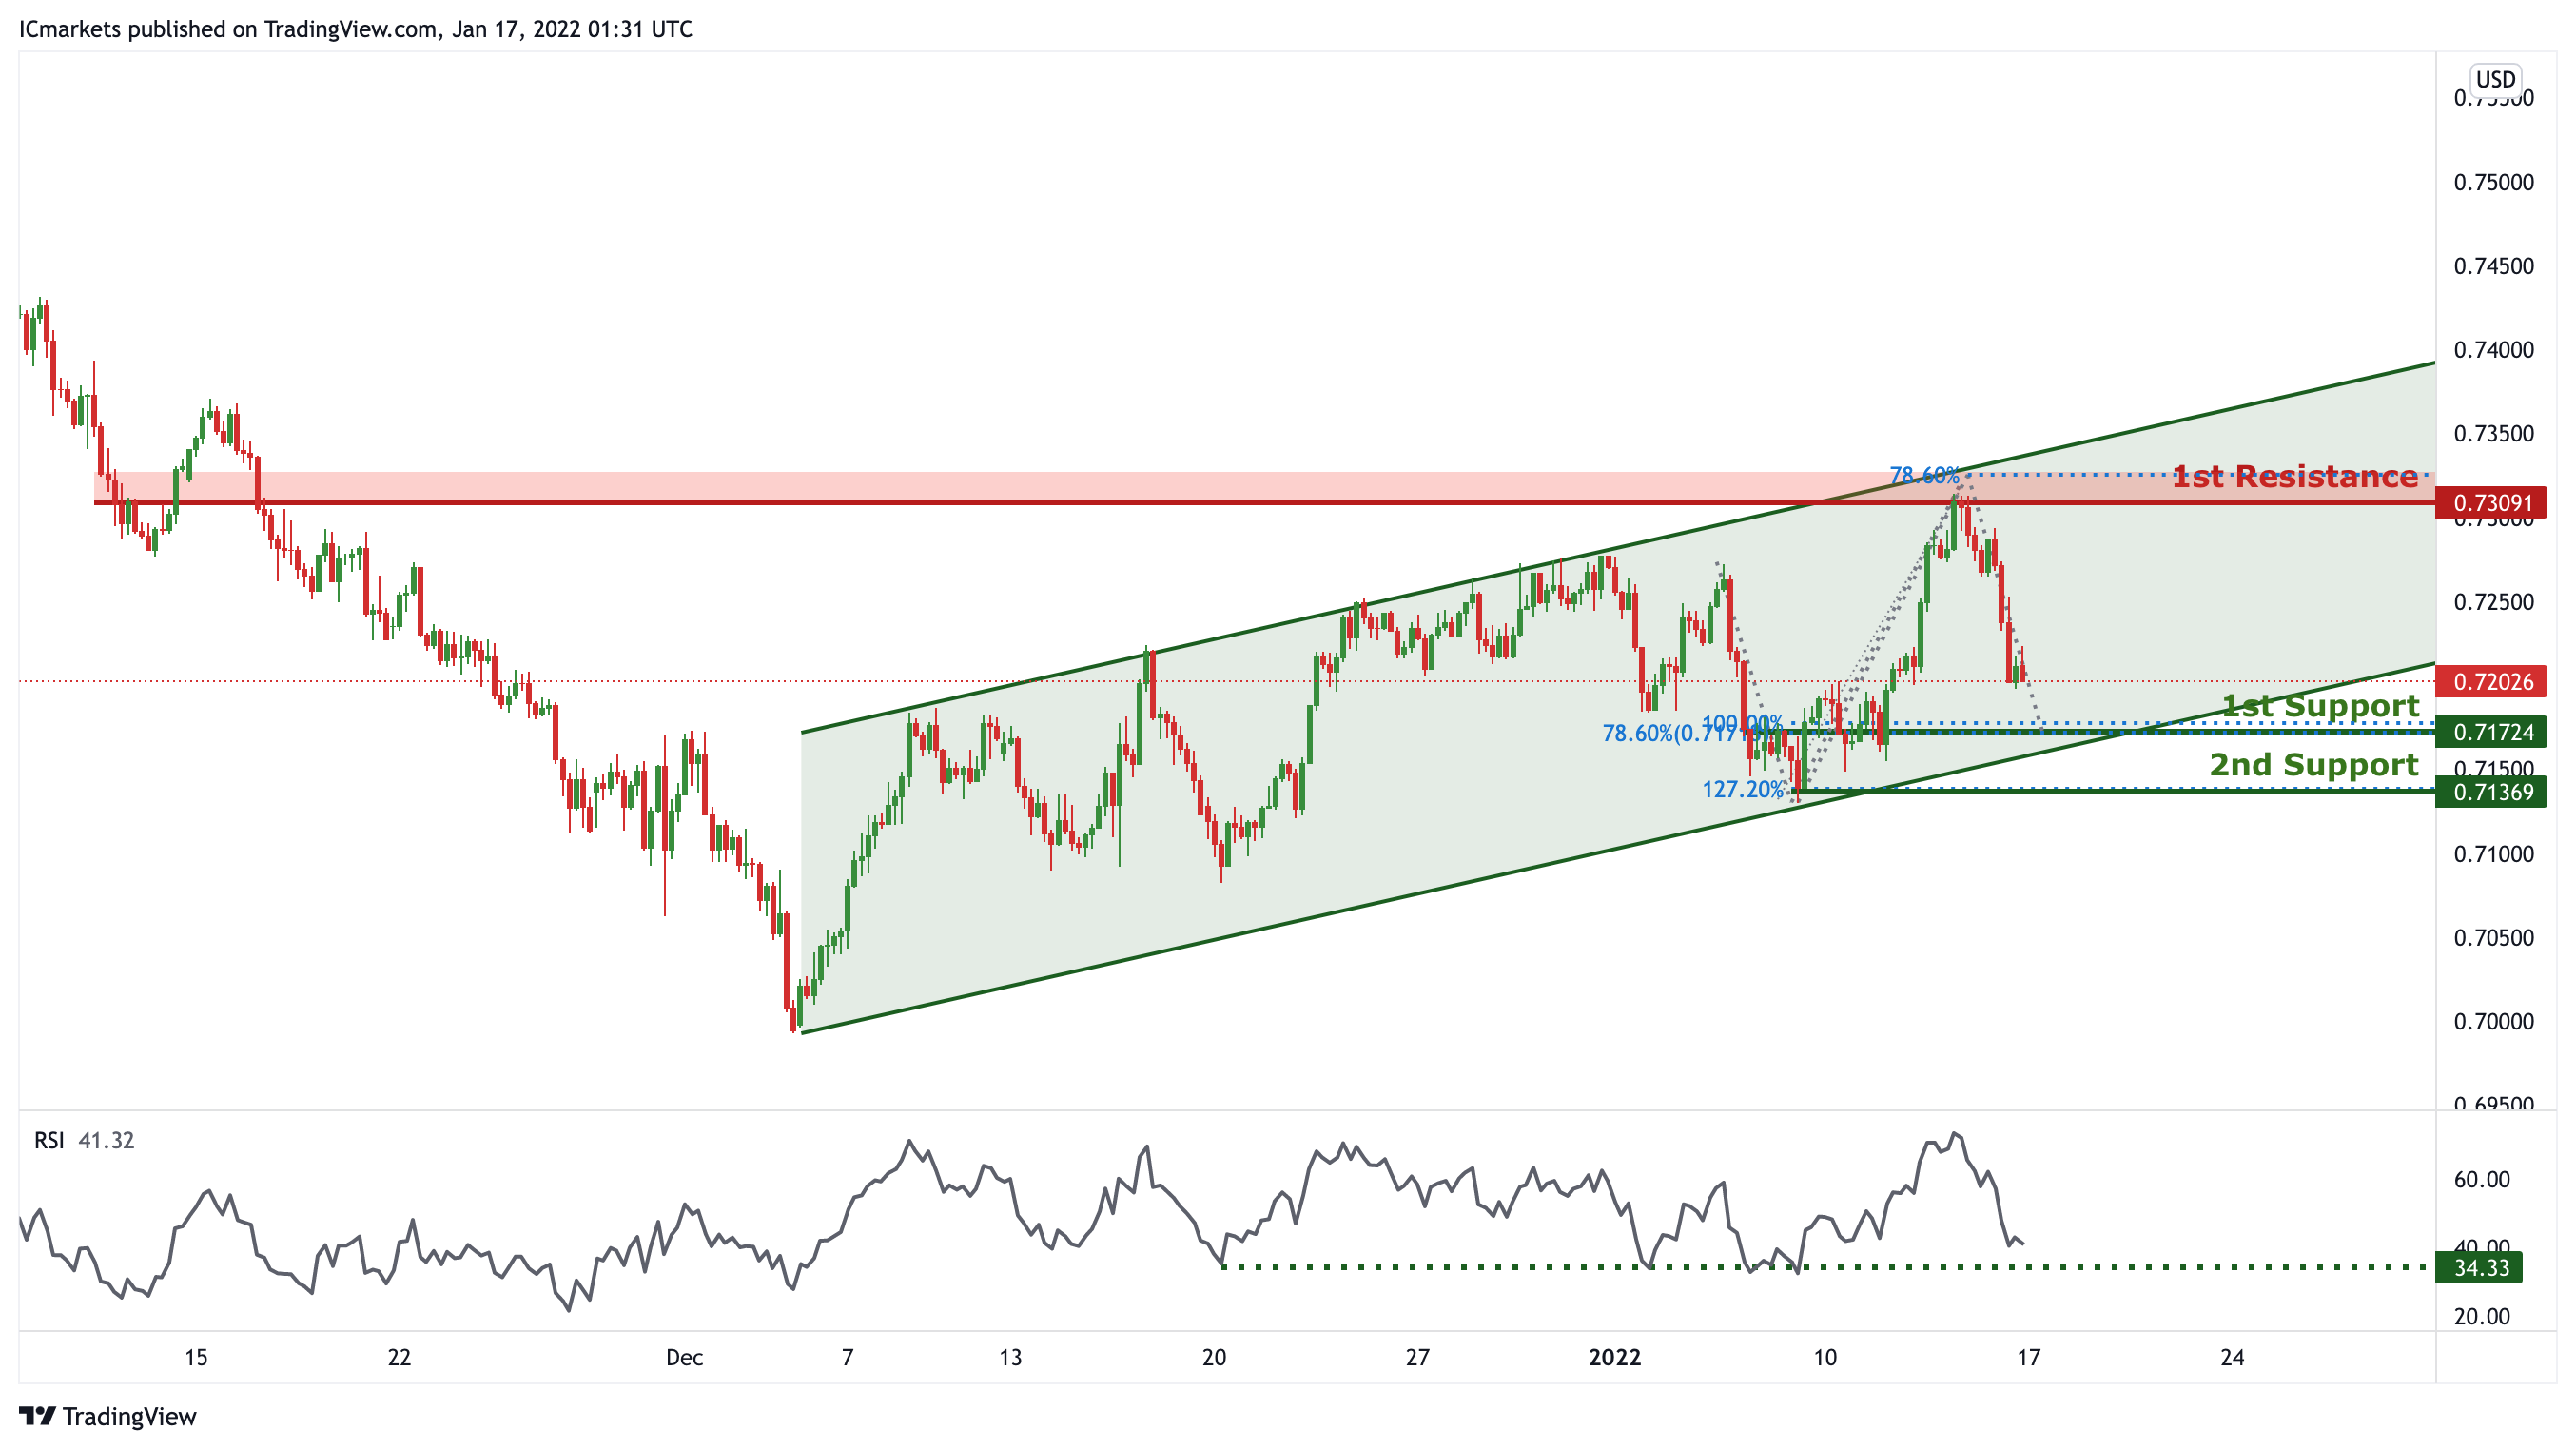
AUD/USD:
In reference to last week’s analysis, price indeed dropped to 1st Support @ 0.72023. On the H4, price is reacting within the ascending channel, signifying an overall bullish momentum. Price is approaching the 1st Support, we can expect to see price make a bullish bounce from 1st Support in line with 100% Fibonacci projection, 78.6% Fibonacci retracement and ascending channel support towards 1st Resistance in line with previous swing high and 78.6% Fibonacci projection. Our short-term bearish bias is further supported by the RSI indicator where it is approaching the support level.
Areas of consideration:
- H4 1st Support level 0.71724
- H4 1st resistance level 0.73091
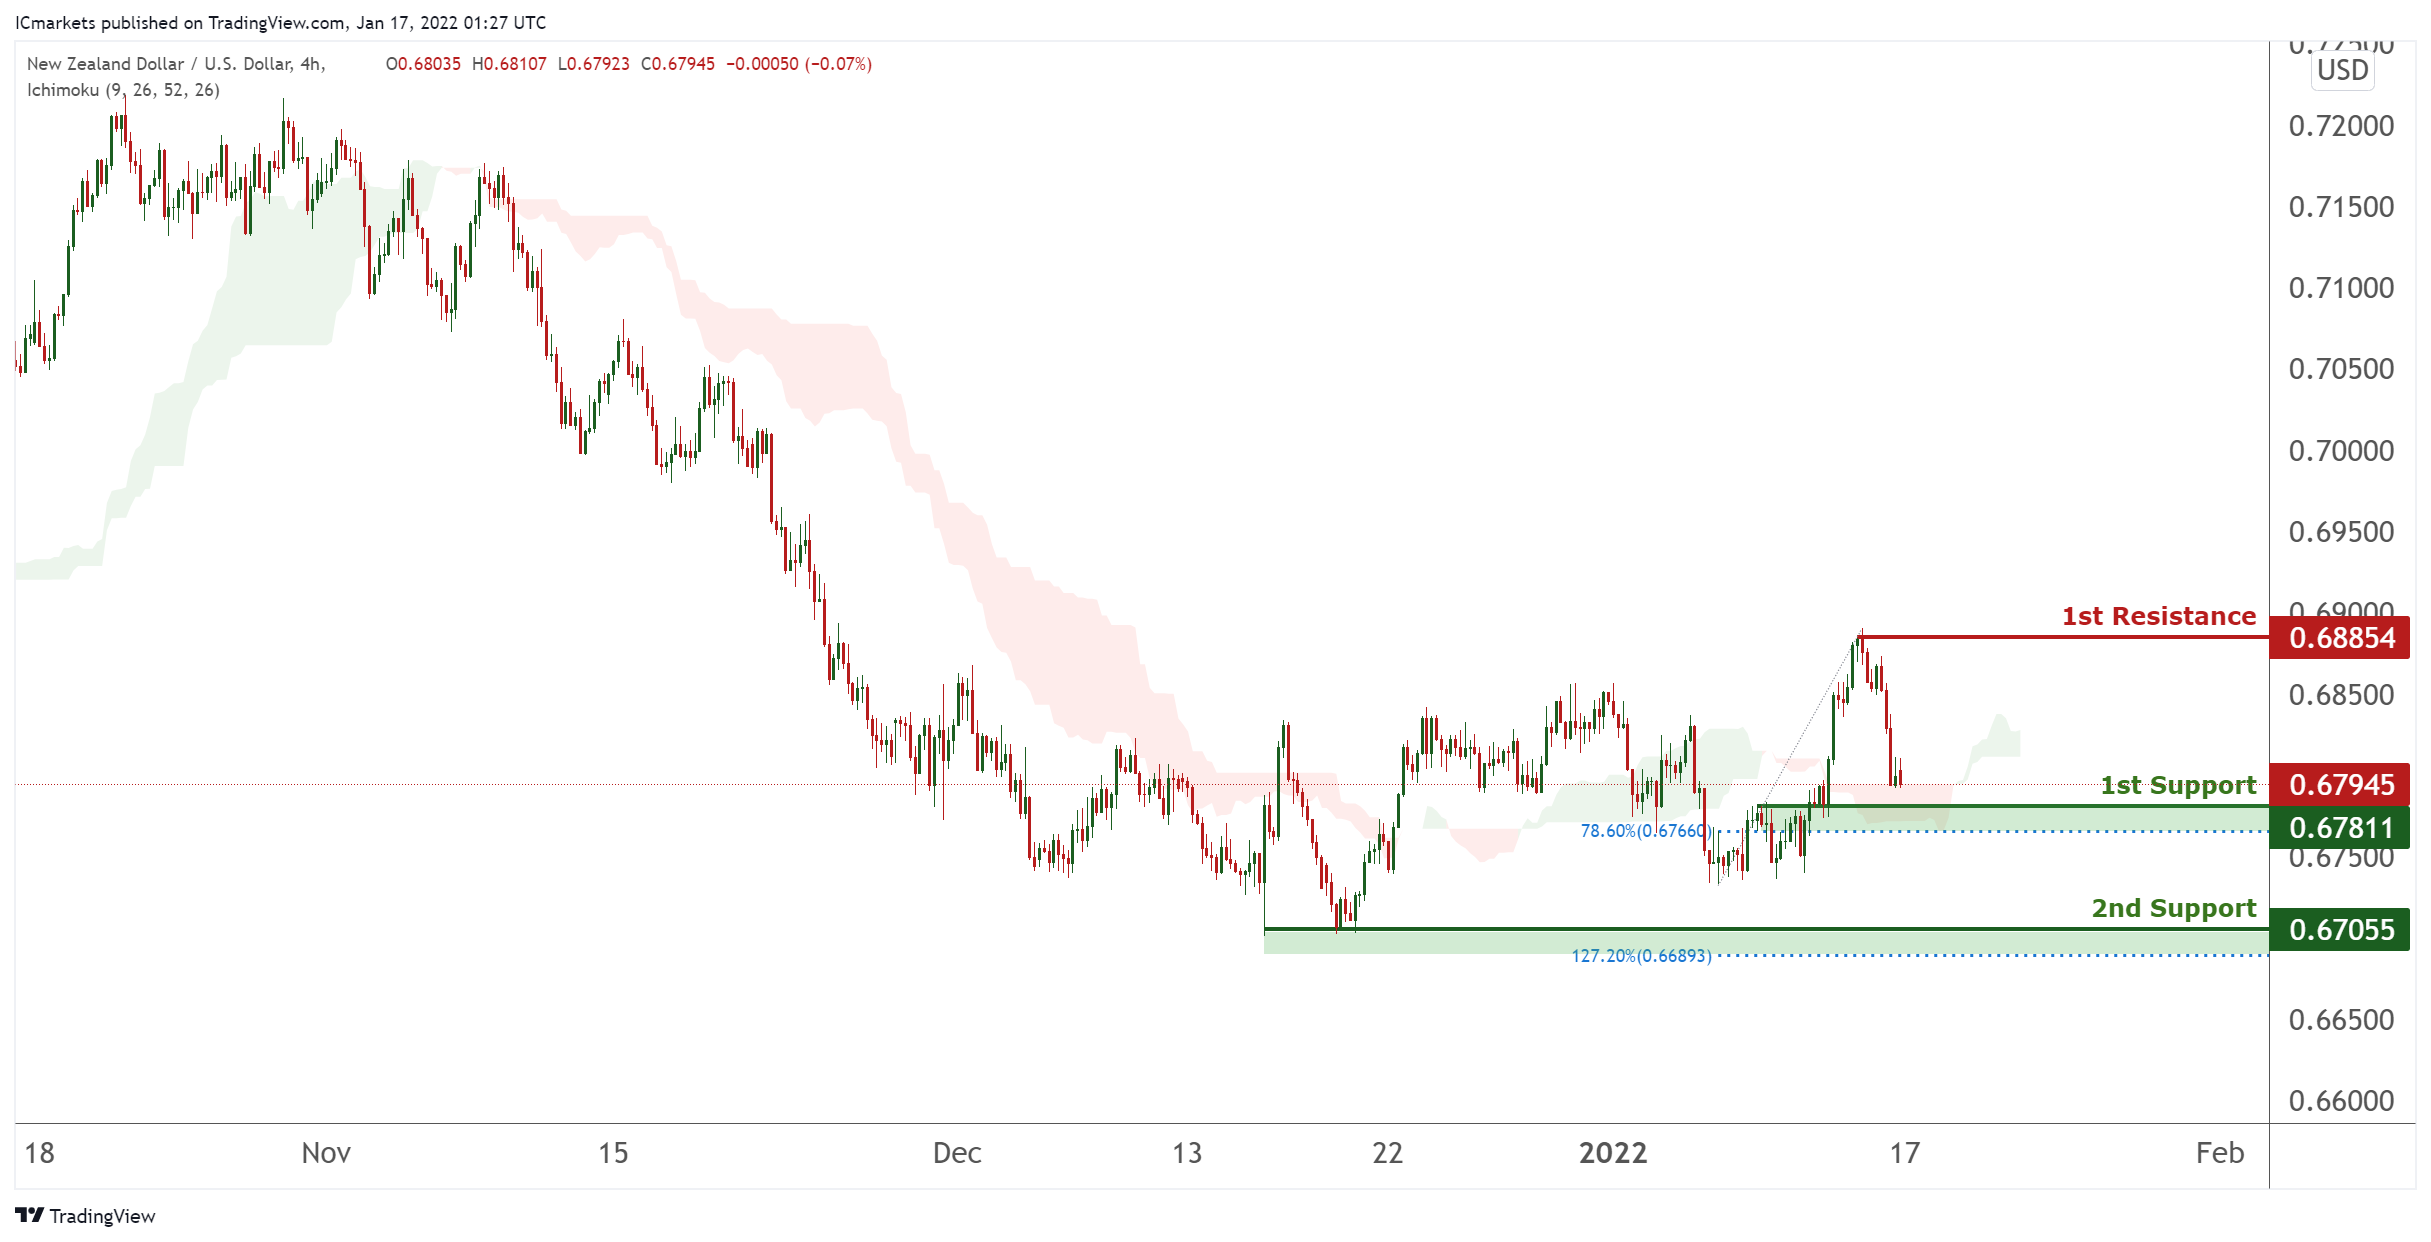
NZD/USD:
On the H4, with price moving above the ichimoku cloud, we have a bullish bias that price will rise to our 1st resistance at 0.68854 which is in line with horizontal swing high resistance from 1st support at 0.67811, which is in line with horizontal overlap support and 78.6% Fibonacci retracement level. Alternatively, price may break 1st support structure and head for 2nd support at 0.67055, which coincides with horizontal swing low support and 127.2% Fibonacci extension level .
Aras of consideration:
- H4 time frame, 1st resistance at 0.68854
- H4 time frame, 1st support at 0.67811
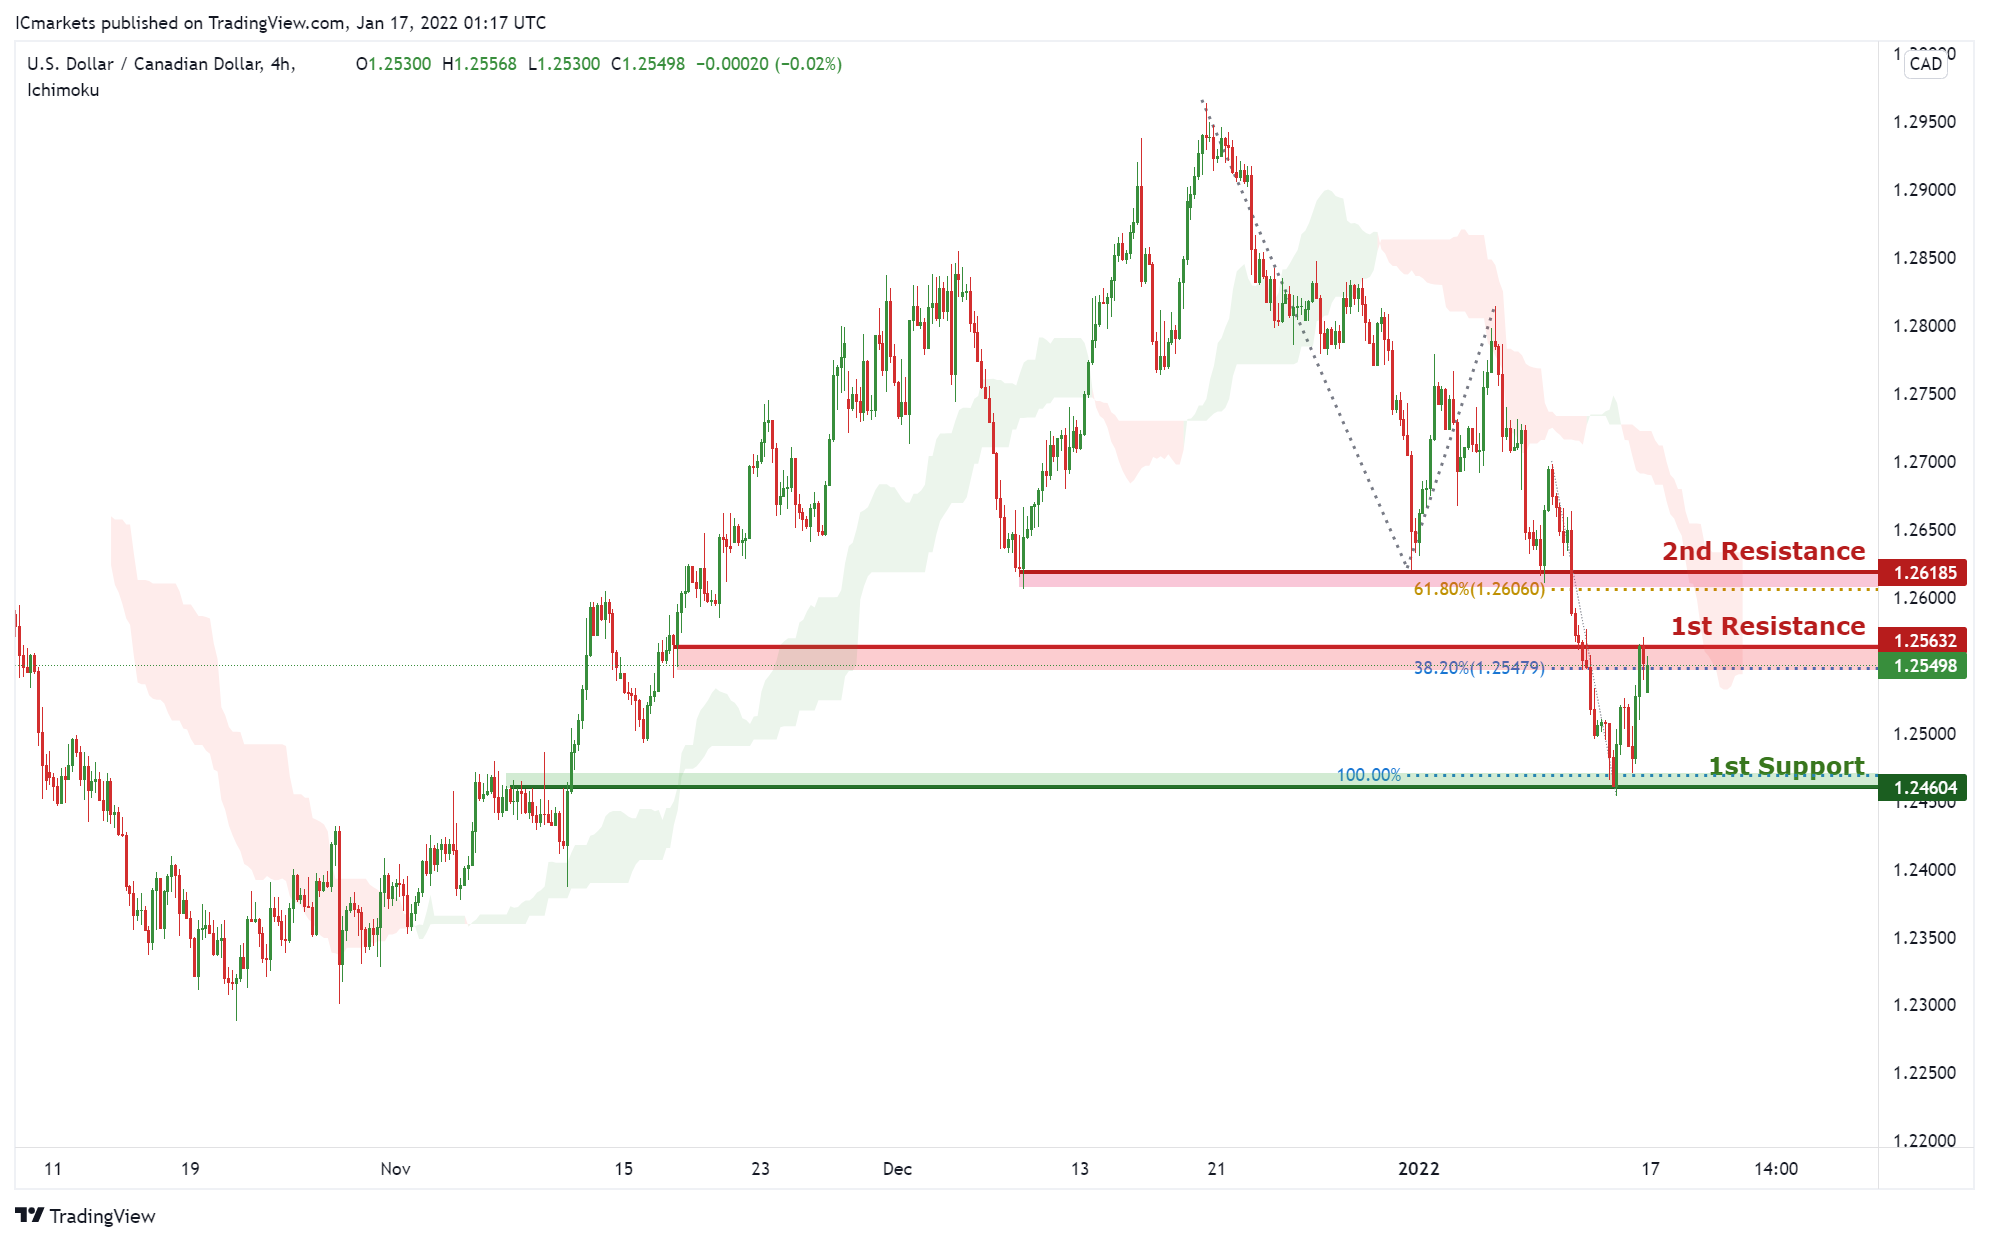
USD/CAD:
On the H4, with price moving below the ichimoku cloud, we have a bearish bias that price will from from our 1st resistance at 1.25632 which is in line with horizontal overlap resistance and 38.2% Fibonacci retracement to 1st support at 1.24604, which is in line with horizontal overlap support and 100% Fibonacci projection level. Alternatively, price may break 1st resistance structure and head for 2nd resistance at 1.26185, which coincides with horizontal overlap resistance and 61.8% Fibonacci retracement.
Areas of consideration:
- H4 time frame, 1st support at 1.24604
- H4 time frame, 1st resistance at 1.25479
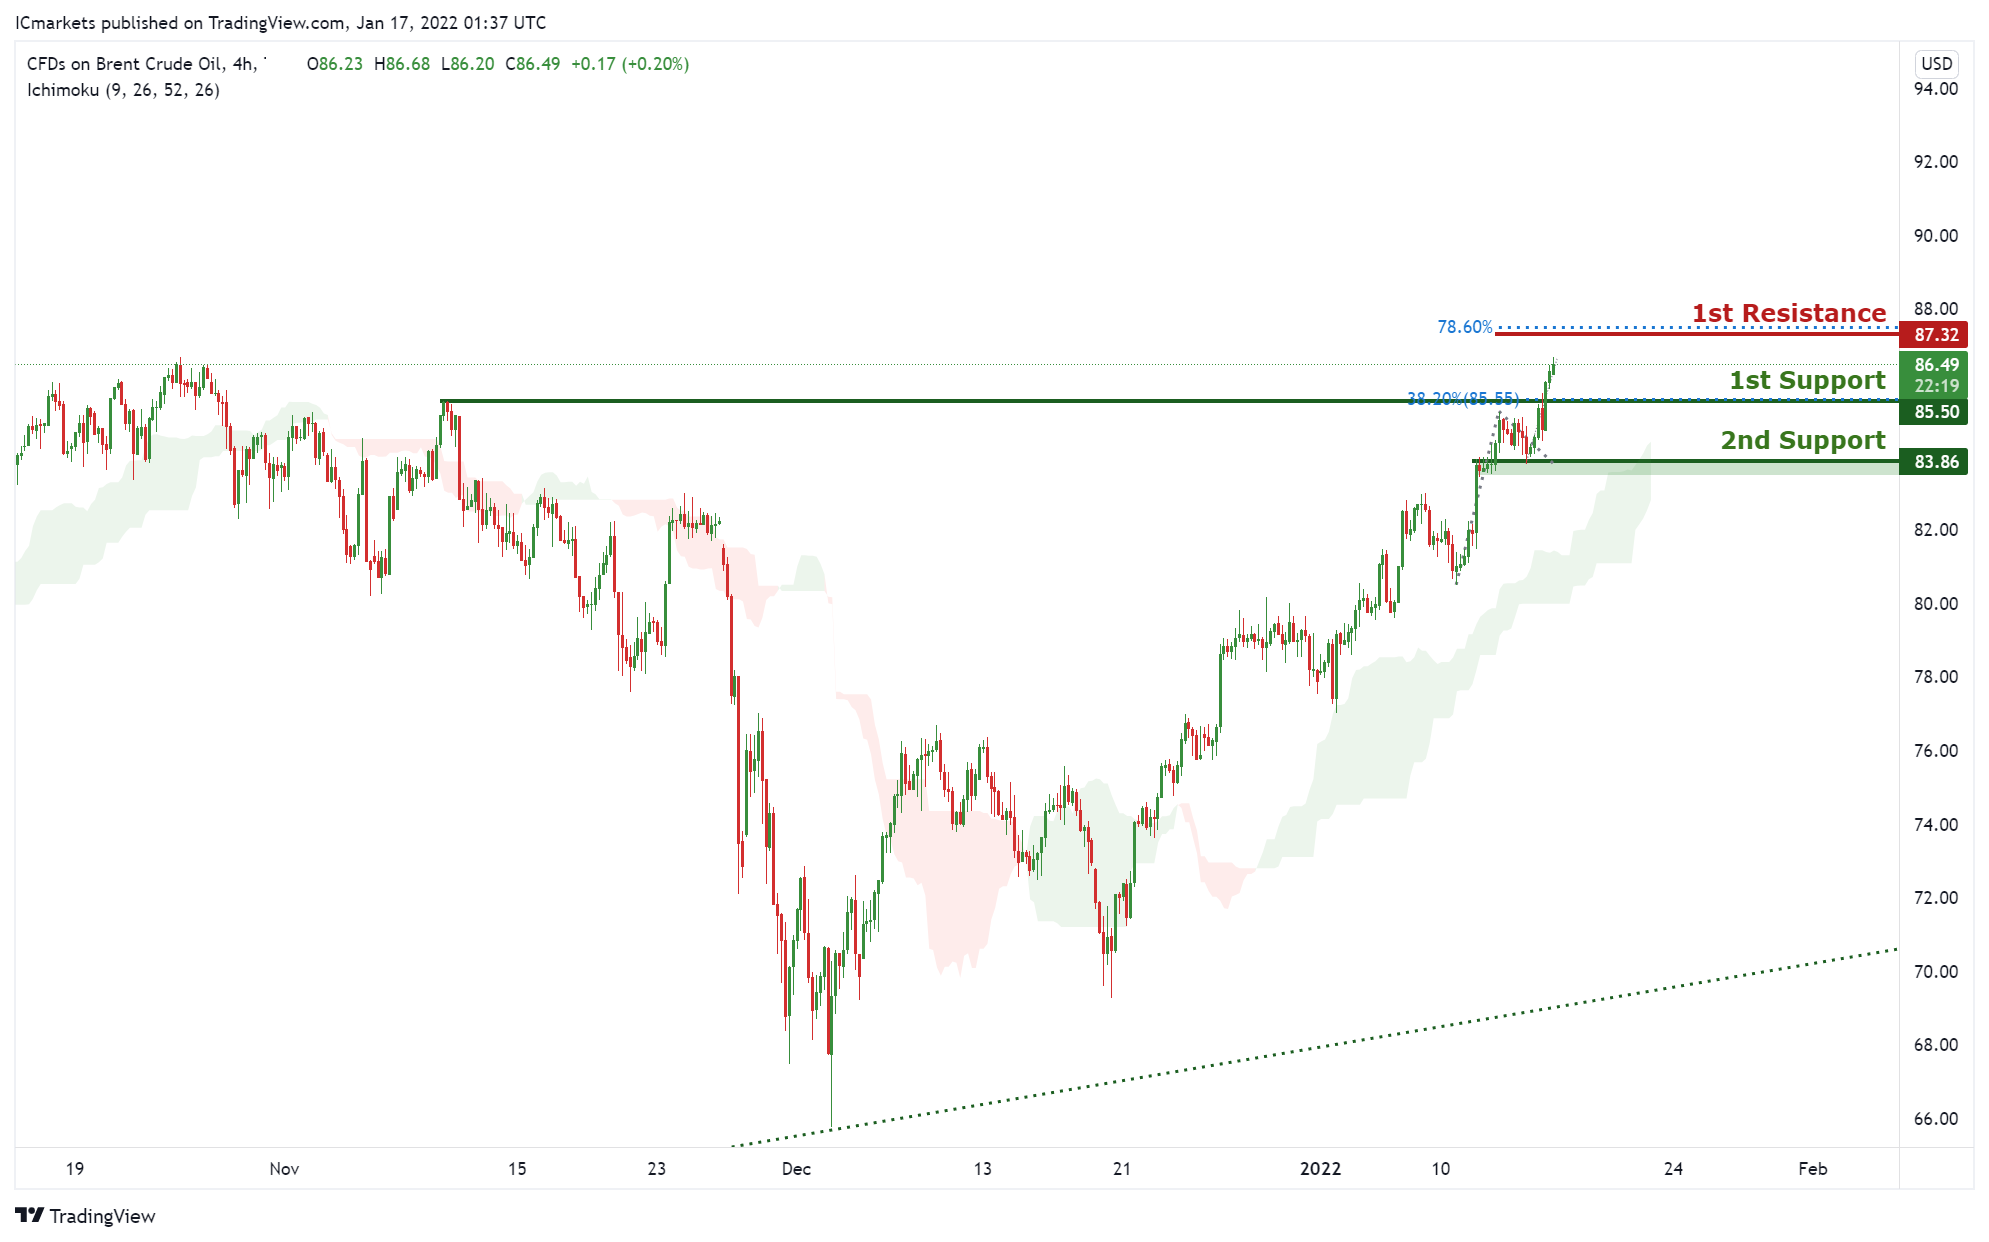
OIL:
On the H4, with price moving above the ichimoku cloud, we have a bullish bias that price will rise to our 1st resistance at 87.32 which is in line with horizontal swing high resistance and 78.6% Fibonacci projection level from 1st support at 85.5, which is in line with horizontal overlap support and 38.2% Fibonacci retracement level. Alternatively, price may break 1st support structure and head for 2nd support at 83.86, which coincides with horizontal overlap support.
Areas of consideration:
- H4 time frame, 1st resistance of 87.32
- H4 time frame, 1st support of 85.5
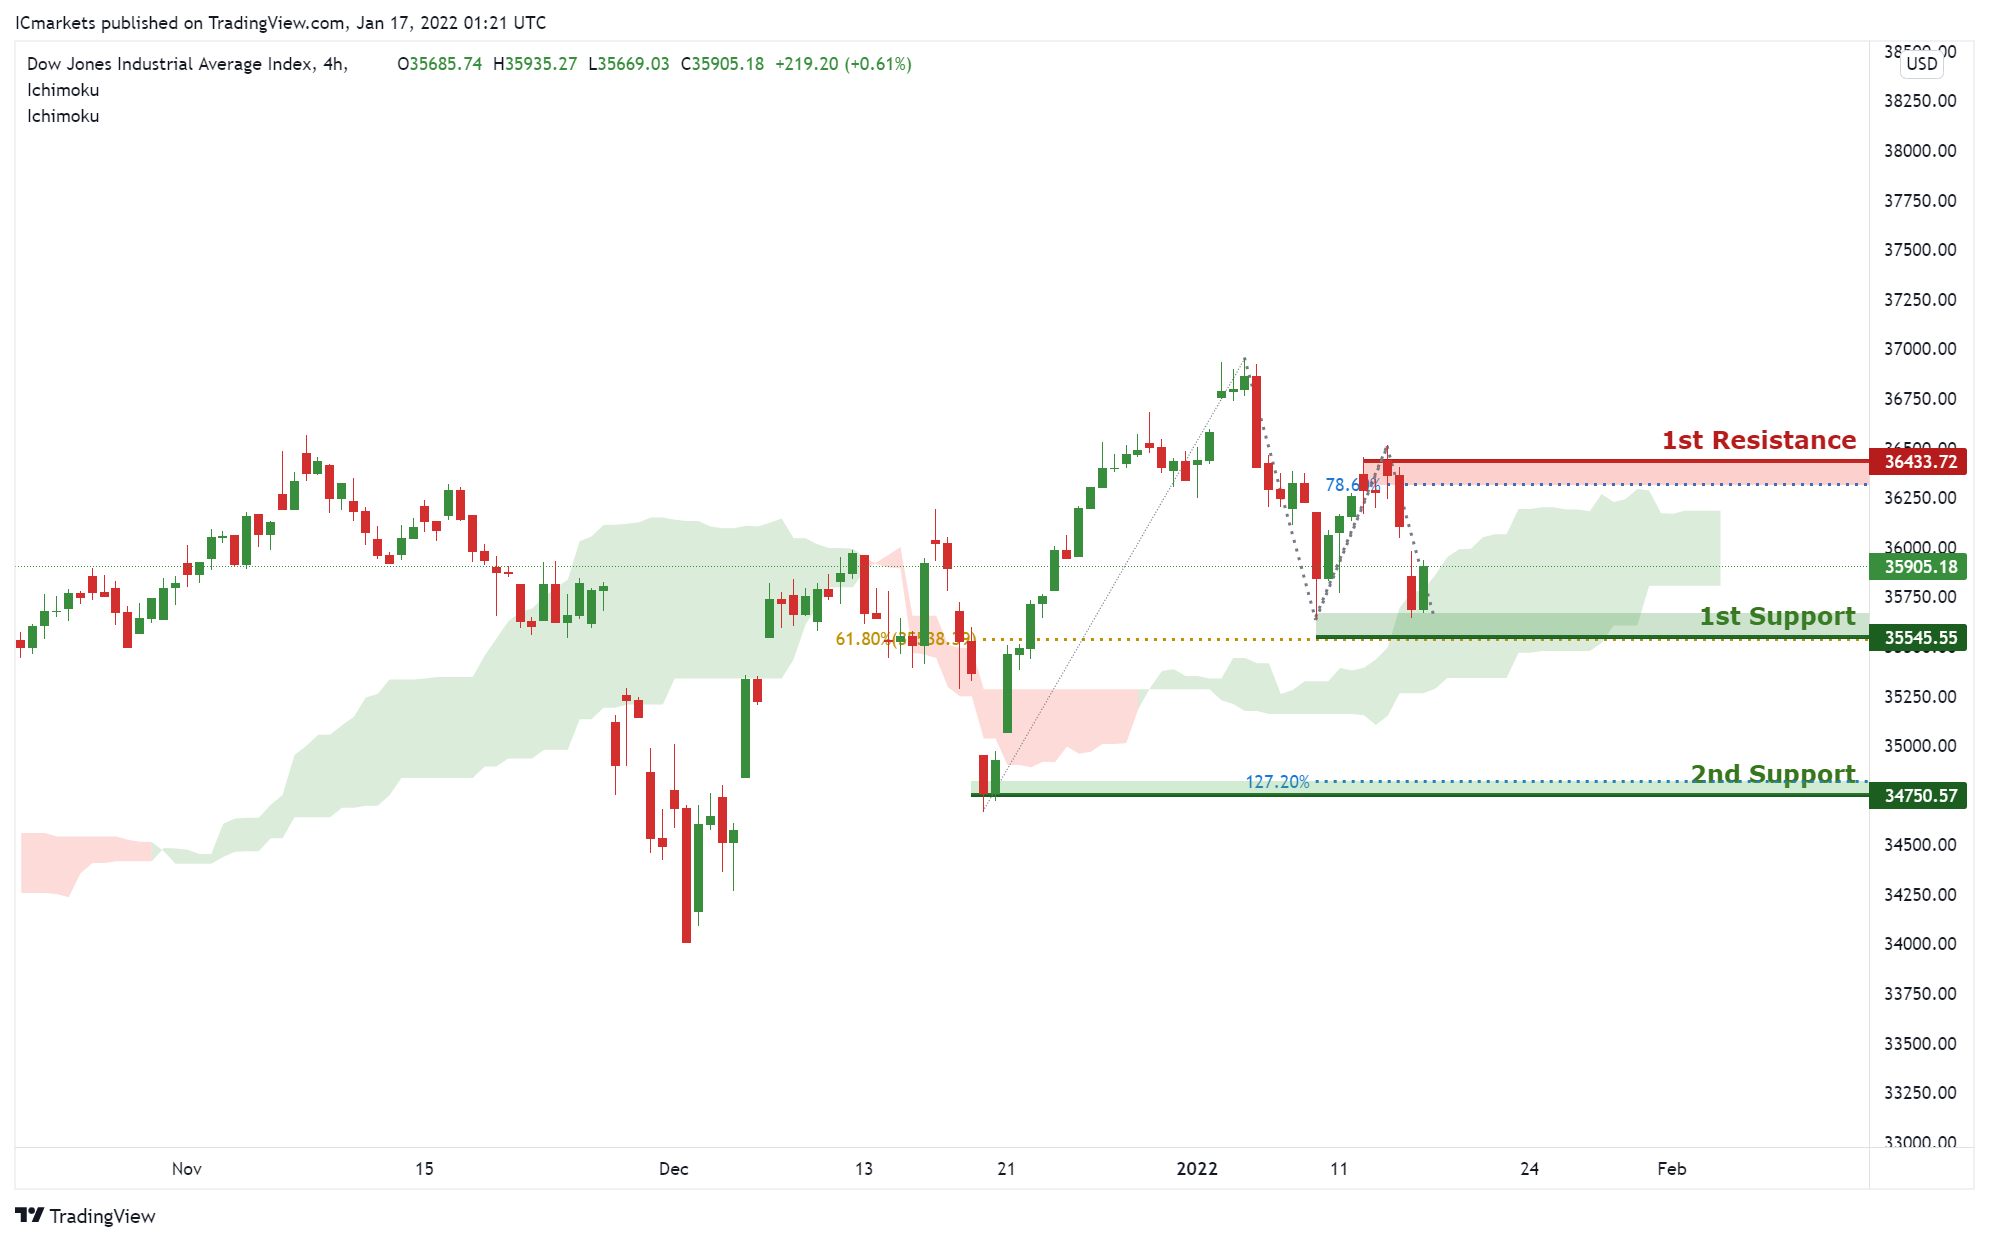
Dow Jones Industrial Average:
On the H4, with price moving above the ichimoku cloud, we have a bullish bias that price will rise to our 1st resistance at 36433 which is in line with horizontal swing high resistance and 78.6% Fibonacci retracement level from 1st support at 35545, which is in line with horizontal swing low support and 61.8% Fibonacci retracement level. Alternatively, price may break 1st support structure and head for 2nd support at 34750, which coincides with horizontal swing low support and 127.2% Fibonacci extension level.
Areas of consideration:
- H4 time frame, 1st resistance of 36433
- H4 time frame, 1st support of 35545


