

Live Comments
US Retail Sales Slump -0.6% M/M in July as Consumer Momentum Fades
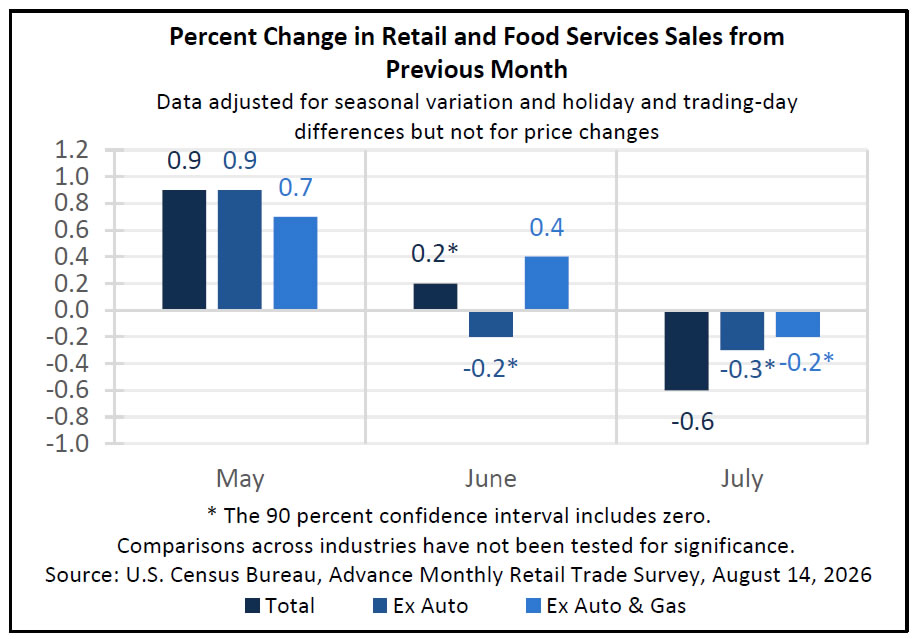
US retail sales weakened sharply in July, adding to evidence that domestic demand lost momentum at start of Q3. Headline sales slowed from 0.2% to -0.6% m/m, well below expectations for 0.2% growth. Sales excluding autos deteriorated from -0.2% to -0.3%, also missing 0.2% forecast. Even excluding both autos and gasoline, sales fell -0.2%, suggesting weakness extended beyond volatile categories. Retail sales excluding food services were softer still at -0.8%.
Monthly weakness contrasts with still-solid annual growth. Total retail and food-services sales were 5.0% higher y/y, while sales over May-July were 6.3% above same period a year earlier. Ex-auto sales rose 5.8% y/y and ex-auto-and-gasoline sales increased 4.8%. That argues against describing July as a collapse in consumption, but it does point to a clear loss of near-term momentum after May’s strong gains and modest June growth.
For Fed, July retail sales reinforce case for keeping rates unchanged in September. Weak payrolls already raised concern over labor market, while this week’s CPI and PPI reduced urgency to tighten again. Softer consumer spending now adds evidence that higher rates are restraining demand. One month is not enough to establish a sustained downturn, but another weak August reading would strengthen argument that Fed should remain patient rather than revive tightening.
Data Summary
| Indicator | Actual | Expected | Previous |
|---|---|---|---|
| Retail Sales m/m | -0.6% | 0.2% | 0.2% |
| Retail Sales ex Autos m/m | -0.3% | 0.2% | -0.2% |
| Retail Sales ex Autos & Gas m/m | -0.2% | — | 0.4% |
| Retail Sales ex Gasoline m/m | -0.6% | — | 0.8% |
| Retail Sales ex Food Services m/m | -0.8% | — | 0.2% |
Key Takeaways
- US retail sales swung from 0.2% growth to -0.6% m/m in July, sharply missing expectations for another 0.2% increase.
- Weakness extended beyond autos. Sales excluding autos deteriorated from -0.2% to -0.3%, while sales excluding both autos and gasoline fell 0.2%.
- Retail sales excluding food services dropped 0.8% m/m, reinforcing evidence of broad monthly softness.
- Annual spending remains much firmer, with total retail and food-services sales 5.0% higher y/y and May–July sales up 6.3% from same period in 2025.
- Data therefore point to loss of near-term consumer momentum rather than outright collapse in spending.
- Retail sales are nominal and not adjusted for price changes, so strong annual growth does not necessarily imply equally strong real consumption.
- Combined with weak July payrolls and benign CPI/PPI, report further strengthens September Fed hold case.
Europe’s June 14.4% YoY Export Rebound Masks Sharp First-Half Trade Deterioration
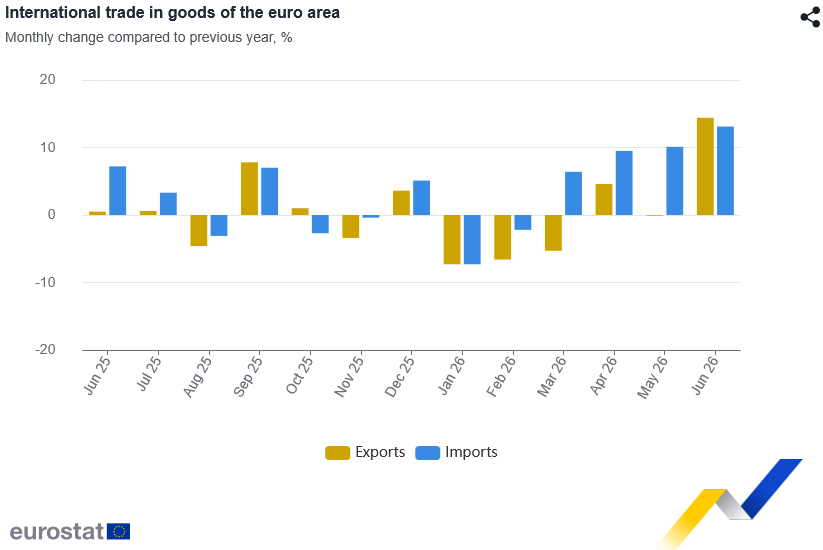
Eurozone goods trade surplus widened from EUR 4.8B last year to EUR 8.6B in June, as exports rose 14.4% y/y to EUR 272.5B and imports increased 13.1% y/y to EUR 264.0B. EU trade surplus, however, narrowed from EUR 5.2B to EUR 3.9B, with exports up 12.5% and imports rising a slightly faster 13.5%. June figures therefore point to a strong rebound in cross-border trade, but not a uniformly stronger external position across region.
First-half data paint a much weaker picture. Eurozone exports slipped -0.2% y/y in January-June while imports rose 4.9%, shrinking cumulative surplus from EUR 82.2B to EUR 9.8B. For EU, extra-regional exports fell -2.1% while imports increased 4.7%, swinging balance from a EUR 74.1B surplus to EUR 14.9B deficit. Intra-regional trade was firmer, rising 4.7% in Eurozone and 5.7% across EU.
Partner breakdown also remained mixed. EU kept sizeable surpluses with US, UK and Switzerland, while deficit with China widened from EUR 31.0B to EUR 35.1B in June. Overall, June rebound is encouraging, but it does not erase deterioration seen over first half. Stronger exports are beginning to help, yet Europe still needs a more sustained improvement before trade can be described as a durable growth tailwind.
Data Summary
| Indicator | Jun 2026 | Jun 2025 | Change |
|---|---|---|---|
| Eurozone Extra-EA Exports | €272.5B | €238.2B | +14.4% |
| Eurozone Extra-EA Imports | €264.0B | €233.4B | +13.1% |
| Eurozone Trade Balance | €8.6B | €4.8B | widened |
| EU Extra-EU Exports | €241.5B | €214.7B | +12.5% |
| EU Extra-EU Imports | €237.7B | €209.5B | +13.5% |
| EU Trade Balance | €3.9B | €5.2B | narrowed |
| Jan–Jun | 2026 | 2025 | Change |
|---|---|---|---|
| Eurozone Extra-EA Exports | €1,487.2B | €1,490.1B | -0.2% |
| Eurozone Extra-EA Imports | €1,477.4B | €1,407.9B | +4.9% |
| Eurozone Trade Balance | €9.8B | €82.2B | Narrowed sharply |
| EU Extra-EU Exports | €1,317.0B | €1,345.9B | -2.1% |
| EU Extra-EU Imports | €1,331.9B | €1,271.8B | +4.7% |
| EU Trade Balance | -€14.9B | €74.1B | Swung to deficit |
Key Takeaways
- Eurozone goods surplus widened from €4.8B to €8.6B y/y in June, as exports rose 14.4%, faster than 13.1% import growth.
- EU surplus moved in opposite direction, narrowing from €5.2B to €3.9B, as imports grew slightly faster than exports.
- June strength contrasts sharply with first-half trend: Eurozone surplus collapsed from €82.2B to €9.8B.
- EU external balance deteriorated further, swinging from €74.1B surplus to €14.9B deficit over January-June.
- EU continued to run sizable surpluses with US, UK and Switzerland, while deficit with China widened from €31.0B to €35.1B in June.
- Overall picture is improvement at margin rather than a completed trade recovery; June exports rebounded strongly, but first-half balances remain substantially weaker.
Swiss GDP Surges 1.5% in Q2 as Industry Drives Growth
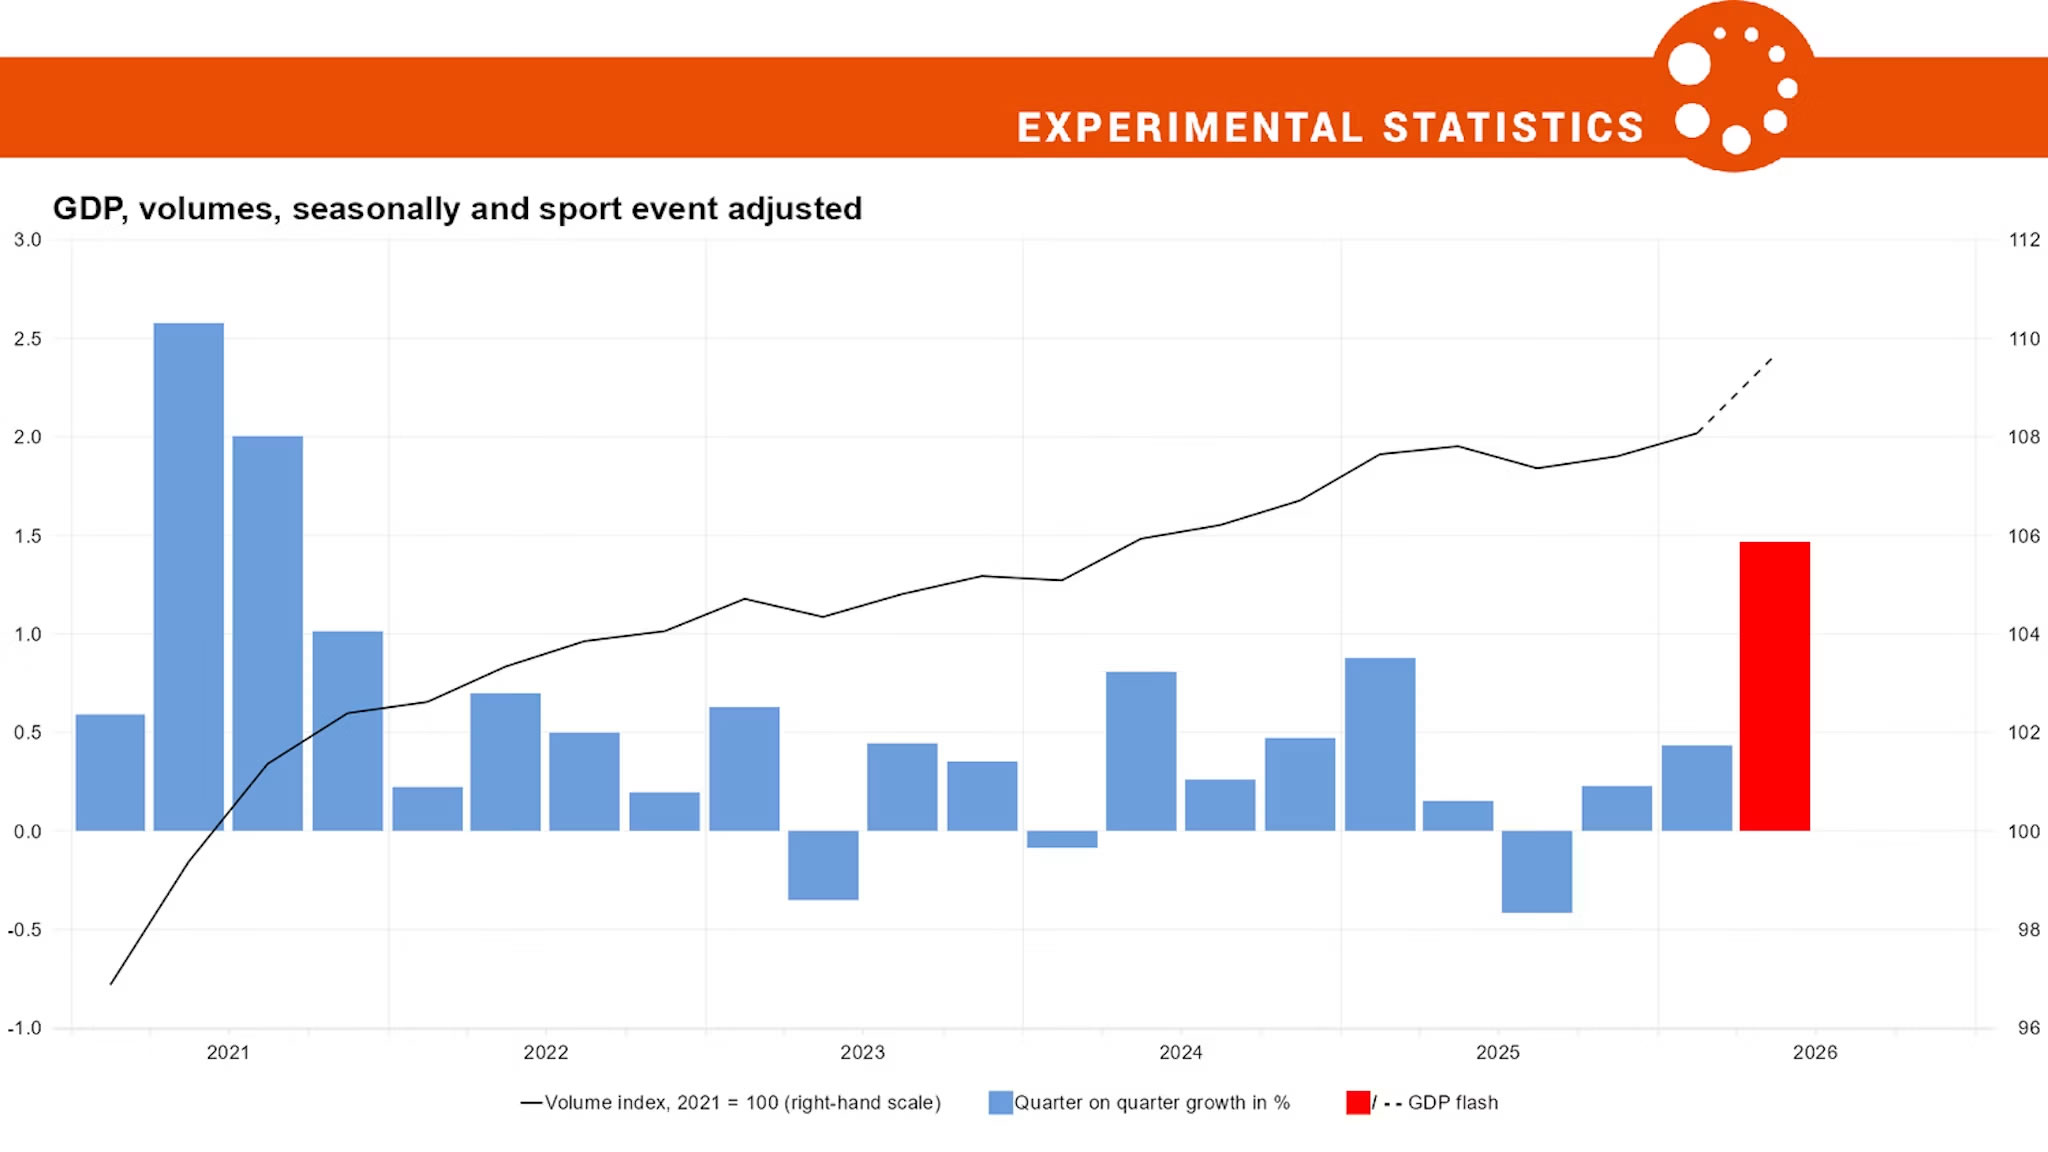
Swiss economy accelerated sharply in Q2, with sport-event-adjusted real GDP growth rising from 0.4% to an estimated 1.5% q/q, according to SECO’s flash estimate. That would mark strongest quarterly expansion since 2021 based on current series. SECO said industrial sector made largest contribution to growth, driven particularly by chemicals and pharmaceuticals, while services also expanded overall.
Strength extends rebound already visible in Q1, when manufacturing grew 1.5% q/q after contracting 3.0% in Q4. But Q2 flash provides no detailed sector breakdown beyond SECO’s broad assessment, so it is too early to judge how widely expansion spread beyond chemicals and pharmaceuticals. Flash estimate is also based partly on estimated inputs and may be revised when full quarterly GDP data are released.
Still, headline result points to considerably stronger Swiss growth momentum than previously evident. A 1.5% quarterly expansion led by industry reduces concern that economy is being materially constrained by current financial conditions and gives SNB less reason to respond to growth weakness. Key question for final release will be whether exceptional industrial contribution was accompanied by broad gains elsewhere or whether Q2 strength was concentrated in a narrow group of export-heavy sectors.
Key Takeaways
- Swiss sport-event-adjusted GDP growth accelerated from 0.4% to an estimated 1.5% q/q in Q2, potentially strongest quarterly expansion since 2021.
- Industry made largest contribution, led especially by chemicals and pharmaceuticals, while services also expanded.
- Q2 strength builds on manufacturing rebound already seen in Q1, when output rose 1.5% after a 3.0% contraction in Q4.
- Flash estimate is based on incomplete early data and may be revised, while detailed sector breakdown is not yet available.
- Headline result points to a much stronger Swiss growth backdrop, reducing concern that economy is being materially constrained by current financial conditions.
- For SNB, stronger growth lowers urgency to respond to economic weakness, though final policy implications depend on whether expansion proves broad based rather than concentrated in pharma-led industry.