USDCAD Outlook
USD/CAD Daily Outlook
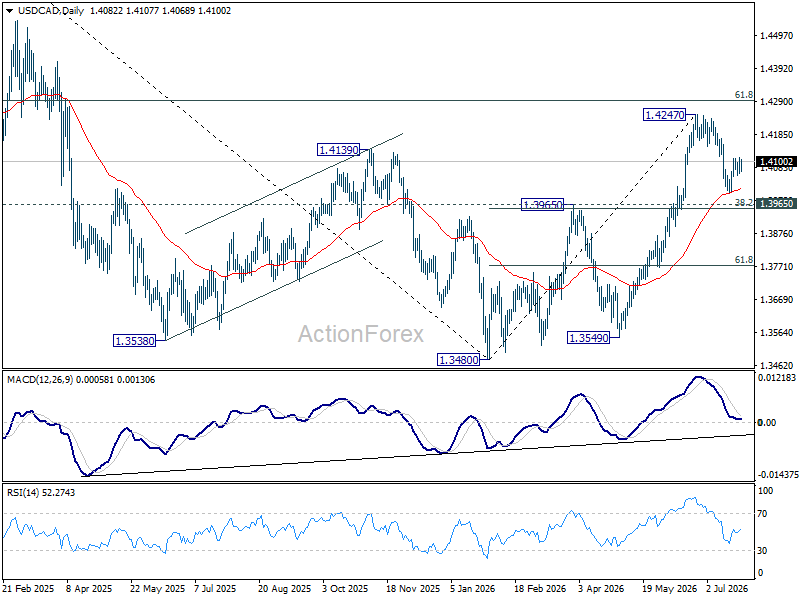
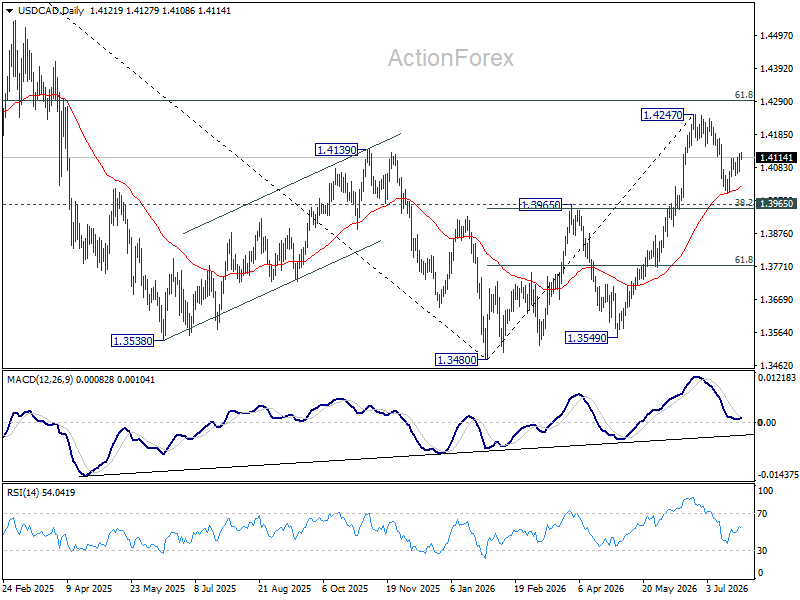
Intraday bias in USD/CAD is turned neutral again with current retreat. It's still slightly favored that corrective pullback from 1.4247 has completed at 1.4002. Above 1.4127 will bring stronger rebound to retest 1.4247 high. On the downside, though, below 1.4055 will extend the correction with another fall. But in that case, downside should be contained by 1.3965 cluster support (38.2% retracement of 1.3480 to 1.4247 at 1.3954) to bring rebound.
In the bigger picture, current development suggests that fall from 1.4791 has completed as a three wave correction to 1.3480. It's still early to judge if rise from there a corrective bounce, or resumption of the larger up trend from 1.2005 (2021 low). But in either case, retest of 1.4791 high should be seen next.
USD/CAD Daily Outlook
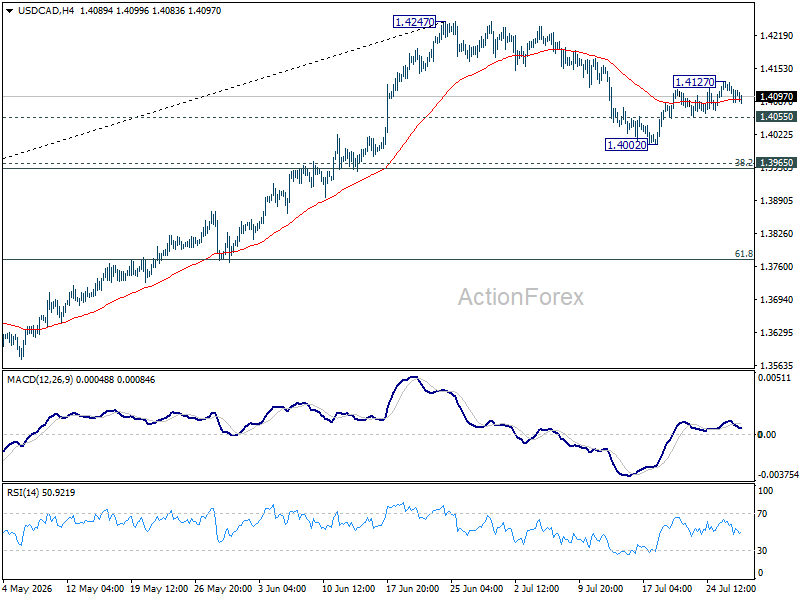
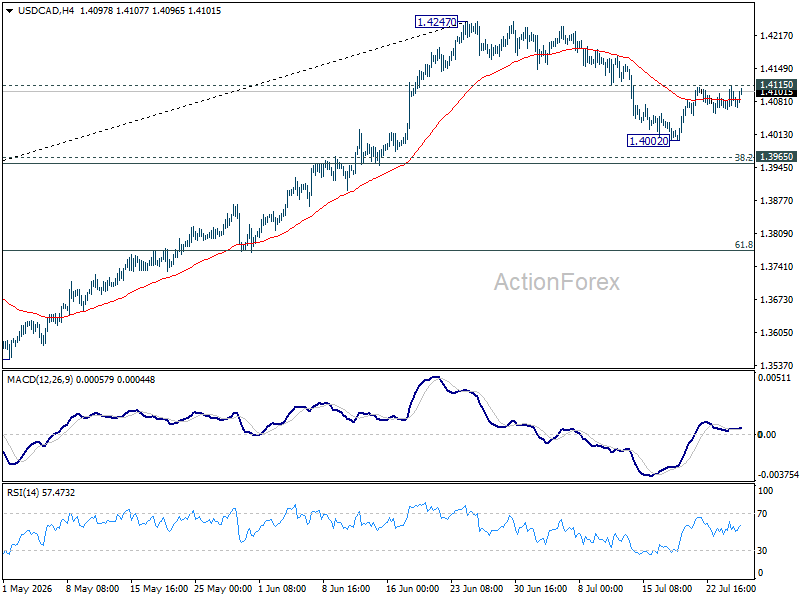
USD/CAD's breach of 1.4115 resistance suggests that corrective pullback from 1.4247 has already completed at 1.4002. Intraday bias is back on the upside for retesting 1.4247 first. In case of another fall, downside should be contained by 1.3965 cluster support (38.2% retracement of 1.3480 to 1.4247 at 1.3954 to bring rebound.
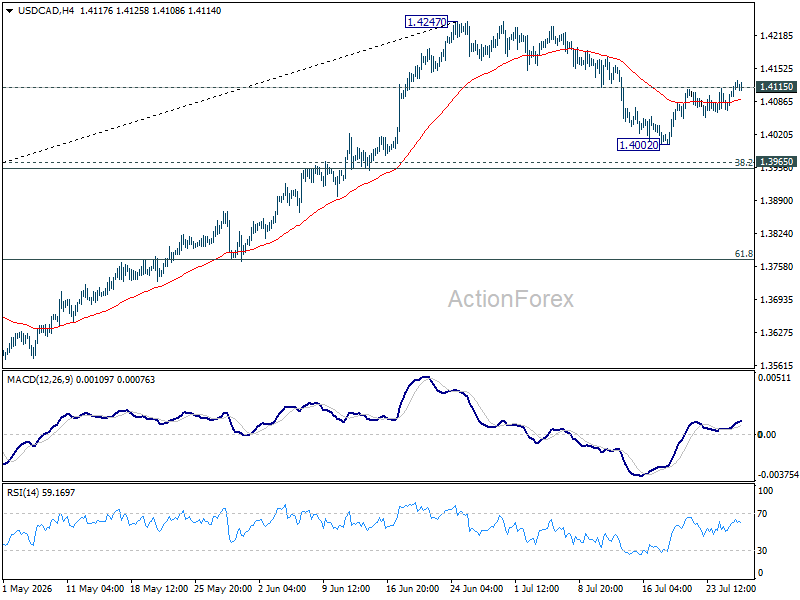
In the bigger picture, current development suggests that fall from 1.4791 has completed as a three wave correction to 1.3480. It's still early to judge if rise from there a corrective bounce, or resumption of the larger up trend from 1.2005 (2021 low). But in either case, retest of 1.4791 high should be seen next.
USD/CAD Daily Outlook
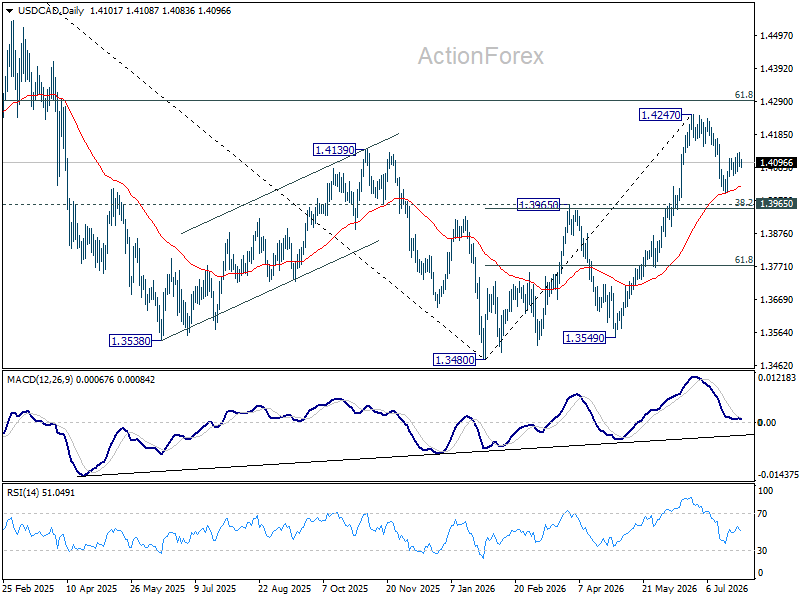
Intraday bias in USD/CAD remains neutral for the moment. . On the upside, firm break of 1.4115 will indicate that corrective pullback from 1.4247 has completed, and bring stronger rally to retest this high. In case of another fall, downside should be contained by 1.3965 cluster support (38.2% retracement of 1.3480 to 1.4247 at 1.3954 to bring rebound.
In the bigger picture, current development suggests that fall from 1.4791 has completed as a three wave correction to 1.3480. It's still early to judge if rise from there a corrective bounce, or resumption of the larger up trend from 1.2005 (2021 low). But in either case, retest of 1.4791 high should be seen next.