Executive Summary
Exports of transportation equipment, computer & electronic products and chemicals have madelarge contributions to overall U.S. export growth since the current global upswing started in 2009.But exports of crude oil and petroleum products have punched well above their fighting weight interms of their contribution to overall export growth in recent years. Looking forward, we expectthat continued global economic growth and booming American oil production will support solid gains in overall U.S. export growth.
But we readily acknowledge the downside risks to this sanguine base case view. Specifically, therecent imposition of tariffs by the United States could lead to a trade war with important tradingpartners which could cause our current export forecasts to be optimistic. Although the “first order”effects of a trade war on the overall U.S. economy should be limited, there are potential knock-on effects that could cause the drag on U.S. economic growth to be more meaningful.
Petroleum Has Accounted for an Outsized Share of Export Growth
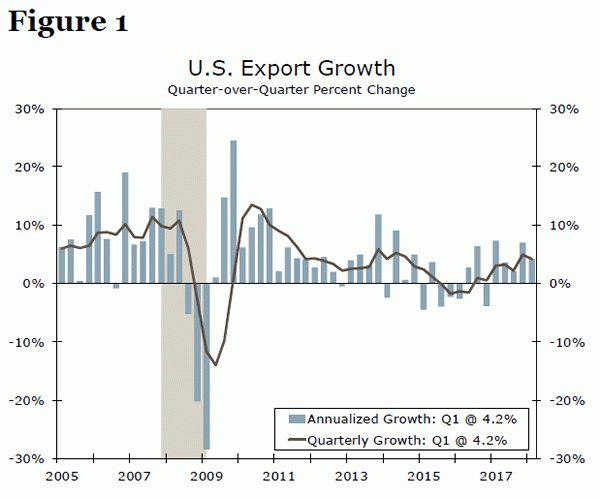
In a report we wrote earlier this year, we outlined our outlook for U.S. export growth in 2018 and2019.1 We forecasted, at the time, that real exports of goods and services would grow 5.4 percentthis year and 7.0 percent in 2019. Not only did exports end 2017 with good momentum—realexports of goods and services grew 7.0 percent at an annualized rate in Q4-2017—but they havecontinued to grow at a solid pace thus far in 2018 (Figure 1). Unless the wheels of export growthcome off in coming months, which we do not anticipate unless a full-blown trade war develops,then the 5.4 percent growth rate that we had forecasted in February should still be more or lessachievable.2 If realized, this growth rate would be stronger than the 4.2 percent annual average rate that real export growth has averaged in the post-crisis period.
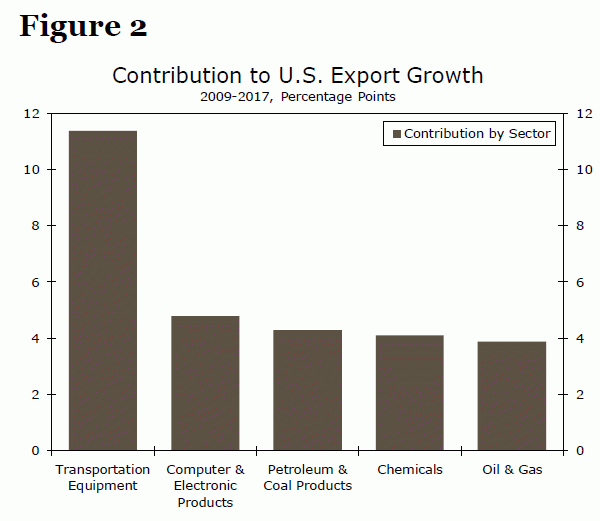
In value terms, American exports of goods rose 48 percent between 2009 and 2017. Are there anyspecific industries that stand out as important drivers of this marked increase in exports since2009? As shown in Figure 2, the transportation equipment industry (NAICS code #336) was thesingle most important driver to overall export growth, contributing more than 11 percentage pointsto the 48 percent increase in nominal goods exports between 2009 and 2017. Rounding out the topfive industries in terms of largest contributions to overall export growth were computer & electronicproducts (#334), petroleum & coal products (#324), chemicals (#325), and oil & gas (#211).Together, these five broad industries accounted for 60 percent of the increase in nominal goodsexports between 2009 and 2017. But this focus on the entire post-crisis period masks some interesting developments more recently.
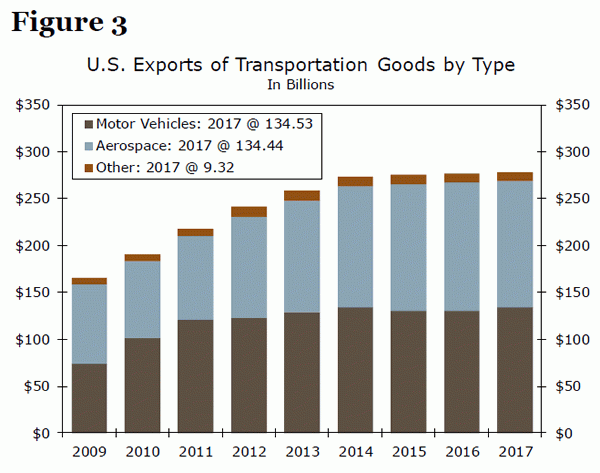
Let’s start by taking a closer look at the broadly-defined transportation equipment industry. Asshown in Figure 3, motor vehicles and parts have accounted for roughly one-half of the exports ofthe broadly-defined industry in recent years, with aerospace (i.e., aircraft) accounting for the otherhalf.3 Although exports of transportation equipment rose sharply in the years immediately following the global financial crisis, they have been essentially flat on balance since 2014.
In contrast, exports of the American oil & gas industry have ramped up significantly over the pastfew years. The value of crude oil and liquid natural gas exports totaled less than $7 billion in 2009,held back in part by legislation that essentially banned the export of crude oil. But Congress liftedthe ban in late 2015, and exports of crude oil and liquid natural gas jumped to $45 billion in 2017.The ban did not apply to refined petroleum products, and American exports of these products totaled $41 billion in 2009. Exports of refined petroleum products doubled to $83 billion last year.
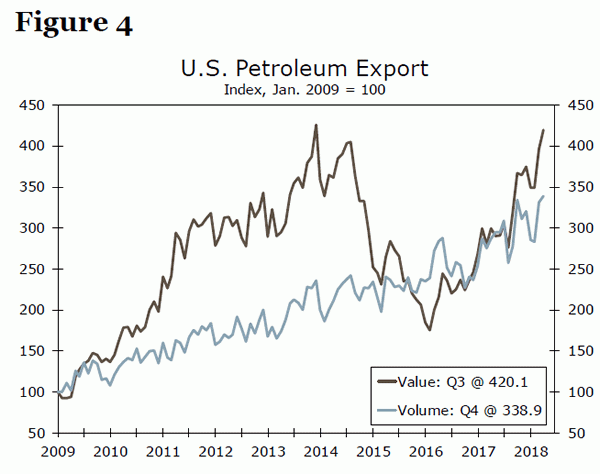
Values of total petroleum exports were supported in 2009 through 2014 by higher volumes as wellas by rising oil prices (Figure 4). The value of petroleum exports then weakened significantly in2015 and 2016 due to the collapse in oil prices. Nevertheless, volumes of petroleum exportscontinued to trend higher during those years. Indeed, volumes of petroleum exports haveaccounted for an outsized proportion of overall growth in real exports of goods in recent years. Although petroleum products (crude oil and refined products) represent only 12 percent of total exports at present, they accounted for two-thirds of the growth in real exports between 2014 and 2017.
Where To From Here?
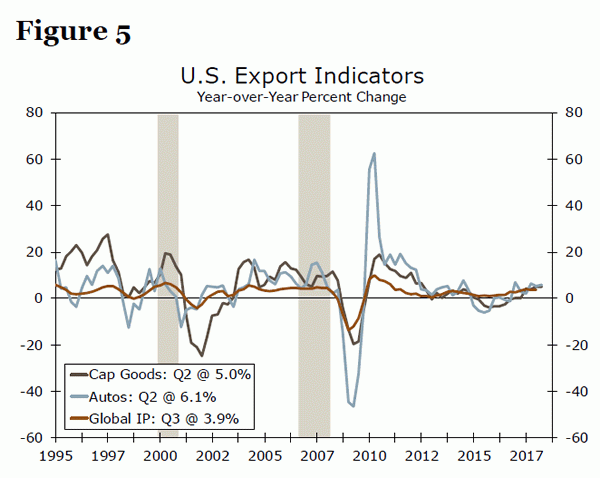
So what does this disaggregation tell us about prospects for American exports going forward? Themarked increase in exports of transportation equipment, chemicals and computer & electronicproducts in the immediate aftermath of the global financial crisis largely reflected the accelerationin global economic activity that occurred in those years. As shown in Figure 5, there is a high degreeof correlation between growth in real exports of capital goods (computer & electronic products areincluded in this category) and growth in global industrial production (IP), which we use as a proxyfor global economic activity. Similarly, growth in exports of autos (transportation equipment) andgrowth in global IP are also highly correlated.4 Although global economic growth may downshift abit this year relative to 2017, we generally look for the global economic expansion to remain intact.If so, then growth in exports of cyclically sensitive goods such as transportation equipment,chemicals and computer & electronic products should remain solid.
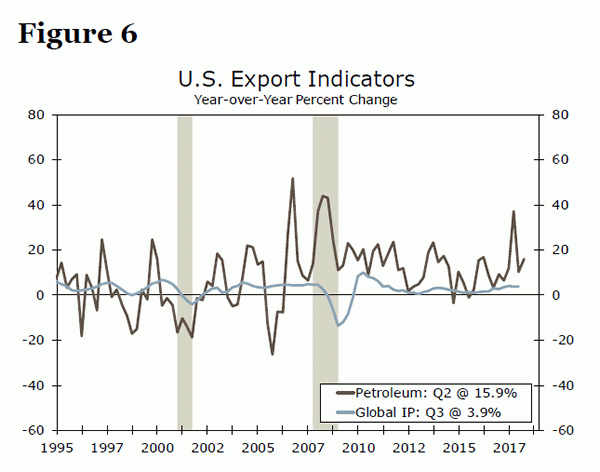
However, the correlation between growth in the volume of U.S. petroleum exports and global IPgrowth is rather low (Figure 6).5 Global economic growth was strong in the late 1990s and again inthe years preceding the global financial crisis, but volumes of U.S. petroleum exports were flatduring those years. But volumes of U.S. petroleum exports have shot up more than threefold since2009 despite generally lackluster growth in global IP. So something other than global growth is behind the sharp increase in American petroleum exports in the current cycle.
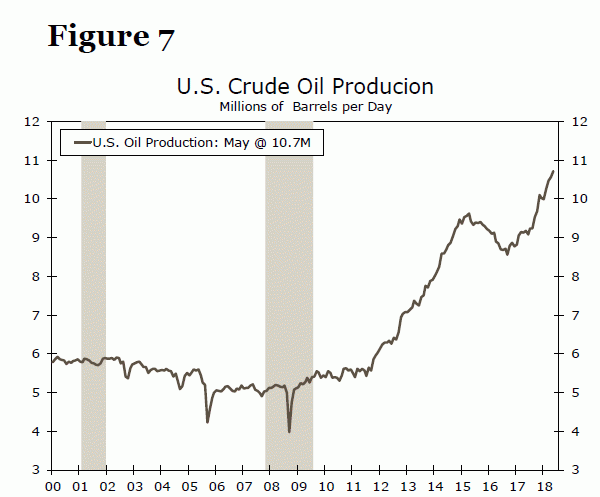
The widespread application of hydraulic fracturing (fracking) technology over the past decade hasbeen a game changer in terms of American petroleum exports. U.S. oil production has more or lessdoubled over the past five years, and daily production is closing in on 11 million barrels per day(Figure 7). With American oil consumption flat at roughly 20 million barrels per day since the turnof the century, petroleum exports should continue to trend higher provided that U.S. oil production continues to skyrocket, which seems likely.
Conclusion
U.S. exports came into the year with a fair amount of momentum, and recent data has shown that export growth has remained solid thus far in 2018. Continued growth in global economic activity should help to support growth of cyclically-sensitive exports such as transportation equipment, computer & electronic products, and chemicals. The boom in U.S. oil production that is underway should continue to propel exports of crude oil and refined petroleum products higher. Moreover, petroleum probably will continue to make outsized contributions to overall U.S. export growth. The export growth rates of 5 percent that we forecast for the United States for this year and 6 percent for next year should be achievable, provided that something does not go wrong.
But therein lies the rub. We forecast that the global economic expansion should continue for the foreseeable future, but there are numerous shocks that could potentially occur that could cause global economic growth to weaken, thereby leading to slower export growth. Perhaps the most immediate downside risk to our export forecast involves a potential trade war. The Trump administration has announced that it plans to levy tariffs on imports of steel and aluminum products, and affected countries, including Canada, China and members of the European Union, have vowed to respond with their own retaliatory measures. Furthermore, the administration announced on June 15 that it plans to levy a 25 percent tariff on $50 billion worth of Chinese goods. China likely will respond to these additional tariffs with its own measures.
As we have written previously, the “first order” effects of a trade war on the overall U.S. economy should be limited.6 That is, any hit to export growth from a trade war likely would not be big enough to cause a U.S. recession. However, we also highlighted some potential knock-on effects (i.e., slower growth in consumer spending due to stock market volatility, weaker business fixed investment spending) that could compound the “first order” effects. Our base case calls for continued solid growth in American exports, led by robust growth in petroleum exports. We readily acknowledge, however, the downside risk to this sanguine outlook.

