Highlights
- U.S. President Donald Trump has initiated an investigation of American imports of motor vehicles and parts on national security grounds – the same basis that was used to justify tariffs on steel and aluminum.
- Assuming that the ultimate outcome of the investigation is the imposition of tariffs of a similar magnitude, the impact on Canada would be significant. 2019 growth would be reduced by half a percentage point as the economy stagnates for two quarters.
- Business investment is the most significantly impacted, creating permanent ‘scarring’ that reduces Canada’s long-run economic capacity.
- Given the concentration of the auto sector, Ontario bears the brunt of the impact, with growth reduced by as much as two percentage points. Significant job losses also occur – up to 1 in 5 Ontario manufacturing jobs could be at risk.
- This analysis includes only direct impacts. Supply chain and income shocks could magnify the economic impacts.
Importantly, the scale of the impact will depend on the tariffs imposed (if any). More modest tariffs would moderate the outcomes presented. - TD Economics’ baseline outlook remains that NAFTA disputes are ultimately resolved. The scenario presented here should only be taken as a ‘what if’ analysis, underscoring the importance of the ongoing negotiations.
On May 23, the U.S. Department of Commerce began a ‘Section 232’ investigation of automotive imports, including parts. This is the same section of legislation that was used to justify recently imposed tariffs on steel and aluminum on national security grounds (see commentary). This report considers a scenario in which the results of this investigation are used to justify U.S. tariffs on autos and parts of a similar magnitude to those imposed on steel and aluminum. Given the importance of the auto sector to Canada (nearly a fifth of total 2017 bilateral trade in goods), and in particular to Ontario (roughly 40% of exports), this scenario is unequivocally negative. Annual growth in 2019 is reduced by half a percentage point at the national level. Ontario fares even worse, bearing the brunt of the impact. What’s more, a ‘scarring’ of business investment occurs, meaning the level of investment is permanently lower as a result, reducing Canada’s long term economic capacity. The magnitude of this scenario underscores the high stakes facing Canadian trade negotiators.
Current state of play
U.S. President Trump has on numerous occasions expressed distaste for auto imports. Words became actions on May 23, as the U.S. Department of Commerce began an investigation of auto and parts imports on national security grounds. The Department is required to report its findings and recommendations by February of 2019, although it may do so earlier. The President then has 90 days to make a decision, with no requirement that the President implement the recommendations in any specific way.1
Auto sector a significant part of Canada’s economy
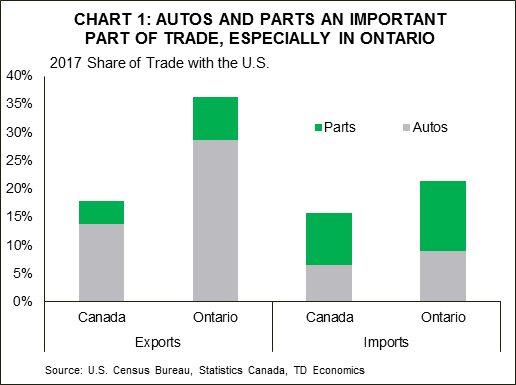
The auto sector is a significant part of the Canadian economy, and Ontario’s in particular. Autos and parts exports made up nearly a fifth of the 2017 total (Chart 1), with this share roughly double for Ontario. The sector has become integrated across North America, particularly with significant bilateral trade in both finished vehicles and parts with the United States. All told, roughly C$74 billion dollars of exports stand to be impacted by potential tariff imposition (nearly 4% of Canadian GDP), with spillover effects likely to hit the roughly C$45 billion of auto and auto part imports as well. The appendix contains a listing of specific products assumed to be targeted based on the U.S. Commerce Department’s investigation announcement.2
Key assumptions
A tariff of 10% on motor vehicle parts, engines, etc. is assumed, and a 25% tariff on motor vehicles. This is meant to follow the rough ‘logic’ of applying a greater tariff to the greater value-added trade category, and minimize, to an extent, U.S. supply chain disruptions. This results in a weighted tariff rate of 21% on autos and parts exported to the U.S. from Canada, equivalent to a 2.9% tariff on overall exports.3 Taking the aluminum and steel tariffs as precedent, Canada is assumed to retaliate, applying equivalent tariffs on an equal value of imported U.S. goods. The result is an effective 5.4% weighted tariff on imports.4 Tariffs are assumed to become effective on July 1, 2019 – similar to the steel and aluminum tariffs, a response to the Commerce Department findings from the President is expected in March 2019 with an initial exemption that ultimately expires.
Scenario analysis suggests a modest economic pull-back, concentrated in Ontario
The scenario analysis consists of two key shocks that occur simultaneously. The first is the direct tariffs impacts, applied as shocks to export and import prices. This generates a permanent shift in these price levels. U.S. spending is assumed to respond in line with historic elasticities, creating a negative demand shock for Canadian goods. The second element consists of confidence impacts, which negatively affect equity markets, consumer sentiment, and most importantly, business confidence and investment intentions.
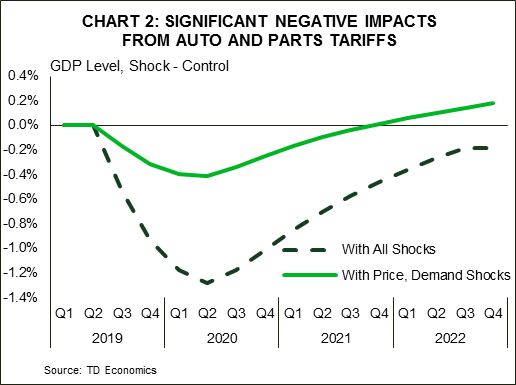
The results are striking. The impact of phase one is relatively modest, sending economic output roughly 0.4% lower than would otherwise have been the case, reaching peak impact after roughly four quarters. This lost ground is made up within about two years. Inclusion of confidence effects creates a significantly worse outcome. The peak impact on the level of output is roughly 1.2%, again after about four quarters. This is an output loss of about $25 billion in 2007 constant dollars (i.e. real terms). What’s more, significant disinvestment also occurs, meaning that part of this lost output is never recovered. This ‘scarring’ (or negative supply shock) leaves the level of output permanently 0.2 percentage points below the ‘business as usual’ or baseline scenario (Chart 2).
To put it in more concrete terms, GDP growth stagnates, effectively flat for half a year with growth of -0.7% and -0.1% q/q annualized in 2019Q3 and 2019Q4 respectively. This shaves roughly half a percentage point off of 2019 growth. Significant job losses also result, with roughly 160k net positions shed, relative to status quo. Almost all of these losses would occur in Ontario.
For perspective, 1.7 million Canadians worked in manufacturing in 2017, of which 771k were in Ontario. This shock thus means there is the potential of losing nearly 1 in 10 of the jobs in this sector, or 1 in 5 in Ontario. This would be effectively a repeat of the job losses recorded between 2008 and 2010 – losses that have yet to be recovered.5 Such a shock would be enough to erase all of the gains (across all industries) in employment that Ontario experienced over the last two years.
Although Canada as a whole may experience a brief pause in growth, for Ontario the impacts are more severe. GDP growth would be reduced by as much as 2 percentage points, similar to the 2007/2008 experience. Some offset to these impacts would be expected via monetary policy, as the Bank of Canada would likely cut its policy interest rate in response to such significant tariffs. The loonie would also depreciate by 8% to 15%, with significant volatility coming alongside. That the negative impacts summarized in Table 1 occur despite these offsets speaks to the size of the risks around current trade negotiations.
Importantly, this analysis does not include potential government support programs. As has been shown by Quebec’s reaction to aluminum tariffs, there is likely to be a government response. Given the importance of the sector, both provincial and federal support is likely. This may ease some of the impact, but given the significant trade exposure and substitutability of a number of major products, it is difficult to envision a support package able to mitigate the bulk of the negative impacts.
Even those Canadians fortunate enough not to be in the direct line of fire are likely to feel the pinch in their pocketbooks. Tariffs generate what economists call a ‘deadweight loss’ – the impacts on prices and consumption that result are usually larger than the revenue generated by the tariffs. This means that even were the government to redistribute these revenues to those affected, it would not be enough to make them whole again. This well established result is one of the key reasons that free trade is an area in which economists almost universally support.6
Indeed, although the focus of this report is Canada, the U.S. would also be negatively impacted. Roughly half of new vehicles sold in the U.S. in 2017 were imported, meaning U.S. consumers will feel the hit, even before supply chain disruptions and other negative impacts are considered.
This scenario may paint a fairly negative picture, but if anything, the risks are tilted further to the downside. The economic models employed in this analysis are typically used for macroeconomic forecasting and policy analysis, and don’t include full industry linkages. Thus, while the confidence shocks should account for most of them, the spill-over effects may be even larger. It is not hard to envision negative impacts hitting housing markets, retail sales, and other key indicators, particularly in the Greater Golden Horseshoe area of Ontario, where a significant portion of the auto sector is located.
Bottom line
From the auto pact through to CUSFTA and NAFTA, the Canadian auto sector has enjoyed a long history of access to the U.S. market, and is an important element of the Canadian economy. This importance means that a potential U.S. imposition of tariffs, and corresponding retaliatory tariffs by Canada, would have a deleterious effect on economic output, leaving the economy effectively at a standstill for half a year. The impact on Ontario would be markedly worse given the sectoral concentration. Fortunately, this analysis stands as simply a ‘what if’. Our baseline view remains an eventual resolution of NAFTA negotiations, despite recent developments that increase the tail risk of a dissolution or outright trade war. Given U.S. capacity utilization rates, recommended tariffs may be lower than those assumed in this analysis, reducing their impact. Plus, the high visibility of potential tariffs and resulting price increases are unlikely to prove popular with voters. Nevertheless, the importance of the auto sector and of trade more generally to the Canadian economy underscores the magnitude of the challenges facing Canada’s trade negotiators.
End Notes
- For example, the steel investigation recommended tariffs of 24% on all steel imports, and 7.7% for aluminum. In both cases, higher targeted tariffs were recommended as an alternative. Ultimately, tariffs of 25% and 10% were implemented respectively, with some countries exempted based on voluntary export restrictions (quotas).
- Of note, the statement makes no reference to other transportation products such as motor coaches, buses, or aircraft.
- It should be noted that in the case of the steel and aluminum tariffs, the levels recommended by the Commerce Department were chosen with the goal of bringing capacity utilization in these sectors to the 80% mark. This is considered the “minimum rate needed for the long-term viability of the industry”. By way of comparison, in April of 2018, U.S. motor vehicle and parts manufacturers were operating at 80.5% capacity. Capacity utilization for 2017 as a whole averaged 77.7%
- Despite the relatively high industry tariff assumed, the effective rate used in this analysis may be slightly conservative as the highly integrated nature of the North American auto industry means that parts can cross the border multiple times during the production process, potentially compounding tariff impacts.
- Manufacturing employment in Ontario peaked at around 1.1 million in 2004, but has remained around the 750k mark from 2010 onwards.
- See for instance the results of the IGM forum survey of a wide sample of economists from across the political spectrum. It is of course worth also acknowledging that the benefits come with distributional income and employment impacts that should be recognized.
Appendix: Specific product categories and tariffs assumed
The following product categories (and HS codes) and tariffs form the basis of the analysis: