
U.S. Review
Softer First Quarter Coming Into Focus
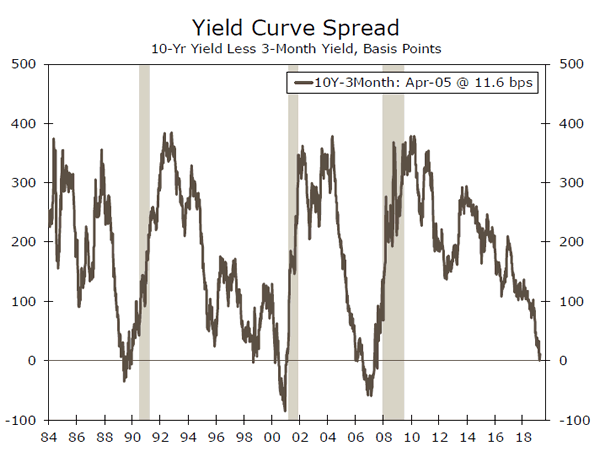
- The recent—but temporary—inversion of the yield curve deepened worries that the next recession could be sooner than many forecasters are anticipating.
- Recent data continue to suggest a softer first quarter, but with the underlying fundamentals of the U.S. economy generally solid at present, talk of an imminent recession is a bit overdone, in our view.
- With the moderation in job growth, and wage growth showing no further signs of acceleration in March, it remains unlikely that the FOMC will alter its “patient” stance any time soon.
Softer First Quarter Coming Into Focus
Weaker economic data have sparked fear of recession, and the recent—but temporary—inversion of the yield curve (chart on front page) deepened worries that the next recession could be sooner than many forecasters are anticipating. Recent data continue to suggest a softer first quarter, but with the underlying fundamentals of the U.S. economy generally solid at present, talk of an imminent recession is a bit overdone, in our view. Absent some unforeseen shock, “talking” ourselves into a recession seems to be the most realistic way the U.S. economy could experience one in the foreseeable future. Nevertheless, the economy is certainly losing momentum.
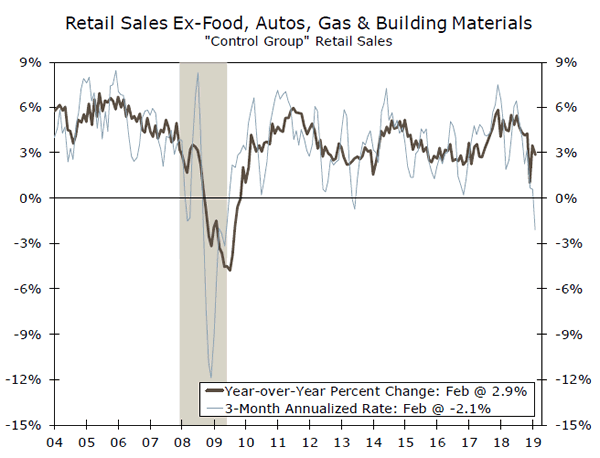
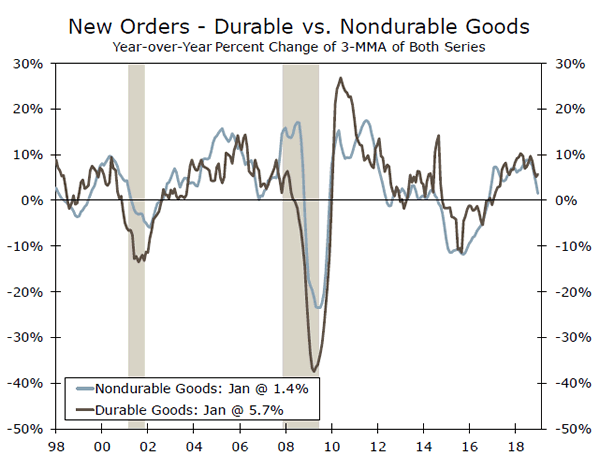
A main area of concern is the consumer. Accounting for almost 70% of GDP, a large retrenchment in consumer spending would materially weigh on economic growth. Consumer spending data have been extraordinarily choppy in recent months, and the mixed February retail sales report served as the latest affirmation that the consumer is in a bit of a soft patch. Retail sales declined 0.2% in February, but January’s gain was revised more than three times higher than initially reported. Control group sales—which feed into the calculation of personal consumption expenditures in GDP estimates—also fell 0.2%. That nudged the three-month annualized rate to -2.1%, a rate not seen outside of a recession in the past 15 years (top chart). Other data suggest risks are stacked to the downside for Q1 consumer spending, but our sense is that this weakness is likely temporary.
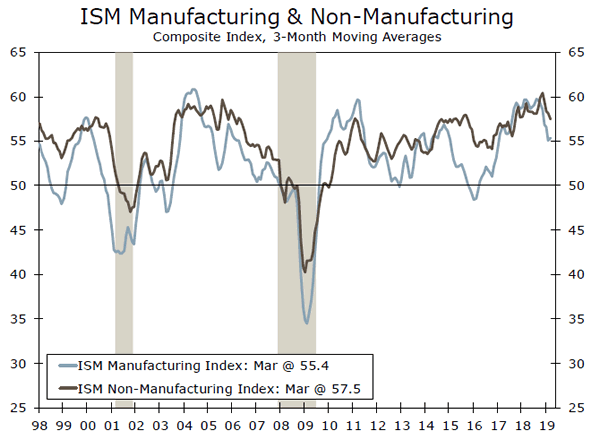
Equipment spending is also shaping up to be a weak spot in the first quarter, as U.S. manufacturing activity is under pressure from slower domestic demand and the still-uncertain trade environment. Durable goods orders fell 1.6% in February, and while nondefense capital goods shipments rose 0.6%, the 1.5% drop in January suggests only a tepid pace of equipment spending in the first quarter. While the manufacturing sector still faces challenges, the ISM manufacturing survey allayed some fears that U.S. factory activity is slowing dramatically. The ISM nonmanufacturing index, on the other hand, fell to a 20-month low in March. However, both the manufacturing and non-manufacturing indices remain firmly in expansion territory (middle chart), consistent with the economy continuing to grow, just at a slower rate than last year.
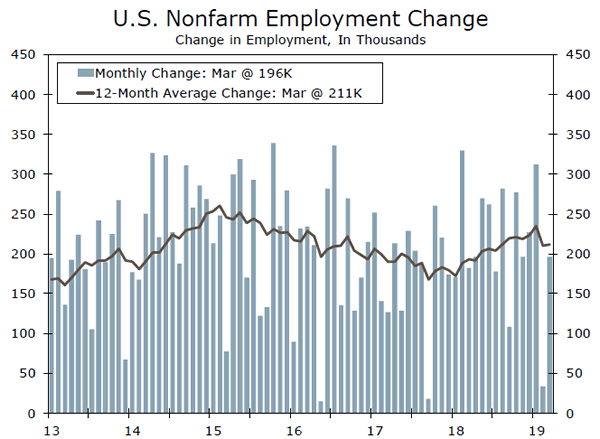
The employment picture remained positive. Employers added 196,000 jobs in March—welcome news after the largely disappointing gain in February (bottom chart). While the most recent print was slightly stronger than expected, it still suggests that the overall trend in hiring is moderating from the robust pace of job growth we saw last year. But by just about any measure, the labor market remains exceptionally tight, adding to our view that a prolonged retrenchment in consumer spending remains unlikely. With the moderation in job growth, and wage growth showing no further signs of acceleration in March, it remains unlikely that the FOMC will alter its “patient” policy stance any time soon. Economic growth is set to moderate this year. But after what we suspect to be a weak first quarter, GDP growth should return to a trend-like pace in the second quarter.
U.S. Outlook
Factory Orders • Monday
Slower growth at home and abroad, alongside lingering uncertainty surrounding trade policy, has put a damper on U.S. manufacturing activity. The advance durable goods report for February showed orders falling 1.6%. Nondefense capital goods orders ex-aircraft, an indicator of business investment in equipment, held up better, but have declined 3.4% on a three-month average annualized basis.
Monday’s report will provide an updated estimate on February capex spending, but the new information in the report will be for orders and shipments for nondurable goods. Nondurables account for half of U.S. factory orders, and have come under pressure the past few months as energy prices, which influence the value of petroleum and chemical orders, have fallen. We look for a slight increase in nondurable orders in February, however, which should limit the decline in total factory orders to -0.6%.
Previous: 0.1% Wells Fargo: -0.6% Consensus: -0.5%
Consumer Price Index • Wednesday
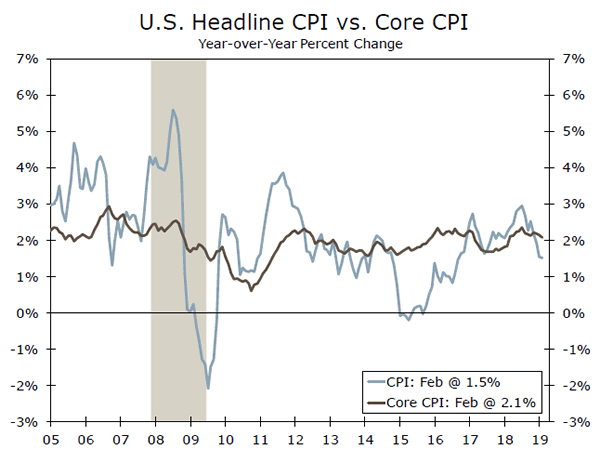
Consumer price inflation remained tame in February with headline prices increasing 0.2%, and core prices advancing just 0.1%. We expect price growth to heat up a bit in March. Gas prices according to AAA rose more than 9% last month, which should help lift headline inflation to 0.4%. Meanwhile, core prices are expected to increase 0.2%, driven in part by a rebound in medical care costs.
Even with a pickup in March, the overall trend in inflation should be little changed. Core inflation is expected to remain at 2.1% on a yearago basis, which is close to the Fed’s goal. An upside surprise to the core index would suggest that inflation is picking up on trend and reduce market expectations for a Fed rate cut later this year. A downside miss on core inflation, however, would give the FOMC another reason to be patient in adjusting rates despite continued strength in the labor market.
Previous: 0.2% Wells Fargo: 0.4% Consensus: 0.3% (Month-over-Month)
Producer Price Index • Thursday
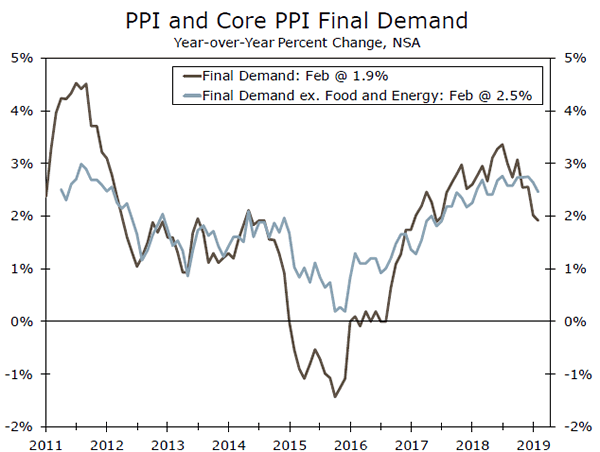
Producer price inflation has weakened since the start of the year, with the PPI for final demand easing to 1.9% year-over-year from more than 3% as recently as October. The slowdown partly reflects weaker energy prices since last fall, but PPI inflation for non-food and energy goods has moderated, as has price growth for services.
We look for energy prices to lift the headline index 0.3% in March. Core inflation is also expected to rise faster than in February as weakness from the volatile trade services component, which is measured by margins, not selling prices, reverses. The duration of the upturn will likely be limited, however, as growth in input prices for goods and services, even when excluding food and energy, has weakened recently.
Previous: 0.1% Wells Fargo: 0.3% Consensus: 0.3% (Month-over-Month)
Global Review
Stronger PMI Readings Temper Global Growth Fears
- Stronger-than-expected readings on purchasing manager indices in China and the United Kingdom kicked off the week on a positive note.
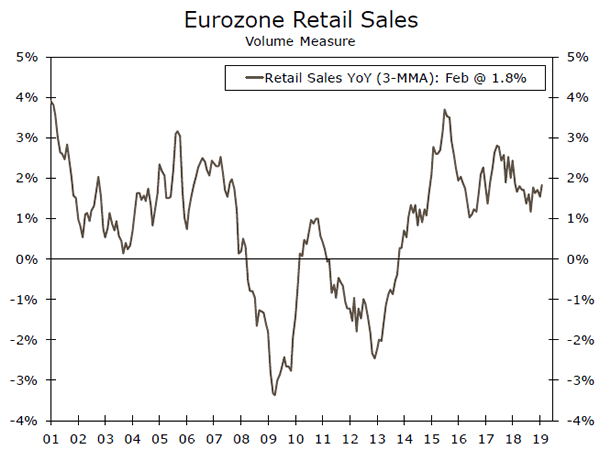
- A solid retail sales print in the Eurozone was also encouraging, although the divergence between the service and manufacturing sectors appeared to widen further.
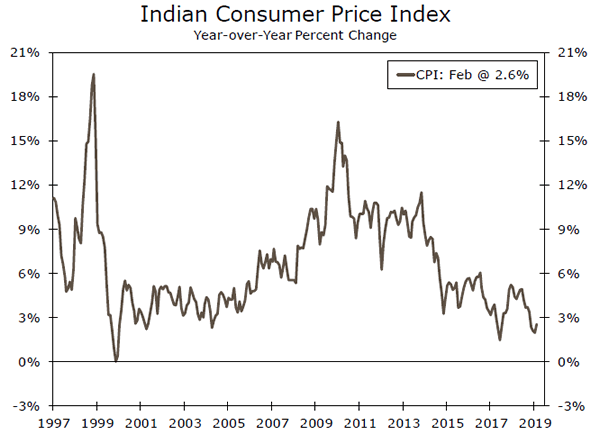
- Like many of the other major central banks around the world, the Reserve Bank of India took a dovish turn this week, cutting its main policy rate 25 basis points.
Stronger PMI Readings Temper Global Growth Fears
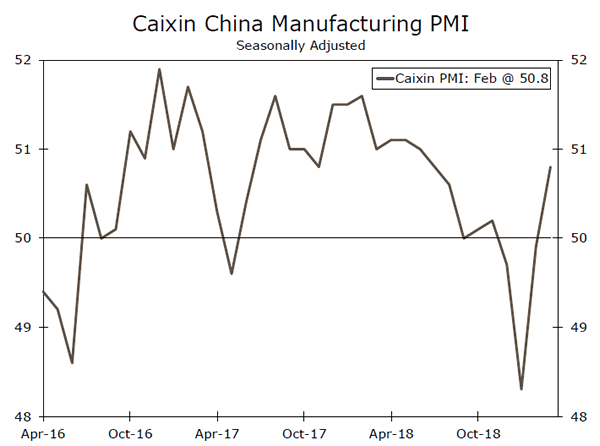
Stronger-than-expected readings on purchasing manager indices (PMIs) in China and the United Kingdom kicked off the week on a positive note. China’s Caixin Manufacturing PMI rose to 50.8 in March, up from 49.9 in February and a multi-year low of 48.3 in January (see chart on front page). While the reading was still fairly soft on an absolute basis, the improvement over the past couple months offers some signs that the monetary and fiscal stimulus enacted by Chinese policymakers is beginning to take hold.
A few hours later, PMI data for the United Kingdom’s manufacturing sector also topped expectations, rising to 55.1 in March compared to expectations for a slight decline to 51.2. Although we are skeptical of such a strong reading (see the Global Outlook section for more), the positive back-to-back prints assuaged some fears about the global slowdown and helped spark a general rally in risk assets over the course of the week.
Retail sales data for the Eurozone were also encouraging. Real retail sales climbed 0.4% in February, bringing the year-over-year change to 2.8%. Although retail sales growth has clearly slowed over the past couple years, it has shown signs of stabilizing of late (top chart). This pick-up suggests the consumer sector in Europe remains in decent shape even as the factory sector has struggled. To that point, the final March PMI readings for the Eurozone showed an upward revision to services (to 53.3 from 52.7) but continued weakness in manufacturing (to 47.5 from 47.6).
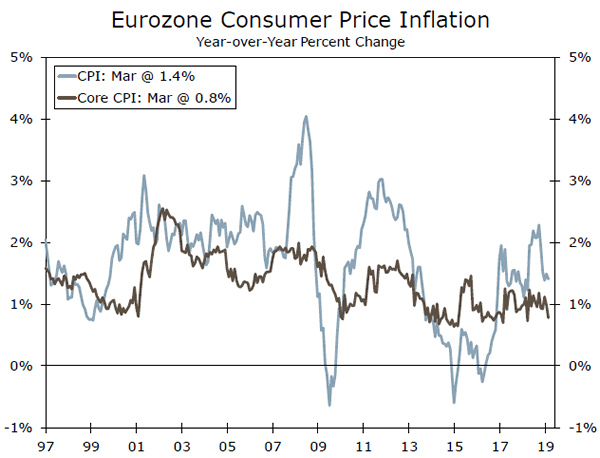
As economic growth has slowed in the Eurozone, price growth has also cooled. Data released this week showed core consumer price inflation in the Eurozone was just 0.8% year-over-year in March, the lowest reading in almost a year. In the foreword to its annual report released on April 1, European Central Bank (ECB) President Mario Draghi noted that “substantial monetary policy stimulus remains essential to ensure continued build-up of domestic price pressures over the medium term.”
Like many of the other major central banks around the world, the Reserve Bank of India (RBI) took a dovish turn this week, cutting its main policy rates 25 basis points. The RBI noted that the domestic economy is “facing headwinds, especially on the global front.” Though economic growth remains robust compared to most countries, real GDP growth in India has slowed over the past couple quarters, and private investment growth has been sluggish. In addition, inflation pressures have been fairly muted, as the consumer price index was up just 2.6% in February, at the low end of the RBI’s target of 4% with a tolerable band +/- 2% (middle chart). While the data appear weak enough to justify some policy easing, the timing comes on the eve of national elections in India. Given the recent questions surrounding possible political interference in the RBI, the recent policy move is unlikely to ease concerns about the central bank’s independence.
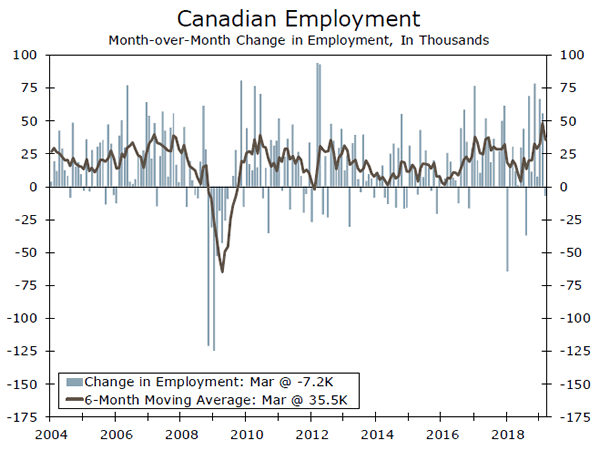
Canadian employment rounded out the week with a negative print. Employment fell by 7,200 in March, though this came on the heels of a strong February reading. Trend employment growth remains solid in Canada (bottom chart), and we believe this should help drive the Bank of Canada to hike rates once again later this year.
Global Outlook
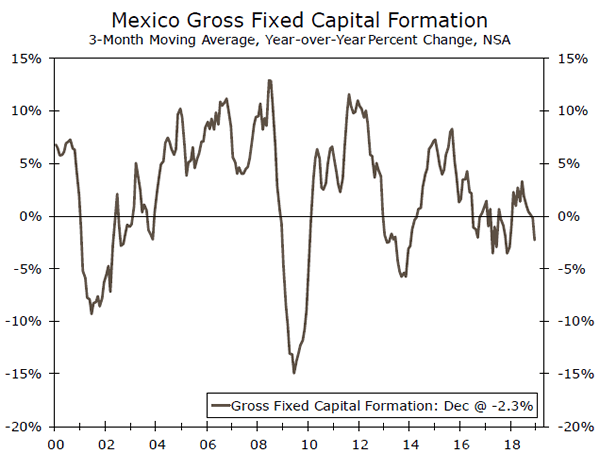
Mexico Gross Fixed Investment • Monday
Gross fixed capital formation growth has been weak in Mexico over the past few years, as trade uncertainty and high real interest rates have weighed on capital investment. Next week’s release will offer the first monthly data on capital formation in Mexico in 2019.
As we discussed in a recent special report on the outlook for Mexico’s economy, fixed capital formation is perhaps what the Mexican economy needs the most at present. Mexico’s oil industry has badly lagged behind its robust counterpart in the United States. It’s production of petroleum peaked at nearly 3.5 million barrels per day in the mid-2000s, and has since declined by 50%, to about 1.6 million barrels per day at present. While solving the oil energy’s woes would likely not be enough for a full reversal of the Mexican economy, steady growth in capital investment is key to faster productivity growth. Without it, it will be much harder for Mexico to return to its historically high rates of economic growth.
Previous: -6.8% (Year-over-Year)
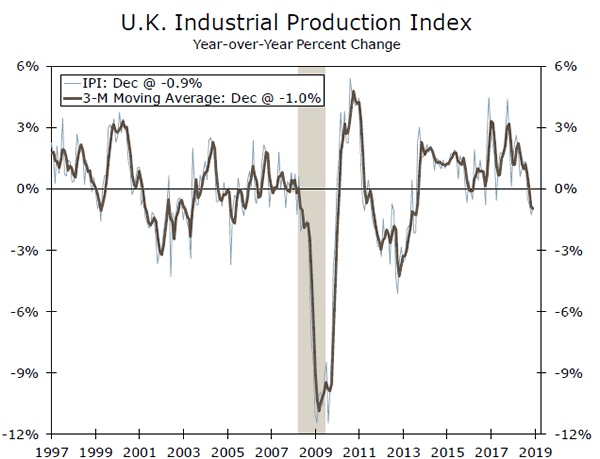
U.K. Industrial Production • Wednesday
The U.K. economy has been surprisingly resilient despite uncertainty around Brexit, at least when the data are taken at face value. GDP growth rebounded in January with a 0.5% month-over-month gain amid strong manufacturing output, while retail sales beat expectations in the first two months of 2019. In March, the U.K. manufacturing PMI jumped to 55.1, the highest in nearly a year.
While this strength is encouraging, particularly as it relates to consumer demand, it appears that at least some of the recent strength has been the result of inventory building as manufacturers prepare for a potential no-deal Brexit. On a year-over-year basis, the trend in industrial production is hardly encouraging (see chart to left). While stockpiling activity may boost Q1 real GDP growth in the U.K., there may be some payback over the second and third quarters. Were a no-deal Brexit to occur, a drag on growth from inventories would likely be the last thing the U.K. economy needs.
Previous: -0.9% (Year-over-Year) Consensus: -0.8%
European Central Bank• Wednesday
We do not expect any major policy changes from the European Central Bank (ECB) at its meeting next week, though we may get some additional details on the next phase of targeted longer-term refining operations (TLTROs). As was discussed in the global review section, growth and inflation in the Eurozone remain tepid, and this in turn has pushed back any plans the ECB had in regards to tightening monetary policy in 2019.
We continue to expect Eurozone economic growth and inflation to stabilize over the next couple quarters, and this should help forestall any additional outright easing by the central bank. Even if things stabilize, however, the ECB will likely proceed with caution. Some Eurozone economies like Italy are either in or close to recessions, and core consumer price inflation has been below 1.5% since August 2012. Unless economic conditions improve significantly, we think the first rate hike from the ECB will not occur until at least Q1-2020.
Previous: -0.40% (Deposit Rate) Consensus: -0.40%
Point of View
Interest Rate Watch
ECB On Hold for Foreseeable Future
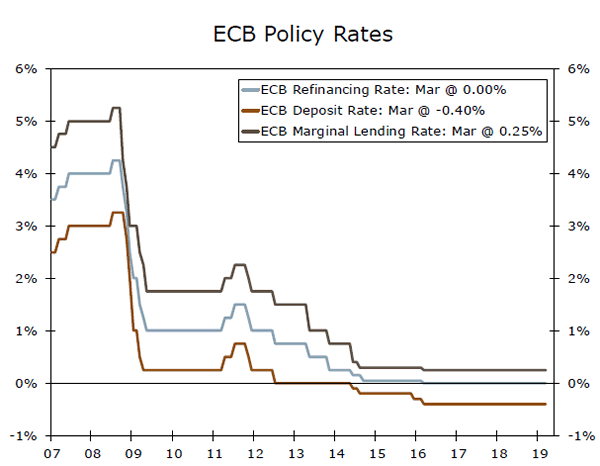
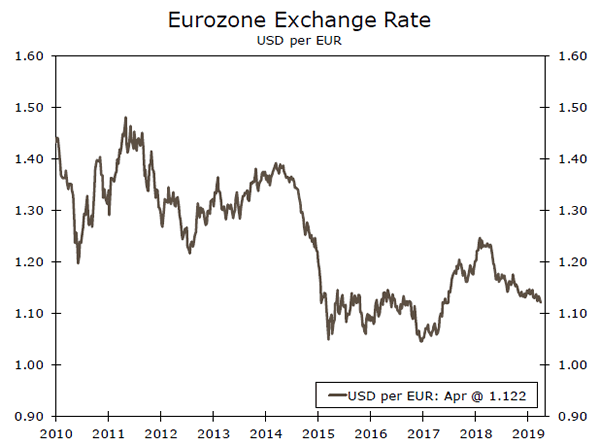
The European Central Bank released the minutes of its March 7 policy meeting this week, which offered some further insights into the current thinking of the Governing Council. As communicated in the March 7 policy announcement, the Governing Council pushed out the timing of when it expects to start raising rates, which have been held at historically low levels for three years (top chart). ECB policymakers had expected that its three main policy rates would remain unchanged through summer 2019. However, due to recent signs of economic weakness that “pointed to a sizeable moderation in the pace of the economic expansion that would extend into the current year” as well as “the persistence of uncertainties,” the Governing Council now thinks that rates will be on hold through at least the end of this year. As discussed on page 5, we think the first rate hike from the ECB will not occur until at least Q1-2020. Consequently, we believe that the value of the euro vis-à-vis the U.S. dollar will remain roughly unchanged for the foreseeable future (middle chart).
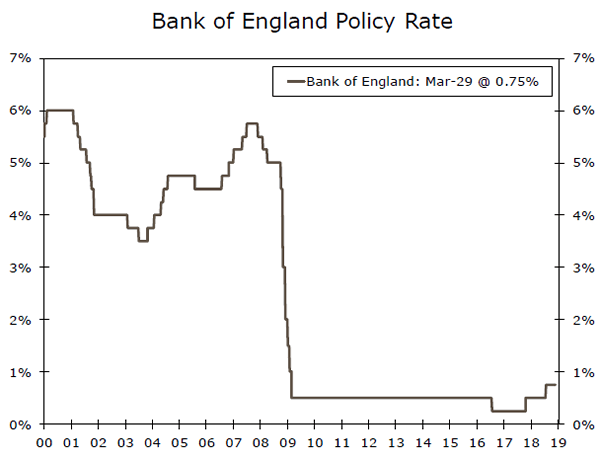
Brexit & the Bank of England
The Bank of England does not hold a policy meeting until May 2. But the uncertainty associated with the ongoing Brexit saga means that the Monetary Policy Committee (MPC) likely will continue to keep its main policy rate unchanged at 0.75% for the time being (bottom chart). As discussed on page 4, the uncertainty of the economic outlook showed up in the March PMIs which were released this week. Although the British parliament voted this week to take the option of a “hard” Brexit off of the table, economic uncertainty remains. The new rules that will govern the economic and financial relationship between the United Kingdom and the remaining 27 members of the European Union still need to be negotiated. We have been assuming that a “hard” Brexit would be avoided, but we recently downgraded our GDP growth forecast for 2019 to 1.3% from 1.5%. Consequently, we believe that the MPC will be on hold until this August, when we look for it to nudge up its main policy rate another 25 bps and then remain on hold through the end of the year.
Credit Market Insights
Banking Sector Resilient to Real Estate Price Declines
Financial institutions of all sizes have exposure to real estate through their lending portfolios, suggesting that a significant decline in property prices could spell trouble for the banking sector and possibly feed through to a tightening in credit throughout the economy. We have written that a downturn in commercial real estate prices would not likely be the catalyst for the next recession, and the Fed’s most recent stress test results largely support this conclusion. The largest financial institutions are much better capitalized than they were during the lead up to the financial crisis—the last time that property prices reached all-time highs—and stress test results suggest that they would be able to continue lending in spite of loan portfolio losses. Yet smaller banks that are not subject to Fed stress tests, which collectively comprise about 20% of the banking sector, tend to rely relatively more on real estate lending and benefit less from geographic diversification. Despite this heightened exposure, new research from the San Francisco Fed indicates that only around one percent of these smaller banks would be undercapitalized as a result of the most severe portfolio loss scenarios specified under the Fed stress tests.
Despite broad-based price appreciation across both commercial and residential real estate, the banking sector, which tightened lending standards and increased capital cushions in the aftermath of the financial crisis, is not overly exposed to a downturn in prices. Therefore, we do not expect—for now—the epicenter of the next recession to be the real estate sector.
Topic of the Week
Fallout from a Potential Border Closure
President Trump had threatened to close the U.S.-Mexico border, or at least parts of it, due to the surge of Central American migrants that have streamed into the country. While recent comments suggest the threat of a border closure has lessened, the possibility remains. Not only would a border closure stop many migrants from entering the country, but it also could have disruptive effects on trade flows. In a recent special report, we discuss some of the economic implications if the president were to carry through with this threat.
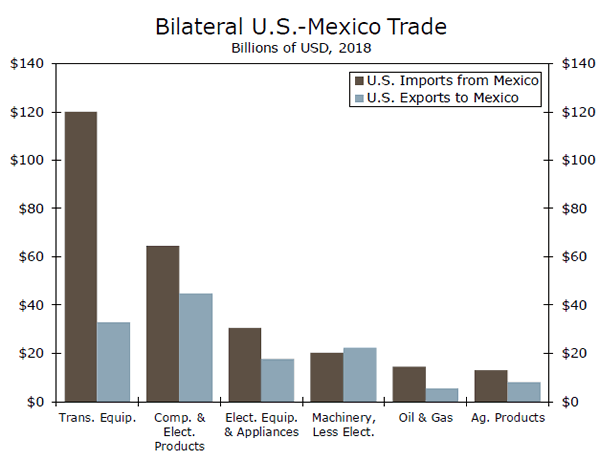
Last year, American exports of goods to Mexico totaled $265 billion while imports of goods exceeded $346 billion. Intra-industry trade in transportation equipment was especially intensive. As shown in the top chart, the United States sent $33 billion worth of transportation goods south of the border last year while it received $120 billion from Mexico, the vast majority of which were auto imports. About $64 billion of these auto imports were finished vehicles, but roughly $50 billion were auto parts. Consequently, a closure of the border could have a crippling effect on the U.S. auto industry.
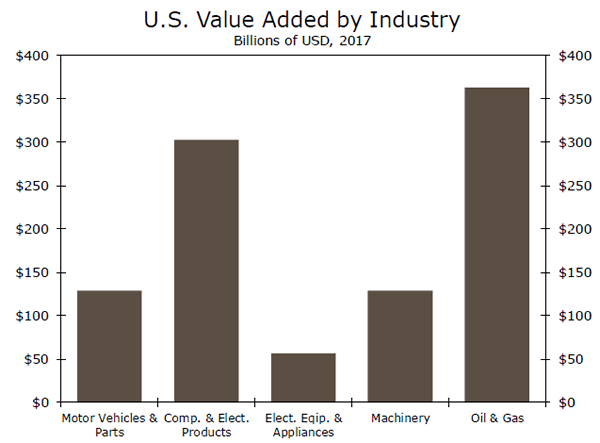
How big of an impact could this have on the U.S. economy? As shown in the bottom chart, real value added in the motor vehicle industry totaled almost $130 billion in 2017, which represented 0.7% of all the real value added in the U.S. economy in that year. Under the extreme assumption that a closure of the border would cause all motor vehicle production in the United States to come to a complete halt, then the direct hit to the U.S. economy would be about $2.5 billion per week. But there would be multiplier effects if idle auto workers pared back their purchases of goods and services. In terms of employment, the American auto industry employs roughly one million people, which represents 0.7% of total payrolls, and the computer industry employs a comparable amount. These workers could be idled under the extreme assumption that production in these industries completely shuts down.
Realistically, however, a closure of the southern border likely would not be disruptive enough to cause a recession in the United States. But the costs to growth could start to add up if the border were to remain closed for an extended period of time.


