
U.S. Highlights
- The American economy grew by 3.2% in the first quarter of 2019, comfortably beating market expectations. However, the strength was driven by inventories and net exports, while domestic demand growth weakened.
- The housing market continues to be an economic weak link. Existing home sales in March fell below expectations. A lack of inventory appears to be weighing on sales activity.
- As confirmed in the GDP report, price pressures were softer than expected early in the year, underpinning the Federal Reserve’s move to the sidelines.
Canadian Highlights
- The Bank of Canada’s April MPR was front and center this week. Both the global and Canadian economic outlooks were revised down for 2019.
- The Canadian economy is now estimated to be operating with more slack, lasting longer than previously forecast. This suggests that current stimulative interest rates will need to persist for some time.
- The weaker economic outlook is broadly consistent with our March QEF. As such, we anticipate that the policy interest rate will hold steady through 2020.
U.S. – Q1 Growth Surge Shakier Underneath The Hood
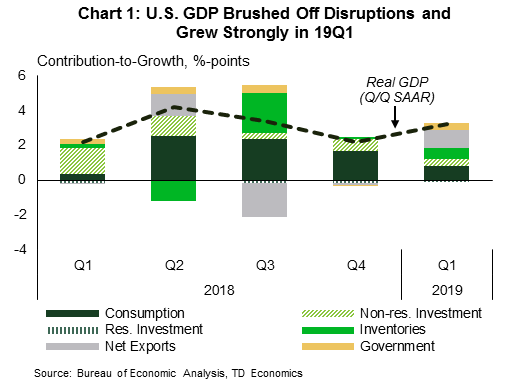
The U.S. economy brushed off disruptions caused by the partial government shutdown and abnormal weather, and grew strongly in the first quarter, beating consensus expectations by 0.9 percentage points (3.2% vs 2.3%). However, behind the sheen of the solid headline, the drivers of growth were not as lustrous. Domestic demand growth weakened, with consumers saving a little more and businesses slightly more cautious with their investments dollars. Instead, inventories and net exports – the more volatile components of GDP –provided the heavy lifting. The build-up of inventories is now a three quarter trend. It is likely to be reversed in the quarters ahead, dragging on real GDP growth. The good news is that with temporary disruptions dissipating, domestic demand should improve next quarter, taking the mantle in driving growth.
Amid the hurrah of strong real GDP growth, the one segment of the economy that continued to underperform was housing. Residential investment contracted in all four quarters of 2018, and pulled back again in the first quarter. Early indications suggest a mixed start to the second quarter. Existing home sales fell 4.9% in March, below consensus expectations. The pullback followed a strong gain in February, but the level of sales has shown little overall progress over the past several months (and is well off peak levels seen in the fall of 2017). Fortunately, the news was better on the new home sales front. New single-family residential sales rose 4.5%, building on even stronger gains in January and February. In contrast to the existing market, new home sales are just a touch below the recent cycle peak.
With affordability improving – a function of both lower mortgage rates and accelerating income growth – the demand drivers for housing appears to be solid. The supply side appears to be the constraining factor. The inventory of existing homes available for sale continues to hover near historical lows. Unless supply constraints are alleviated, the upswing in demand could reverse the recent deceleration home price growth.
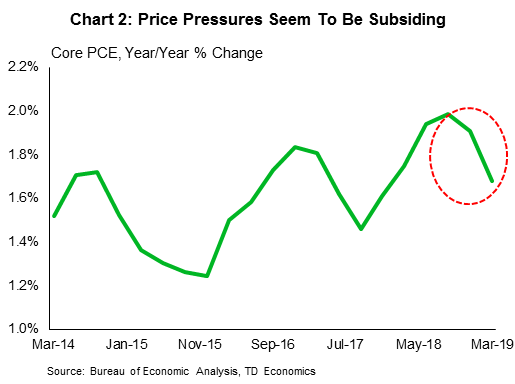
Speaking of prices, PCE inflation data for 19Q1 was released alongside GDP data and came in surprisingly soft. We cannot yet tell which month the weakness was concentrated as only January data are available (February and March data will only be released on Monday). Nevertheless, the weaker reading in Q1 indicates cooling price pressures, reinforcing the Federal Reserve’s position to hold off any interest rate hikes through 2019. Bond yields appear to have dipped lower following the digestion of these details, discounting the surprise in real GDP growth.
Headline inflation is likely to see something of a lift in upcoming months, reflecting the broad-based rebound in oil prices since the end of 2018. Still, the ride may be bumpy. The West Texas Intermediate oil price benchmark hit $65 earlier in the week, before falling on Friday on word that Trump has been upping the pressure on OPEC. This, despite news that the administration will no longer exempt countries from Iran sanctions beginning May 2nd.
Canada – Toward a Lower Neutral Rate, and Not Beyond
A light data week allowed the highly-anticipated Bank of Canada interest rate decision to garner the attention it deserved. A disappointing end to 2018, oil production curtailments, and mixed data at the start of 2019 raised concerns about whether the Canadian economy was heading for recession.
In its April MPR, global growth in 2019 is forecast to have slowed to a 3.2% pace, half a point weaker than last year. This markdown largely reflects elevated global economic uncertainty as broadening trade tensions weigh on activity.
Slower foreign growth is bad for commodities and other goods Canada exports. The Bank of Canada acknowledged this by broadly marking down its Canadian outlook for this year. Canada’s economy has been going through a rough patch since the middle of last year, and the softness should remain through the end of this quarter. First half weakness, combined with little growth to end 2018, motivated the Bank’s downgrade of 2019 GDP growth to 1.2% (from 1.7% in January). The Bank’s first quarter growth was revised down to 0.3% (q/q annualized) from January’s 0.8% forecast, broadly in line with our tracking. Overall, the Bank’s downgraded economic outlook better reflects the reality for both the global and Canadian economies.
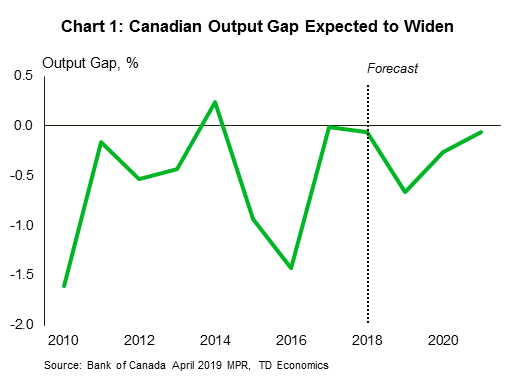
A softer 2019 and rebound to only just above-trend growth next year does little to absorb the slack in the economy that has materialized in the last few quarters (Chart 1). A more negative output gap is consistent with subdued, slightly-below-target inflation. Such an outlook does not call for rate hikes. In fact, this outlook suggests that current stimulative interest rates may need to persist for some time.
The downgrade parade didn’t end with the economic outlook. A reevaluation of potential GDP growth saw the trend running speed of the Canadian economy reduced to 1.7% next year, a tenth of a point lower relative to April 2018’s assumption. Soft business investment and strong labour markets sent the Bank’s view of trend productivity growth about 0.3 ppts lower through 2021.
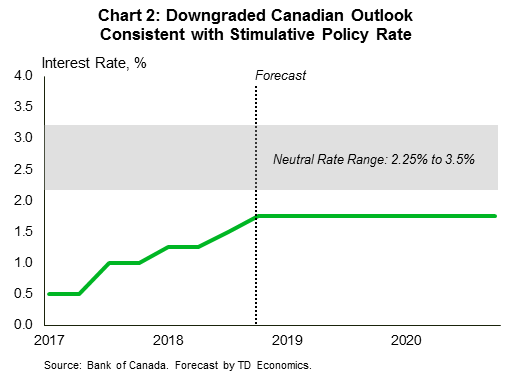
A weaker outlook for domestic trend productivity growth, and the Fed’s March downgrade in its interest rate outlook, motivated the Bank of Canada’s markdown of its nominal neutral rate range by 25bps. Although unobservable and highly uncertain, the neutral rate has been used as an anchoring mechanism for interest rate expectations by the Fed and the Bank of Canada – Governor Poloz has often referred to it as “home”. Moving the lower end of the nominal range down to 2.25% suggests that the policy rate of 1.75, although below neutral, was less stimulative than previously assumed (Chart 2).
Although downgrades were the dominant theme, there is scope for cautious optimism. Domestic service industries remain resilient, and wage growth in most of Canada has improved over the last year. Still, the weaker economic outlook augurs for rates to hold steady through 2020.
U.S.: Upcoming Key Economic Releases
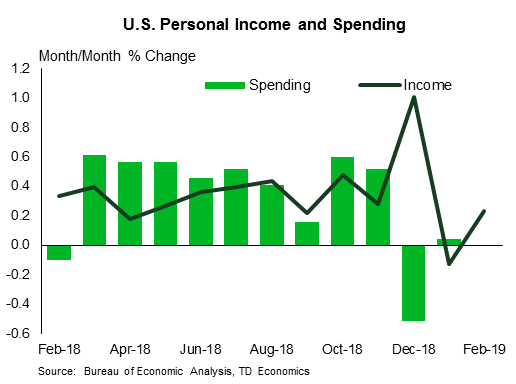
U.S. Personal Income & Spending – March
Release Date: April 29, 2019
Previous: spending: n.a.; income: 0.2%
TD Forecast: spending: 0.8% m/m; income: 0.4%
Consensus: spending: 0.7% m/m; income: 0.4%
We anticipate spending to have closed the quarter on a strong note and advanced at its fastest pace since September 2017 at 0.8% m/m, up from an estimated 0.2% rise in February (also our forecast). In the details, we expect a 0.4% m/m increase in services spending to be the main driver of the March rebound, with a rise in spending on both durables (+2.1%) and nondurables (+1.2%) also helping on the headline. Moreover, we forecast income to rise 0.4% m/m, a stronger pace than that in both Jan and February.
U.S. ISM Manufacturing Sales – April
Release Date: May 1, 2019
Previous: 55.3
TD Forecast: 54.8
Consensus: 55.0
We look for a minor drop in the ISM index as the regional Fed surveys suggest manufacturing activity is holding steady. Indeed, the average of the ISM-adjusted regional surveys remained unchanged at 54.2 in April, despite declines in three out of the four surveys published to date. Based on the regional data, we anticipate downward corrections in the employment and inventories components of the survey and a slight improvement in production. Additionally, new orders likely fell slightly. A recent pick-up in durable goods orders ex-transportation also puts a floor under downside risks for the April ISM print.

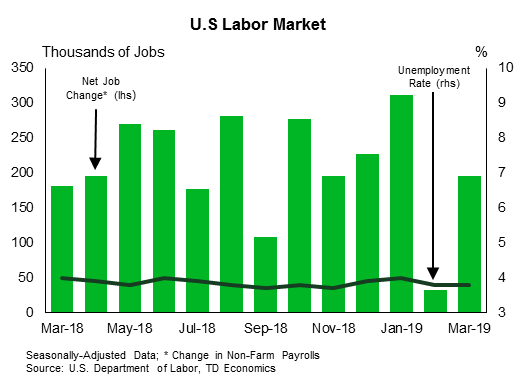
U.S. Employment – April
Release Date: May 3, 2019
Previous: 196k, unemployment rate: 3.8%
TD Forecast: 170k, unemployment rate: 3.7%
Consensus: 188k, unemployment rate: 3.8%
We look for payrolls to trend modestly lower to 170k in April, following the near-200k print in the previous month. In particular, we expect a minor rebound in manufacturing jobs following two disappointing payroll prints. However, this is likely to be more than offset by a deceleration in job creation in the services sector. We do flag risks to the upside on the back of a larger-than-expected recovery in employment in the retail sector after two notable declines in February and March. All in, the household survey should show the unemployment rate ticked down a tenth to 3.7%, while wages are expected to rise 0.2% m/m. This should leave the annual print unchanged at 3.2%. However, if we get a “soft” 0.2% advance, the annual pace in wage growth should slow to 3.1%.
Canada: Upcoming Key Economic Releases
Canadian Real GDP – February
Release Date: April 30, 2019
Previous: 0.3%
TD Forecast: 0.0%
Consensus: 0.0%
TD expects industry-level GDP to remain unchanged in February following the robust 0.3% print last month. Activity data for the month of February was mixed on balance, with retail and manufacturing sales helping to offset one another. However, volumes were disproportionately skewed to the downside due to a large increase in consumer prices. Weather will also have an adverse impact if the sharp pullbacks in residential construction and home sales offer any signal, although this will be partially offset by higher utilities output. Looking to the energy sector, mandated production caps began to roll off by an initial 75bpd in February, leaving the daily maximum production 250k barrels below 2018 levels, down from 325k in January. However, preliminary crude production figures show weaker output during the month, which suggests that transportation bottlenecks continue to impact upstream activity despite less government intervention.


