
HIGHLIGHTS OF THE WEEK
United States
- China responded to the threat of additional U.S. tariffs by halting agricultural purchases and allowing its currency to weaken beyond the psychologically important 7 yuan to the dollar level.
- Central banks around the world responded to the heightened risk posed by the spiraling trade war by proactively cutting policy interest rates.
- The U.S. services sector showed signs of cooling in July as the ISM non-manufacturing index declined to 53.7 from 55.1 the previous month.
Canada
- Trade tensions and global growth concerns continued to weigh on financial markets, with the impacts most notably seen in falling long-term bond yields and oil prices this week.
- Today’s employment report for July was lackluster with a net job loss of 24k and even softer details. One bright spot was a 4.5% surge in wage growth.
- Housing data was constructive, with a 222k housing starts print and regional real estate board data showing healthy home sales prints in July across different metropolitan areas.
U.S. – As U.S. and China Dig in, Central Banks Ease
Heightened U.S.-China trade tensions continue to occupy the limelight. The fallout from last week’s Chinese tariff announcement by President Trump reverberated through the global economy. Last week, the President announced that the U.S. would be imposing a 10% tariff on the remaining Chinese imports previously untouched by tariffs starting September 1st. In response to the tariff threat, China’s currency weakened this week to below the psychologically important level of 7 yuan to the dollar. China also suspended purchases of U.S. agricultural products and has not ruled out placing tariffs on some U.S. imports.
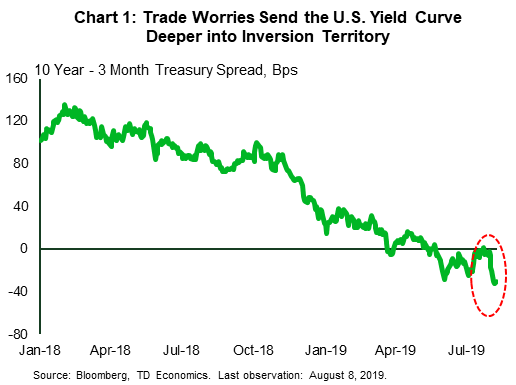
The escalating trade tensions also extended risk-off sentiment in global financial markets. Many Asian currencies plunged in response to the yuan’s weakness, as the region is a central player in global supply chains with complex trade ties to both the U.S. and China. Other emerging market currencies also came under pressure, while the yen, which is seen as a safe-haven asset, appreciated. U.S. equities posted dramatic declines with the Dow registering a drop of more than 2.9% on Monday, its biggest one-day percentage decline since the end of last year. Treasury yields across the curve also tumbled and the yield on the 3-month T-bill exceeded the yield on the 10-year note by the widest margin since April 2007, deepening the yield curve inversion (Chart 1). Markets stabilized later in the week after China’s central bank signaled it wouldn’t let the yuan fall much further.
Following the yuan’s depreciation, the U.S. Treasury Department officially designated China a currency manipulator. The action, though mostly symbolic, requires the U.S. to consult with the IMF to try to eliminate any unfair advantage for China from currency manipulation, and could result in further tariff increases in the future.
Amid the growing trade worries, three central banks in the Asia-Pacific region (India, Thailand, New Zealand and the Philippines) proactively lowered interest rates this week. These actions are consistent with the expectation that the global rate-cutting cycle will intensify in the months ahead as the U.S. and China dig in for an extended battle. Meanwhile, despite the Fed delivering on an insurance rate cut last week, the market continues to expect further cuts in September as odds of a recession lurch higher.
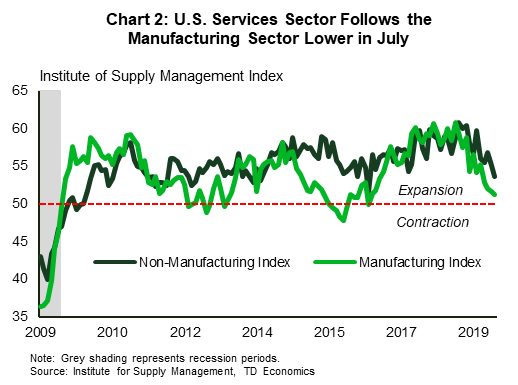
In one of the few data releases of the week, the July ISM non-manufacturing index suggested that the recent economic soft patch is not just limited to U.S. factories. Though the services sector expanded, it did so at the slowest pace in nearly three years. The index eased for the second month in a row to 53.7 in July from 55.1 in June, coming in below expectations (Chart 2). The sub-index tracking business activity dropped sharply to 53.1 from 58.2 in June. New orders also decreased in July. With trade tensions rising and U.S. business activity cooling, the renewed uncertainty will undoubtedly factor into the Fed’s discussions as they attempt to engineer a soft landing for the U.S. economy in these turbulent times.
Canada – Global Conditions Overshadowing Domestic Data
A worsening in global growth expectations continued to manifest in financial markets this week. Yields on Canadian government bonds followed their global peers lower, with the 10-year government bond yield now sitting at 1.20%. Meanwhile, benchmark oil prices fell around 2% on the week after deeper losses were pared back on expectations that Saudi Arabia may reduce production in response to any further slide in prices.
Today’s employment data was the main economic event, with July’s 24k net job loss reaffirming the moderating trend in place since the spring. Job losses were equally divided amongst part-time and full-time, but the 69k slump in private sector hiring was the weakest link in the report. The broad-based industry composition of the losses and the 0.7% drop in hours worked were also discouraging.
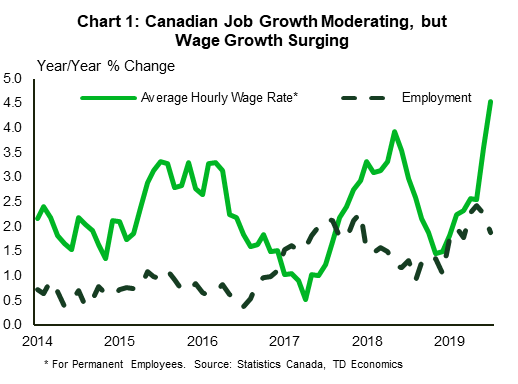
Still, today’s soft report should be placed in the context of outsized strength in late 2018 and early 2019. Indeed, on a year-over-year basis, the economy has added an impressive 353k jobs, with the composition tilted towards full-time hiring (+326k y/y). Importantly, the bright spot in today’s otherwise lackluster report was the surge in average hourly wage growth to 4.5% y/y (Chart 1), the highest in more than a decade, albeit one flattered by weakness this time last year. The tightness narrative is reaffirmed by the still-decent 5.7% unemployment rate and the lagged SEPH data showing a noteworthy spike in wage growth in May.
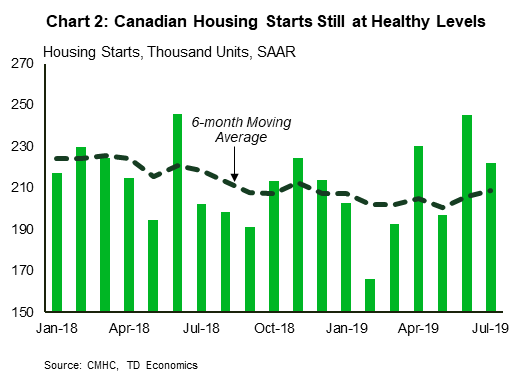
Standing in contrast to moderating job market data is a housing market that has been recovering from weakness seen in the second half of 2018. After what was likely a strong Q2 for residential investment, recent existing home sales data and today’s housing starts release point to a moderating, yet still-solid start for Q3. Data from regional real estate boards in the last two weeks showed healthy home sale activity in July in major metropolitan areas, including Toronto, Montreal, Calgary, and Vancouver. At the same time, today’s above-expectations print (+222k) for July’s housing starts (Chart 2) presents some further upside to residential construction and investment.
The lagged effect of declining borrowing rates, a healthy labour market, and population growth have been feeding into increased housing demand. These drivers should continue to a support the outlook for residential investment for the remainder of the year, although this will likely occur at a moderating pace as affordability conditions continue to provide a partial offset.
All in all, this week’s data releases will likely be brushed off by the Bank of Canada, which we expect to remain on the sidelines. Looking ahead, slowing global growth concerns and escalating trade uncertainty are likely to receive increasing attention given their potential impacts on Canadian trade, manufacturing, and financial conditions. The central bank will weigh this against otherwise healthy domestic conditions and the financial stability implications of lowering rates further.
U.S: Upcoming Key Economic Releases
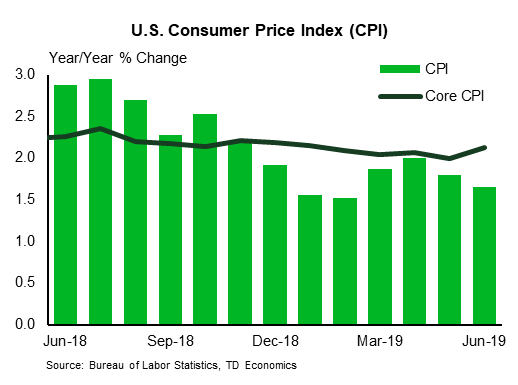
U.S. Consumer Price Index – July
Release Date: August 13, 2019
Previous: 0.1% m/m, core 0.3% m/m
TD Forecast: 0.3% m/m, core 0.2% m/m
Consensus: 0.3% m/m, core 0.2% m/m
We look for headline CPI to pick up two tenths to 1.8% y/y in July on the back of a solid 0.3% monthly print. We expect the non-core segment to be driven by a modest rebound in the energy segment on the back of a 1.5% m/m rise in gasoline prices. Separately, core inflation should remain steady at 2.1% y/y, reflecting a firm 0.2% m/m advance. Core prices should be supported by both a 0.2% m/m increase in core services inflation and new gain in core goods at 0.2%. We anticipate OER to remain largely steady at 0.3% m/m and for the ex-shelter segment to slow marginally on a monthly basis.
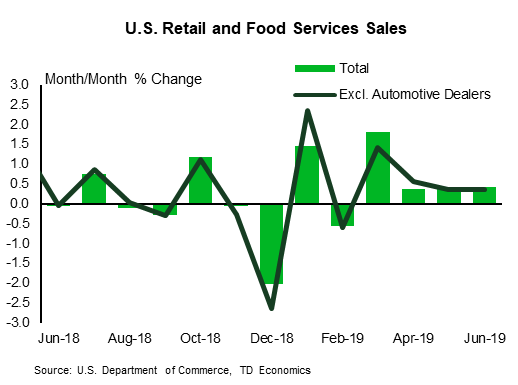
U.S. Retail Sales – July
Release Date: August 9, 2019
Previous: 246k
TD Forecast: 220k
Consensus: N/A
We expect another firm increase in sales in the key control group (+0.4% m/m) to be the main driver behind a 0.3% gain in headline retail sales, as consumer fundamentals remain sound (healthy labor market, steady real wages and high confidence levels). A firm gain in core sales should more than offset a projected decline in July auto sales. We also expect a rebound in sales at gasoline stations, on the back of a pick-up in gasoline prices, to support the headline figure.


