
U.S. Highlights
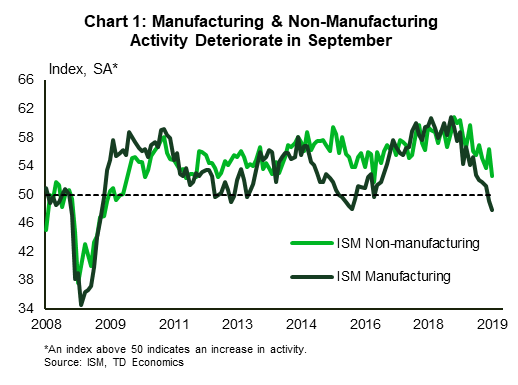
- October began on a sour note. A deepening contraction in the manufacturing ISM confirmed that the global manufacturing slump has washed up on American shores, and the sectoral weakness may be spreading into other industries.
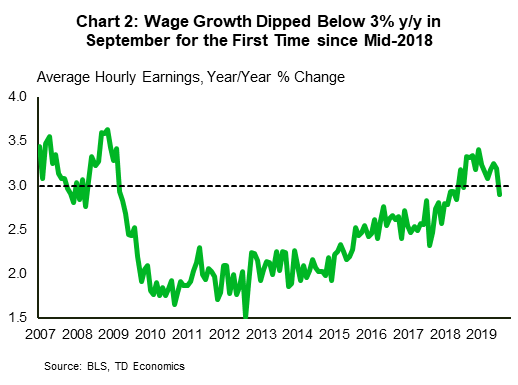
- The jobs report offered some encouragement, even as the details were not entirely positive. Payrolls rose a decent 136k and the unemployment rate fell to a 50-year low at 3.5%. Still, wage growth cooled, dipping below 3% y/y.
- Trade developments remained top of mind. After getting the okay from the WTO, the U.S. plans to apply tariffs on $7.5 bn of EU goods in mid-October. This is around the same time it plans to increase the tariff rate on $250 bn of Chinese goods. This increases the chances of tit-for-tat measures, which would expedite the slowdown in global growth.
Canadian Highlights
- A run of gloomy U.S. data sent chills through financial markets. Canadian markets were caught in the downdraft, with equities, bond yields and the dollar all lower in the week.
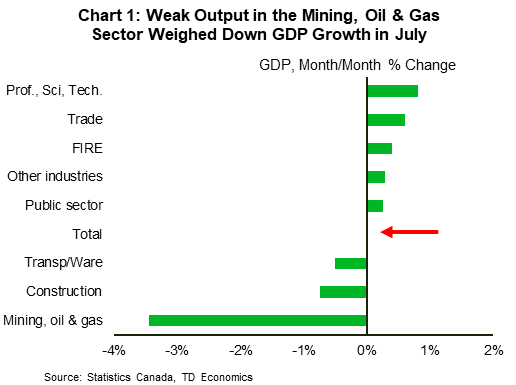
- It was another week of mixed data. July GDP growth was flat, though dragged down by temporary factors. Toronto and Vancouver home sales were positive, on balance and international trade data did little to alter our Q3 growth tracking.
- Although domestic data is generally meeting expectations, weaker external conditions could force the Bank’s hand.
U.S. – Mixed Signals on Strength of Expansion
The mood at the start of October was predominantly downbeat, with a weak manufacturing report setting the tone early on. The ISM manufacturing index fell again in September, diving deeper into contractionary territory (Chart 1). The details of the report were equally disappointing, with weakness broad-based across the subcomponents. Strikingly, new export orders fell to the lowest level since early 2009. The recent deterioration is a clear sign that the global manufacturing slump has now firmly washed up on American shores. The other, larger side of the U.S. economy also showed signs of fatigue. The ISM non-manufacturing index, disappointed expectations, retreating by nearly 4 points to 52.6 in September. While the index remains in expansionary territory, its downward trajectory is an indication that the manufacturing slump is seeping into other sectors.
The consumer remains the main bright spot for the American economy. Keeping with that theme, U.S. vehicle sales continued their momentum with yet another strong reading in September (+1.1% to 17.2 million). On the surface, this bodes well for consumer spending in the third quarter. That said, given that the monthly gain was driven by fleet volume, we caution against reading too much into it.
The jobs report however, offered additional encouragement on the consumption narrative. Payrolls rose by 136k in September – a decent print, but one that highlights an expected slowing trajectory in hiring at this point in the cycle. In addition, the tally for payrolls in the two months prior was bumped up by 45k. Meanwhile, the unemployment rate fell to a 50-year low of 3.5%. Given that the participation rate held steady, the drop in the jobless rate appears to be organically-driven, as workers moved out of unemployment and into jobs. One thorn in the side of this report, however, was a cooling of wage growth to 2.9% y/y – a factor that does not bode well for income growth (Chart 2).
Aside from data, there were plenty of other salient developments this week, with trade remaining top of mind. The WTO gave the U.S. the green light to impose tariffs on $7.5 bn worth of EU goods, with the ruling pertaining to a long-running dispute over illegal subsidies provided to Airbus (the EU is pursuing a similar case against Boeing). The U.S. is wasting no time, announcing plans to apply tariffs between 10% and 25% on October 18th (see list of products). This would come at a particularly bad time for the EU, which is on the brink of recession (see here). The issue is not so much the $7.5 bn of goods impacted, but rather what might come after.
A flare up in tensions may get the ball rolling for more tit-for-tat measures. The EU’s retaliation could push the U.S. to levy auto tariffs. A decision on the latter is already pending for mid-November. What’s more, in mid-October, the U.S. is set to raise tariffs on $250 bn of Chinese goods. Increased protectionist measures with any or both of its two most important goods trading partners, will expedite the slowdown in global growth. In this vein, we expect the Fed to continue with its cautionary stance by cutting rates once more this year.
Canada – Data a Mixed Bag as External Conditions Weaken
There was an air of tension gripping global financial markets this week, sparked by a run of downbeat U.S. data warning that a more substantial slowdown could befall the world’s largest economy. Canadian markets were caught in the downdraft, with the TSX dropping, bond yields falling and the dollar heading lower. Worries about global growth prospects also weighed on oil prices, with the WTI price down about 6% as of writing.
While the mood was dour in financial markets, this week’s flow of domestic economic data was somewhat more mixed. The July GDP report was the marquee release on the calendar, coming with both positives and negatives. On the negative side, growth disappointed already modest expectations in July (Chart 1), as only 12 of 21 industries increased their output. On the brighter side, the services sector continues to grow, with output up 2.5% from year-ago levels. What’s more, absent the temporary impact of an oil facility shutdown, growth would have looked more like June’s decent outturn. Overall, July’s flat monthly print points to third quarter growth slowing markedly from Q2’s 3.7% annualized surge, with our tracking suggesting an increase slightly north of 1%. But it is important to remember that we’re only talking about July. With global weakness seemingly intensifying in September, we’ll have to wait for some time to get a thorough read on the feed through to Canadian GDP growth.
This week also marked the release of September housing market data from some local real estate boards. Here too, the picture was mixed. On the plus side, we estimate that (seasonally adjusted) sales posted a strong gain in Vancouver, as activity continues to recover from the extreme lows observed earlier in the year. In contrast, sales were effectively flat in Toronto. On balance, these performances met our expectations, doing nothing to alter our view that so long as the fundamentals remain intact, housing will contribute positively to growth moving forward.
Finally, the week was capped off by international merchandise trade data for August. The report offered some evidence that weakness in economies outside of the U.S. is impacting Canada, with nominal exports to these countries down 1.9% (m/m). Taking out price movements, volumes were down a modest 0.2%, weighed on by energy exports and shutdowns in the auto sector. On the flipside, import volumes advanced 1.2% during the month on stronger imports of energy products and gold. So far, trade is shaping up to deliver a much more muted growth impact in the third quarter (Chart 2).
Events this week reinforced the balancing act that the Bank of Canada is dealing with. On the one hand, domestic data is performing broadly in-line with expectations. On the other hand, the external backdrop is rapidly getting worse (consistent with modest export volumes in August) which is heightening the risk of contagion into Canada. We suspect that the latter will ultimately force the Bank’s hand, leading them to finally join their global peers in taking the overnight rate lower later this year..

U.S: Upcoming Key Economic Releases
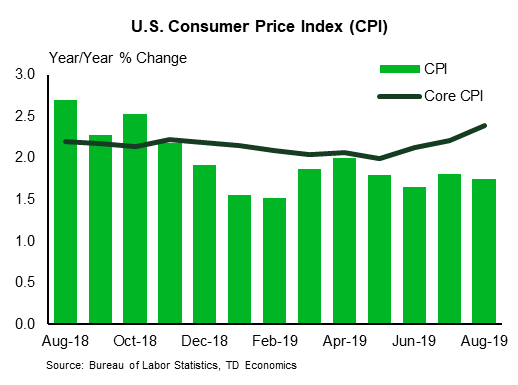
U.S. Consumer Price Index–September
Release Date: October 10, 2019
Previous: 0.1% m/m, 1.7% y/y; core 0.3% m/m
TD Forecast: 0.1% m/m, 1.8% y/y; core 0.2% m/m
Consensus: 0.1% m/m, 1.8% y/y; core 0.2% m/m
We look for headline CPI to tick up a tenth to 1.8% y/y in September (0.1% m/m) despite another monthly decline in energy prices. Conversely, core inflation should stay unchanged at 2.4% y/y, reflecting a firm 0.2% m/m advance — though slightly softer than in Jun-Aug reflecting more subdued core goods inflation. That said, a steady 0.2% m/m gain in services should support core prices in September. We anticipate owners’ equivalent rent to advance at 0.3% m/m, up from two consecutive 0.2% monthly gains, and for the ex-shelter segment to slow modestly on a monthly basis.
Canada: Upcoming Key Economic Releases
Canadian Employment– September
Release Date: October 11, 2019
Previous: 81k, unemployment rate: 5.7%
TD Forecast: 5k, unemployment rate: 5.8%
Consensus: NA
The Canadian labour market has turned heads with its remarkable performance over the last twelve months, adding 470k jobs over that period. But, we look for a more modest performance with the creation of 5k jobs in September which is well below the current 6 month trend of 30k. Our forecast assumes mean reversion following last month’s 81k increase which stands as the second highest since 2012, trailing only the 106k print from April. Details should prove more downbeat with a pullback in private employment and the unemployment rate projected to drift higher to 5.8% following last month’s surge in labour force participation, which helped to hold the unemployment rate unchanged. Wage growth should be the one bright spot, with average hourly earnings forecast to hold at 3.8% y/y as recent gains have helped sap even more slack from the labour market.

Canadian Housing Starts- September
Release Date: October 8, 2019
Previous: 226k
TD Forecast: 230k
Consensus: NA
TD looks for housing starts to edge higher to a 230k pace in September on a rebound in multi-family construction. Multi-unit starts have fallen by 13% over the last two months and, while we do not anticipate a recovery to June’s record pace, tighter conditions in the resale market along with lower financing rates support a pickup in September. Looking beyond the multi-unit component, single family starts are expected to give back a portion of last month’s 13% gain. While stronger resales of detached homes should help support construction in this segment of the market, the 40% rebound from February lows greatly exceeds a 10% increase in permit issuance since December, suggesting a high bar for further gains.


