Asian stocks were mixed as the markets continued to focus on trade. The weakness came after Donald Trump warned that he would push tariffs of Chinese goods higher if the two countries failed to make a deal. The two countries agreed to a “phase one” trade deal in October but there have been some disagreements on how to proceed. Reports show that China has insisted that the US must lower the existing tariffs in exchange of more goods purchases. China has also pledged that it would end forced technology transfers. In China, Shanghai and Hang Seng declined by 8.15 points and 186 points respectively.
The US dollar index was unchanged in the Asian session as traders reflected on earnings from US retailers. Home Depot and Kohl’s released their third quarter earnings that showed weak growth. As a result, their stocks declined by 5.44% and 19% respectively. Results from Home Depot and Kohl’s come as companies like Walmart and TJX soar. This is an indication that customers are looking for discounts. Consumer spending, which is the biggest component of the US economy, has been helped by low unemployment rates, rising wages and low gasoline prices.
The Japanese yen wobbled against the USD after the country released trade numbers for October. Exports declined by -9.2%. This was a lower decline than the previous -5.2%. It was also lower than the -7.6% that the market was expecting. Imports dropped by -14.8% in October. This was a sharper decline than September’s -1.5% decline. The weakness in exports and imports was at the lowest level since 2016. The trade surplus came in at $17.3 billion. Japan’s economy is going through a difficult time as global growth slows and the country continues its trade war with South Korea.
Later today, the market will receive PPI data from Germany, CPI data from South Africa and Canada, and crude oil inventories data.
EUR/USD
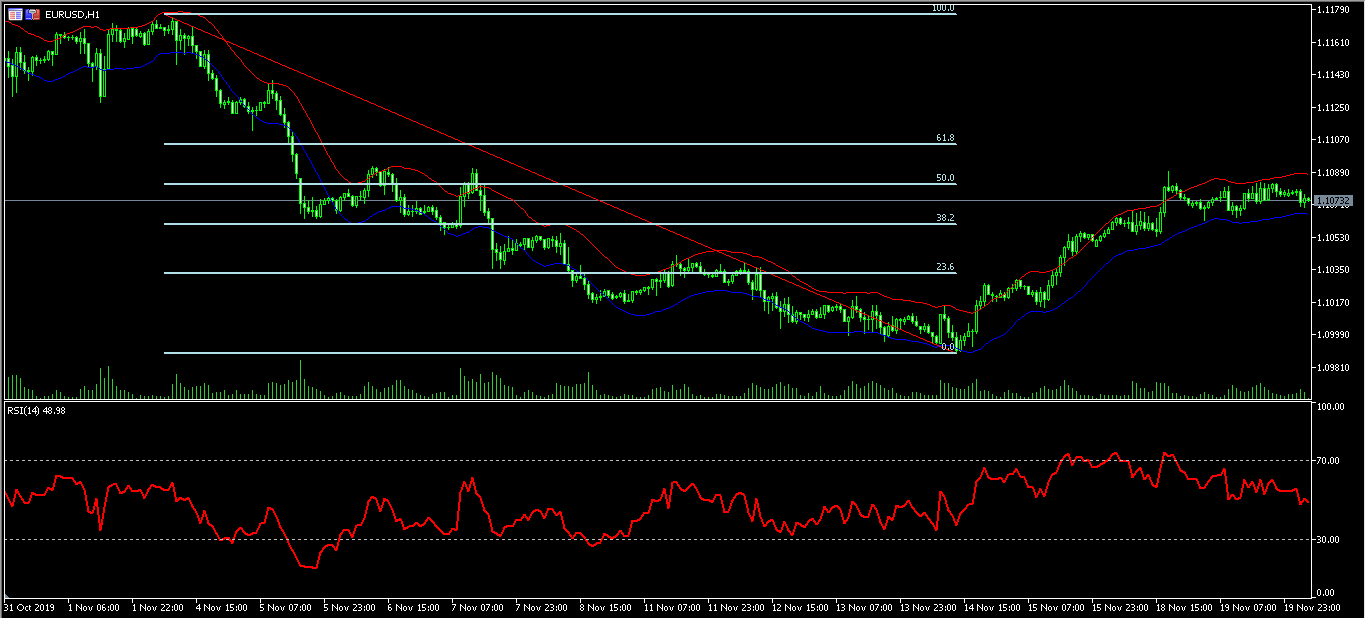
The EUR/USD pair has found strong resistance this week, ending the strong upward trend that started last week. The pair is trading at 1.1073, which is slightly below last week’s high of 1.1090. This price is between the 50% and 38.2% Fibonacci Retracement level. It is also between the two bands of the Envelopes indicator. The RSI has been on a steady decline. The pair may remain at the current levels because there is no major scheduled economic data today.
USD/JPY
The USD/JPY pair was relatively unchanged at 108.50 after weak trade numbers. The price is between the lower and upper Bollinger Bands. It is also along the 38.2% Fibonacci Retracement level and is on a strong downward trend. The RSI has been unchanged. The pair may continue with the trend and test the important low of 108.00.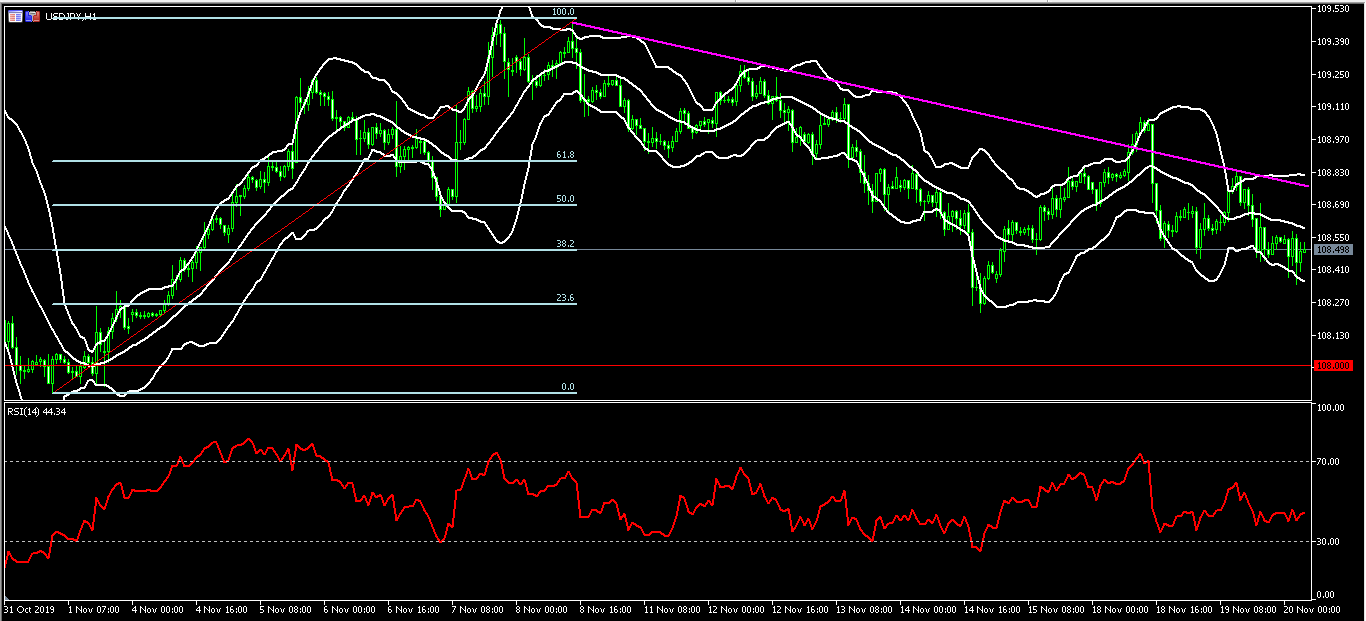
XBR/USD
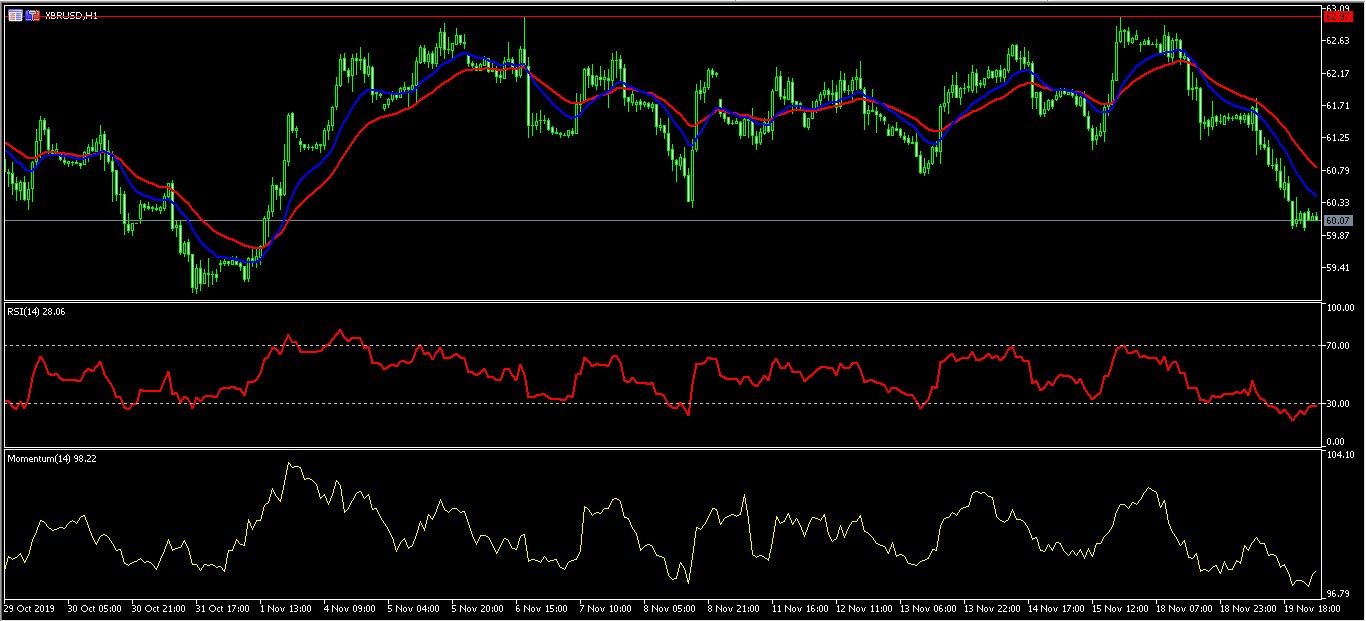
The XBR/USD pair declined as the markets focused on the ongoing trade war, demand and supply. The XBR/USD pair has dropped from Friday’s high of 62.97 to a low of 59.93. On the hourly chart, the price is below the 14-day and 28-day moving averages. The RSI has moved to below the oversold level of 30. The same is true with the momentum indicator, which has been moving lower. The pair may continue dropping ahead of inventories data.