
U.S. Review
Steady for Now
- Minutes from the October FOMC meeting indicated the Fed is content to remain on the sidelines for the rest of this year as the looser financial conditions resulting from rate cuts at three consecutive meetings feed through to the economy.
- Mixed reports this week about the prospects of a Phase I trade deal took some of the steam out of the recent market rally. We continue to expect a stalemate, while recognizing the significant downside risks of a deterioration in trade negotiations.
- Housing starts and existing home sales both rose solidly in October as lower mortgage rates boost residential activity.
Steady for Now
Minutes from the October FOMC meeting indicated the Fed is content to remain on the sidelines for the rest of this year as the looser financial conditions resulting from rate cuts at three consecutive meetings feed through to the economy.
Committee members judged the current stance of monetary policy as “appropriate”, while recognizing that the “risk that a global growth slowdown would further weigh on the domestic economy remained prominent.” The 75 bps of easing has not been unanimous, however, as some members viewed the latest rate cut as a “close call.” Moreover, the bar for further easing has been set fairly high—the Fed would need to see a “material” deterioration in the economic outlook to ease policy further.
The outlook, at least in the eyes of financial markets, did dim slightly this week after reports that the Phase I trade deal may not be reached this year. Our outlook has not changed, however, as we have stuck to our assumption that additional tariffs will go into effect December 15. Equity markets have been keener to buy into rumors of a deal, and gave back some gains this week after reaching an all-time high on Monday. Financial conditions remain supportive, however, and markets do not expect another Fed rate cut until the second half of next year. But with the status of trade negotiations as uncertain as ever, we still see scope for a cut in the first quarter. With business fixed investment likely to remain weak, there is a lot riding on the performance of consumer spending heading into year-end. Yet even if the consumer sector hangs on— which we expect it will—we recognize the same downside risks as the Fed, and suspect if it were to cut again it would do so sooner rather than later, particularly with the election approaching.
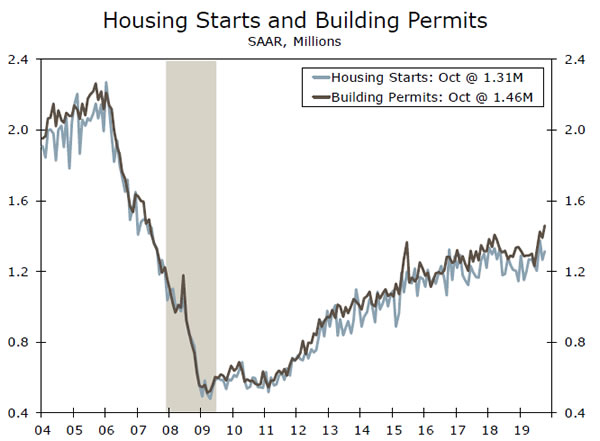
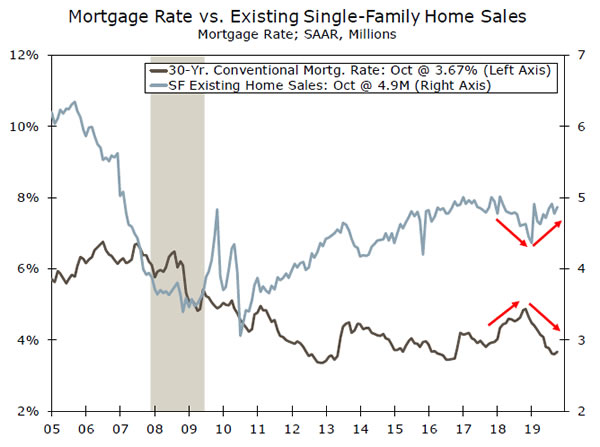
The FOMC also noted that “data on construction and sales suggested the decline in mortgage rates since late 2018 was starting to show through to housing activity.” We concur. Housing starts rose 3.8% in October, while permits surged 5.0% to the strongest pace since May 2007. Some of the strength was due to a jump in the volatile multifamily segment, but single-family permits, which are less subject to statistical noise and weatherrelated volatility, have now risen for six consecutive months, pointing clearly to upward momentum in residential construction. Existing home sales also rose nicely in October, climbing 1.9% to a 5.46 million-unit pace. Inventories are running very tight again, however, particularly for entry-level homes where demand is strongest. This in turn has pushed price appreciation higher again—the median resale price rose 6.2% over the year, the strongest pace since July 2017. After a solid contribution in Q3, it is already looking like housing will again boost GDP growth in Q4, after a year and a half of drag.
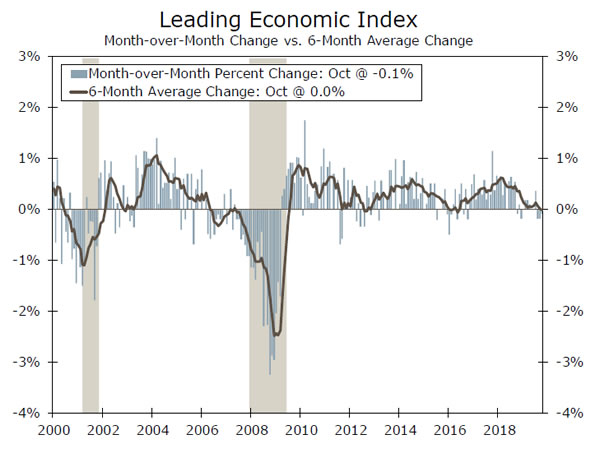
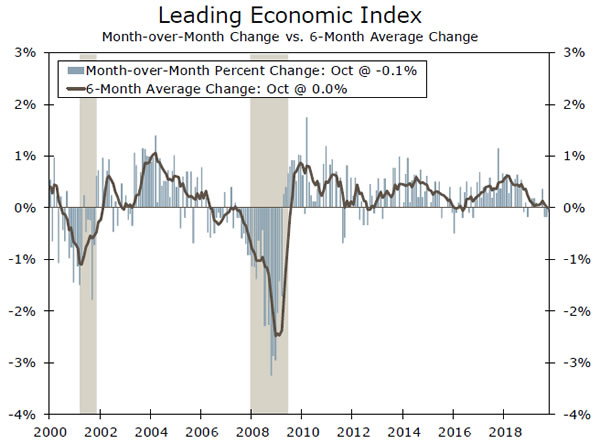
The next few weeks will be instructive as Q4 data begin to flow in. The Leading Economic Index (LEI) fell in October for the third straight month—the first time that has happened since 2009. With trade uncertainty unlikely to be resolved soon, impeachment proceedings ongoing and the memory of last year’s fourth quarter fresh in mind, it will be important to closely monitor incoming economic data for signs of a break in either direction.
U.S. Outlook
Consumer Confidence • Tuesday
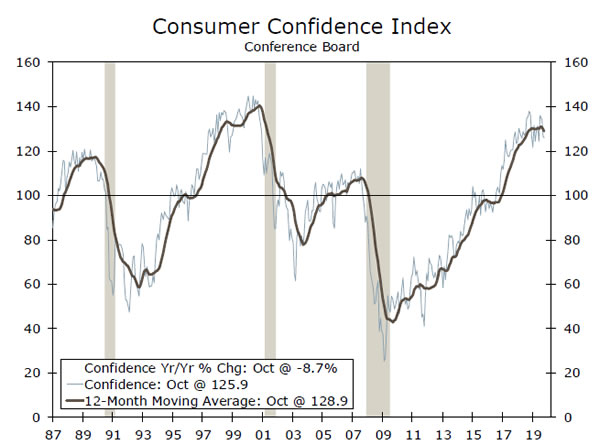
In October 2018 Consumer Confidence rose to 137.9, marking the highest level of confidence since the exuberance at the tail end of the dot-com euphoria in 2000. In that earlier era, the bottom fell out under confidence when the tech bubble burst and recession followed. This time has been different. While confidence has come off the boil since its peak last year, it has remained range-bound between 121 and 138 over the past 12 months.
In a typical cycle, major drivers of confidence are the unemployment rate, the stock market and gas prices. The stock market remains near all-time highs, unemployment is near a 50-year low and gas prices have been trending lower since May. It stands to reason we will see an improvement in confidence in October, but with ongoing concerns about the trade war, we’re not banking on a return to last year’s record highs.
Previous: 125.69 Wells Fargo: 131.3 Consensus: 126.5
Durable Goods Orders • Wednesday
Wednesday will be a busy day next week, as both the Commerce and Labor Departments hustle to get a bunch of indicators out the door before the U.S. Thanksgiving holiday on Thursday.
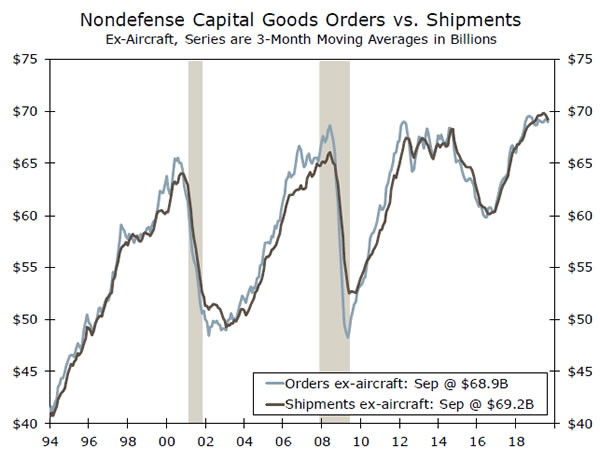
Durable goods for October hit the wire at 8:30 AM along with the second look at third quarter GDP figures. The nearby chart plots the level of core capital goods and shipments. You can see that both series have plateaued over the past year amid the trade war. We are looking for a second consecutive monthly decline in durable goods orders, but after backing out the volatile transport sector, we expect a slight rebound after a drop last month.
Jobless claims will come out on Wednesday (a day early) next week. We’ve seen an uptick the past couple weeks, so we’ll be closely watching this leading indicator to see if businesses are actually cutting back or if these past two weeks are just a blip.
Previous: -1.2% Wells Fargo: -0.7% Consensus: -0.5% (Month-over-Month)
Personal Income & Spending • Wednesday
After the batch of 8:30 AM indicators have been digested on Wednesday, the pre-Thanksgiving parade continues at 10 AM with the release of personal income and spending figures for October.
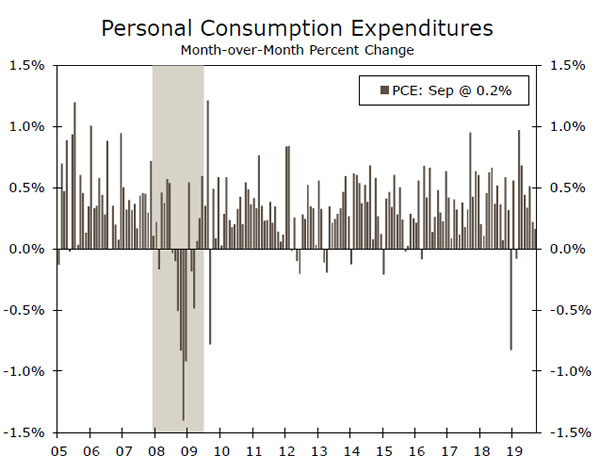
Similar to the flattening trend seen in consumer confidence, spending is still growing, but at a slower rate. Retail sales for October have already been released, and retailers reported a 0.3% increase, though some of that improvement was attributable to rising prices. Still, a number of retailers have beat expectations in recent corporate earnings reports. We are looking for an above-consensus gain in spending, though the real (inflation-adjusted) spending number will be smaller.
Fed watchers will pay attention to the core PCE deflator number, which we expect to see come in at 1.4% year-over-year. If realized, this would likely not have a meaningful impact on Fed expectations. We think the FOMC will sit tight and leave rates unchanged at its December 11 meeting.
Previous: 0.2% Wells Fargo: 0.4% Consensus: 0.3% (Month-over-Month PCE)
Global Review
USMCA Getting Close?
- Encouragingly, the outlook for USMCA has improved of late, with key Democratic leaders in the House of Representatives signaling that they could sign off on the trade pact soon, perhaps even by year-end, though we doubt it could be voted on that quickly.
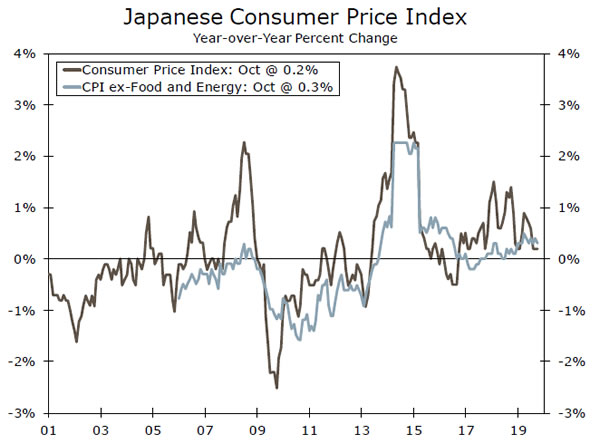
- Core inflation in Japan remained tepid in October, at just 0.3% year-over-year, despite an increase in the country’s VAT. The implementation of free preschool education helped offset the VAT’s upward pressure on the consumer price index.
- As the data continue to come out, it appears increasingly likely the fourth quarter will be yet another quarter of weak-butpositive economic growth in the U.K. and the Eurozone.
USMCA Getting Close?
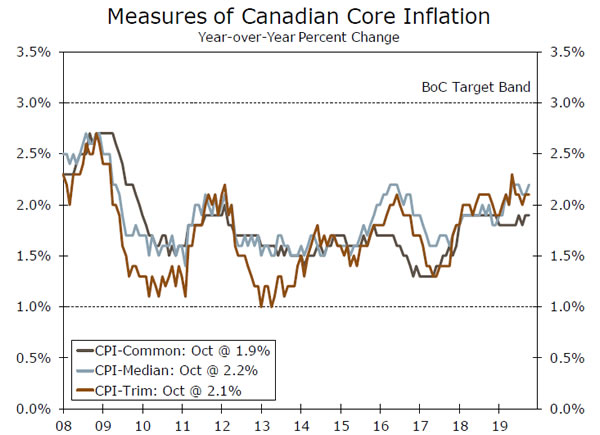
Canadian inflation held steady this week, with headline CPI and two of the three core measures tracked by the Bank of Canada (BoC) all holding steady relative to last month on a year-over-year basis. Inflation in Canada has held firm in the middle of the BoC’s target band of 1%-3%, which has in part explained why the central bank has kept policy rates on hold this year, unlike other developed market central banks like the Fed and ECB. That said, economic growth has been wobbly, a topic we cover on the next page, and trade uncertainty remains a challenge for Canada.
Encouragingly, the outlook for USMCA has improved of late, with key Democratic leaders in the U.S. House of Representatives signaling that they could sign off on the trade pact soon, perhaps even by year-end, though we doubt it could be voted on that quickly. The Trump administration can send the legislative text to Congress at any time, but once it does, it will trigger a clock that requires it to be voted on in the House and Senate within 90 legislative days. Thus, the Trump administration appears to be waiting to start the clock until it has assurances from Democratic leaders that the measure will pass the Democratic-led House. Once a deal between the two parties is struck, the actual vote may not need the full 90-day allotment. Should the USMCA become law, the economic and financial market impact would likely be larger for Canada and Mexico than it would be for the United States, in our view.
Core inflation in Japan remained tepid in October, at just 0.3% year-over-year. While low inflation is nothing new in Japan, some had expected a bigger jump given that Japan increased its value-added tax (VAT) to 10% from 8% on October 1. When Japan increased its VAT to 8% from 5% in 2014, inflation skyrocketed (albeit temporarily) to its highest level in decades (top chart). Why was there not a similar move this time? The tax increase was smaller this time obviously, but that still led to some large increases in prices; furniture and household utensil prices rose 2.5% over the month, for example, and clothes and footwear prices rose 1.6%. The VAT was not the only policy change taking effect on October 1, as free preschool education was also implemented last month in Japan. Accordingly, the education component of the Japanese CPI fell 8.4%, offsetting much of the upward boost from the VAT.
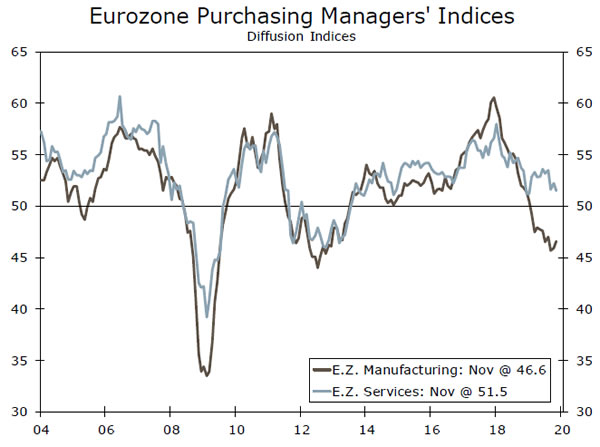
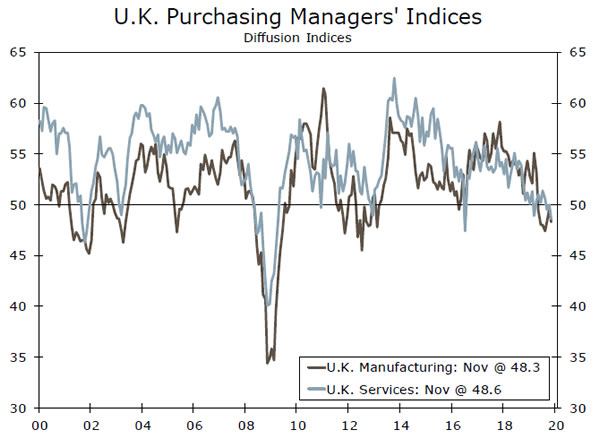
Preliminary data on the purchasing managers’ indices for the Eurozone and the U.K. were released this morning and showed tepid growth environments remained in place in November. In the Eurozone, the weaker manufacturing sector showed some mild improvement, as the manufacturing PMI rose to 46.6 from 45.9 in October (middle chart). The PMI for the larger service sector, however, dipped to 51.5, the lowest reading since January. The story was not much different in the U.K.; the manufacturing PMI rose but remained below 50, while the services component fell to its lowest level since July 2016, when the Brexit vote occurred (bottom chart). As the data continue to come out, it appears increasingly likely the fourth quarter will be yet another quarter of weak-but-positive economic growth in the U.K. and the Eurozone.
Global Outlook
Eurozone CPI • Friday
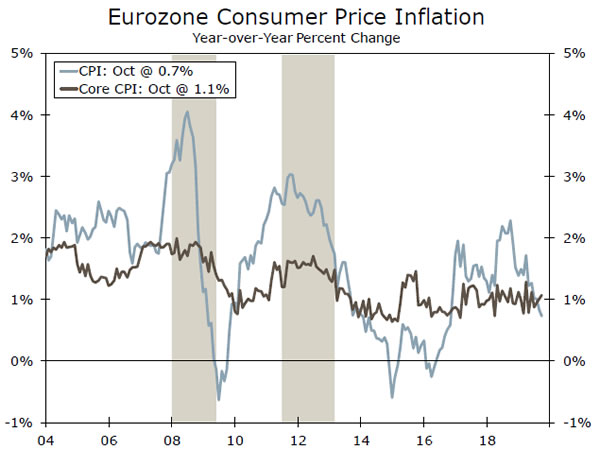
Core inflation in the Eurozone continues to muddle along near 1%. On the one hand, it is encouraging that core CPI inflation has been more or less flat over the past year given the economic weakness across the Eurozone over that period. But, with both headline and core inflation still well shy of the European Central Bank’s 2% target, the central bank likely remains far from reversing the extraordinarily easy monetary policy that currently prevails in the Eurozone. In fact, we expect another 10 bps cut from the ECB in December, as new President Christine Lagarde signals her willingness to do whatever it takes to revive growth and inflation across Europe.
In our view, a large scale fiscal stimulus, led by Germany, would do more to revive the European economy than additional monetary policy easing at this point in time. Thus far, only modest fiscal easing has been forthcoming in most Eurozone countries.
Previous: 0.7% Consensus: 0.9% (Year-over-Year)
India Q3 GDP • Friday
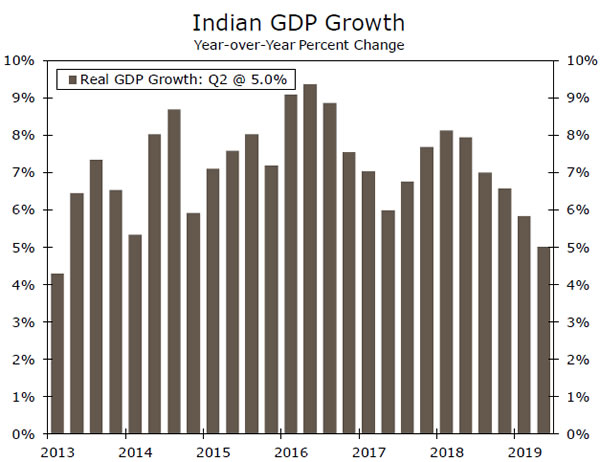
The Indian economy, usually one of the world’s fastest growing, has not been immune to the global growth slowdown. Real GDP growth in the second quarter was just 5.0% year-over-year, the slowest pace since Q1-2013. Private domestic demand was relatively weak, with consumption and gross fixed capital formation rising 3.1% and 4.0% year-over-year, respectively. Indian policymakers at both the fiscal and monetary levels have taken steps to stimulate the economy. The Reserve Bank of India has cut its main policy rates 110 bps this year, while Prime Minister Modi enacted corporate tax cuts back in September. On the spending side, fiscal policy is already fairly stimulative; government final consumption rose 8.8% yearover- year in Q2-2019.
While growth seems unlikely to improve much in Q3-2019, we do expect more central bank easing in the coming quarters, and anticipate that the Indian economy will accelerate in 2020.
Previous: 5.0% Wells Fargo: 5.2% Consensus: 4.6% (Year-over-Year)
Canada Q3 GDP • Friday
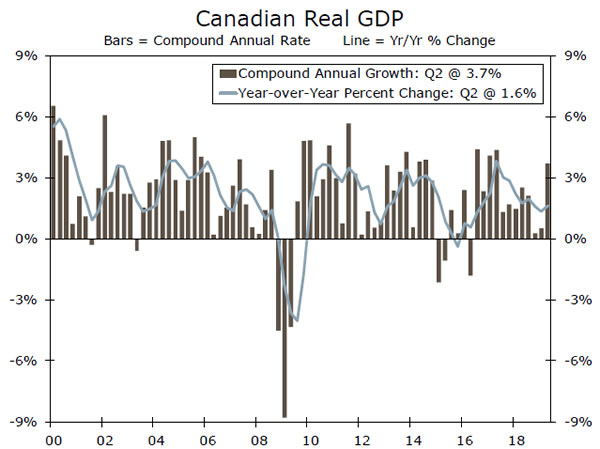
Economic growth in Canada was a robust 3.7% on a quarter-overquarter annualized basis in Q2, but the strength was somewhat misleading. Exports accounted for essentially all of the gain, as some modest growth in consumption was offset by a contraction in gross fixed capital formation. At its October 30 meeting, the Bank of Canada said that it expected growth to slow in the second half of the year to a rate below potential, blaming uncertainty associated with trade conflicts and continuing adjustment in the energy sector. Encouragingly, the BoC also noted that “housing activity is picking up in most markets.” Housing is an ever-present threat given Canada’s hot real estate market and high household debt levels in this cycle. Of late, housing starts and resales have been particularly robust in Quebec and Ontario, where labor markets have been strong. We expect economic growth to be around 1.5%-2.0% over the next few quarters in Canada.
Previous: 3.7% Wells Fargo: 1.3% (Quarter-over-Quarter, Annualized)
Point of View
Interest Rate Watch
Lower—Maybe, Negative—Unlikely
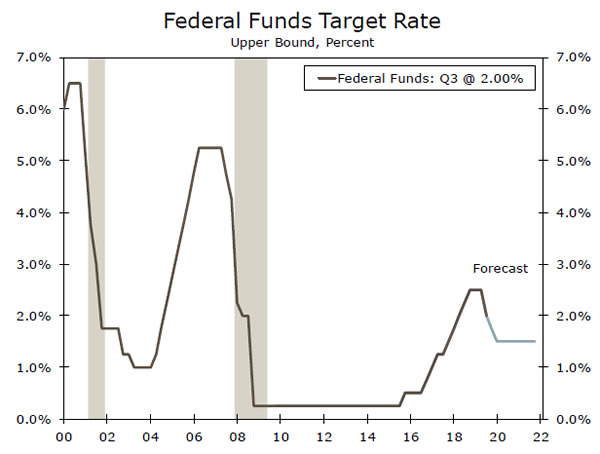
Minutes released this week for the October FOMC meeting underscored the notion that officials are fairly comfortable with the current stance of policy and see no imminent need to adjust rates after 75 bps of easing since July. Despite some very public pressure from President Trump, there appears to be a high bar for further rate cuts, let alone a foray into negative rates, in the near future.
It was clear that the additional cut in October had less support than the prior two rate reductions. While risks to the outlook “remained elevated,” they had diminished to an extent. At the same time, the stilldecent performance of growth, the lagged effect of prior easing and concerns about financial imbalances led some members to favor leaving policy unchanged. These factors also contributed to most participants thinking policy is now “well calibrated” to the current environment and appearing comfortable with keeping policy on hold unless the outlook changes materially.
As part of the Federal Reserve’s ongoing review of its policy strategy and toolkit, participants discussed the potential benefits and risks of negative rates in the United States. The minutes showed little appetite for the tool at the moment.
Concerns about distortions to the U.S. financial system and lending to businesses and households led all participants to consider negative rates an unattractive policy tool at present. Fed officials did not fully rule out their use in the future, however. After all, they have provided some marginal accommodation in other countries, as Fed staff noted at the meeting.
But as we have discussed before, negative rates look likely to be employed last among the Fed’s potential tools come the next downturn. While not without their own faults or risks, officials viewed the use of forward guidance and asset purchases as having worked favorably since the financial crisis. When it comes to new tools, capping rates on Treasury yields through asset purchases, known as yield-curve control, looked to have garnered more interest and may be tried before pushing the fed funds rate into negative territory.
Credit Market Insights
“Financial Sector Appears Resilient”
In its latest Financial Stability report, the Federal Reserve concluded there were no immediate threats stemming from the U.S. financial system and that overall risks were fairly moderate. Vulnerabilities were said to have been little changed since the Fed’s last assessment in May, and the largest risks were cited to be coming from abroad, such as Brexit and other geopolitical concerns.
Elevated asset prices were identified as a vulnerability, particularly for commercial real estate and farmland. But after accounting for low Treasury yields, risk appetite was considered in line with historical norms. In terms of debt, household borrowing has grown roughly in line with GDP and is considered at only a modest level relative to income. But, record high levels of corporate debt were identified as a growing concern, particularly the runup at the lowest end of the credit spectrum. We have shared in the Fed’s concern about corporate debt, and direct interested readers to Topic of the Week for more detail.
Overall, leverage in the financial sector was considered to be low with the largest U.S. banks strongly capitalized. Capital is expected to decrease somewhat, as some banks have announced plans to distribute capital to shareholders. Banks remain well positioned to lend, and credit quality of bank loans remains strong. Funding risk also continues to be modest. U.S. financial conditions remain OK, with no areas identified as imminent threats to the stability of the economy.
Topic of the Week
Is Corporate Debt About to Rear Its Ugly Head?
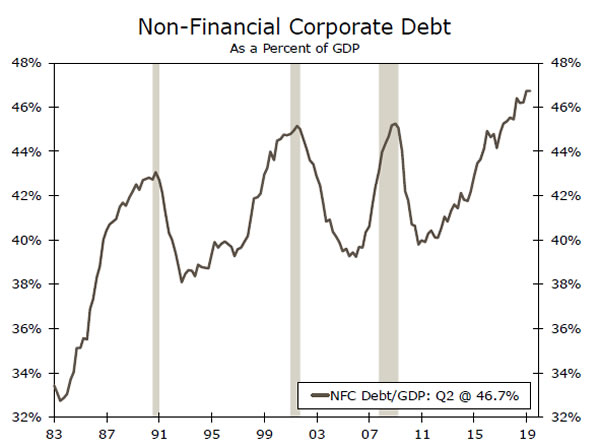
The buildup in debt among companies in the nonfinancial corporate (NFC) sector has continued to prompt concerns that these firms may threaten the sustainability of the current expansion. At 46.7% of GDP, non-financial corporate debt stands at its highest level on record. While increasing leverage does permit some cause for concern, large amounts of debt alone are unlikely to tip the economy into recession. That being said, in the next downturn, the burden of high debt levels could stymie the subsequent recovery.
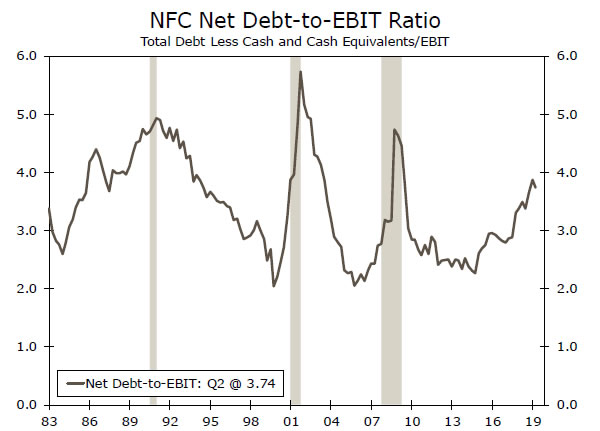
Eye-popping debt levels can often grab headlines, like the $3.6 trillion in debt added by the NFC sector over the last decade. It is companies’ ability to service this debt, however, which is arguably more important. In a recent special report, we provided an update to our Corporate Financial Health Index, which incorporates eight metrics of financial health for the NFC sector. The index has continued to move lower since we first developed it a year ago, but looking under the hood one can see why the alarm bells are not sounding quite yet. In general, companies still appear able to afford their debt load. The interest coverage ratio, which measures how much cash flow NFCs produce to service their debts, has worsened but remains at a decent level. Furthermore, it seems unlikely that it will deteriorate substantially in the near future. For this to occur, one would need to see a reversal of the Fed’s recent monetary easing, leading to higher interest rates, or a meaningful deterioration in corporate earnings, which seems unlikely barring a broader economic downturn. Beyond earnings, many companies also have cash on hand that they can use to cover their borrowing costs. In fact, liquid assets have soared to a record $4.5 trillion over the past decade. While this has put companies in a better position than they would be otherwise, it has not been able to offset increasing debt. Looking at the chart on the right, one can see that the net debt-to-EBIT ratio has worsened over the past few years. Altogether, these metrics suggest that while the NFC sector may not instigate the next recession, they are not in a great position to weather the economic hardship.


