
Growth lopsided – private demand weakness Real GDP: f/c 0.6%qtr, 1.8%yr Domestic demand: f/c 0.2%qtr, 0.8%yr
- The Australian National Accounts, to be released on Wednesday December 4, will provide an estimate of economic activity for the September quarter, including any boost to date from recent policy stimulus.
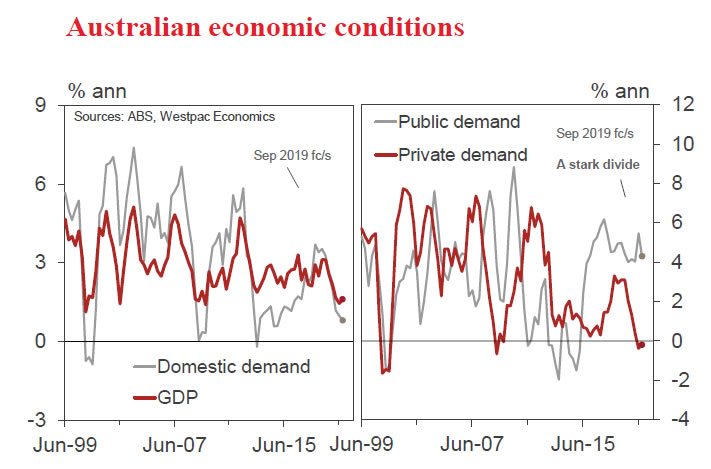
- We anticipate yet another disappointing report card – with growth lopsided and private demand weak.
- The backdrop, the economy lost considerable momentum from mid-2018. Annual real GDP growth slowed from an above trend 3.1% to 1.4% currently – the softest result since 2009 and a pace below population growth, of 1.6%.
- The housing sector turned from boom-to-bust, as lending conditions tightened further, and consumer spending slowed, constrained by weak wages growth – a key structural challenge. The global economy also lost momentum and uncertainties increased on the escalating trade war.
- Tail winds are from: brisk government spending (in the form of public demand), with a focus on health and investment; the export uptrend, associated with the lower dollar; and recent higher commodity prices, boosting national income (in particular mining profits and government tax revenue).
- RBA rate cuts and modest personal income tax cuts have had a mixed impact to date. Consumer spending remains weak, while the housing sector is responding – albeit in an uneven fashion, with prices rising but dwelling approvals still soft.
- In the June quarter, real GDP growth was 0.5%qtr, 1.4%yr. The arithmetic being: domestic demand +0.3%; net exports +0.6ppts; statistical discrepancy +0.1ppt; with a sizeable drag from inventories, -0.5ppts.
- For the September quarter, real GDP growth is a forecast 0.6%qtr, 1.6%yr. The arithmetic: domestic demand 0.2%; net exports +0.2ppts and inventories +0.2ppts.
- Private demand, on our figuring, was flat in the quarter and contracted by 0.4% over the past five quarters – an extended period of weakness, matching that in the downturn of 2000 and the softest results since the early 1990s recession.
- On the consumer, accounting for 57% of domestic demand, the national accounts provide us with a detailed update on spending, saving and incomes. Notable is the weakness in wages and in non-labour income. Households have been income constrained and the savings rate has declined over recent years to be at modest levels, currently at 2.3%.
- The labour market was reasonably robust in the September quarter but weakened subsequently. In Q3, job numbers increased by 0.6%qtr, 2.5%yr and hours worked expanded by 0.6%qtr, 2.1%yr. A point to note, productivity has been contacting, in part due to the supply shock from the current severe drought in parts of the country.
- National income has been a point of strength, underpinned by the recent uptrend in commodity prices. The terms of trade in Q3 grew by an estimated 0.5%qtr, 8.3%yr. Nominal GDP growth is a forecast 1.0%qtr, 5.2%yr.
- Looking ahead, our assessment is that output growth will strengthen in 2020, but still be at a below trend pace given the ongoing challenging environment. The unemployment rate will likely grind higher next year, rising to around 5.6%.
Household consumption (0.3%qtr, 1.4%yr): Consumer spending is contracting in per capita terms, a trend that likely extended into the September quarter. Modest income tax cuts appear to have been largely saved. Retailing is in outright contraction, with real sales declining by -0.1%qtr, -0.2%yr in Q3. That is weaker than during the GFC and is the weakest result since the early 1990s recession. Motor vehicle sales are also in decline. Consumers are less confident than they were earlier in the year.
Dwelling investment (-2.3%qtr, -11.3%yr): Home building activity has swung from boom-to-bust, as supply largely caught up with demand and as lending conditions tightened. Activity fell by 2.3% in the quarter, the Construction survey reports. Work is 11.3% lower than a year ago, directly subtracting 0.7ppts from GDP. The downturn has further to run with approvals down by 20% over the year.
Dwelling prices are now rising, not falling, particularly in Sydney and Melbourne, which will provide support to some households. It also means that the real estate sector (OTC) will likely add to growth in Q3, potentially 0.1ppt.
New business investment (-1.0%qtr, -1.0%yr): Business investment is contracting in this challenging environment, led lower by the non-mining sectors – including a decline in equipment spending and infrastructure activity. Mining investment has turned the corner, after 6 years of decline, supported by higher commodity prices.
Public spending (0.9%qtr, 4.3%yr): Public demand is expected to add 0.2ppts to growth in Q3 and 1.0ppt over the year – with robust spending growth continuing.
Net exports (+0.2ppts, +1.0.ppt yr): Exports are in an uptrend, +0.8%qtr, 3.4%yr, led by LNG (on additional capacity) and services (supported by the lower dollar). Imports are understandably weak given soft demand, 0.0qtr, -1.4%yr.
Private non–farm inventories (-0.5%, +0.2ppts contribution): Business non-farm inventories (often volatile and difficult to forecast) are expected to decline further (in this weak sales environment) but at a slower rate (hence they add to growth in Q3).


