The price of crude oil rose sharply as tensions between the United States and Iran and Iraq continued. These tensions accelerated after Donald Trump ordered and killed Qassem Soleimani who was a powerful Iranian military leader. Iran has vowed to retaliate against the killing while Trump has said that any retaliation will be met with bigger retaliation. In Iraq, the country’s parliament voted to expel foreign military officials. In response, Trump threatened to impose new sanctions on the country. All this shows that tensions in the Middle East will continue. This will be positive to the price of oil and risk assets like gold and Swiss franc. It will be negative to most stocks but positive to defence contractor stocks.
The Japanese yen weakened slightly against the USD after Nomura released the manufacturing PMI data. The data showed that the manufacturing PMI declined from 48.8 in November to 48.4 in December. The manufacturing PMI has remained below the important 50 level since April last year. A PMI reading below 50 is usually a sign of contraction. As an export-oriented economy, Japan is vulnerable to changes in the global economy. As a result, the country was affected by the trade war between the United States and China. It was also affected by the self-inflicted trade war between Japan and South Korea. Still, the Japanese yen has gained significantly against the USD this month on the rising tensions.
Later today, the market will receive important data from Europe and North America. In Germany, the market will receive the retail sales numbers. The retail sales for November are expected to have risen by 1.1% after falling by -1.9% in the previous month. The sales are expected to rise by an annualized rate of 0.9%. Traders will also receive the German composite and service PMI data. They will receive the PMI data from the European Union, Italy, the UK, and other European countries. In North America, the market will receive the raw materials price index (RMPI) and the Industrial Product Price Index (IPPI).
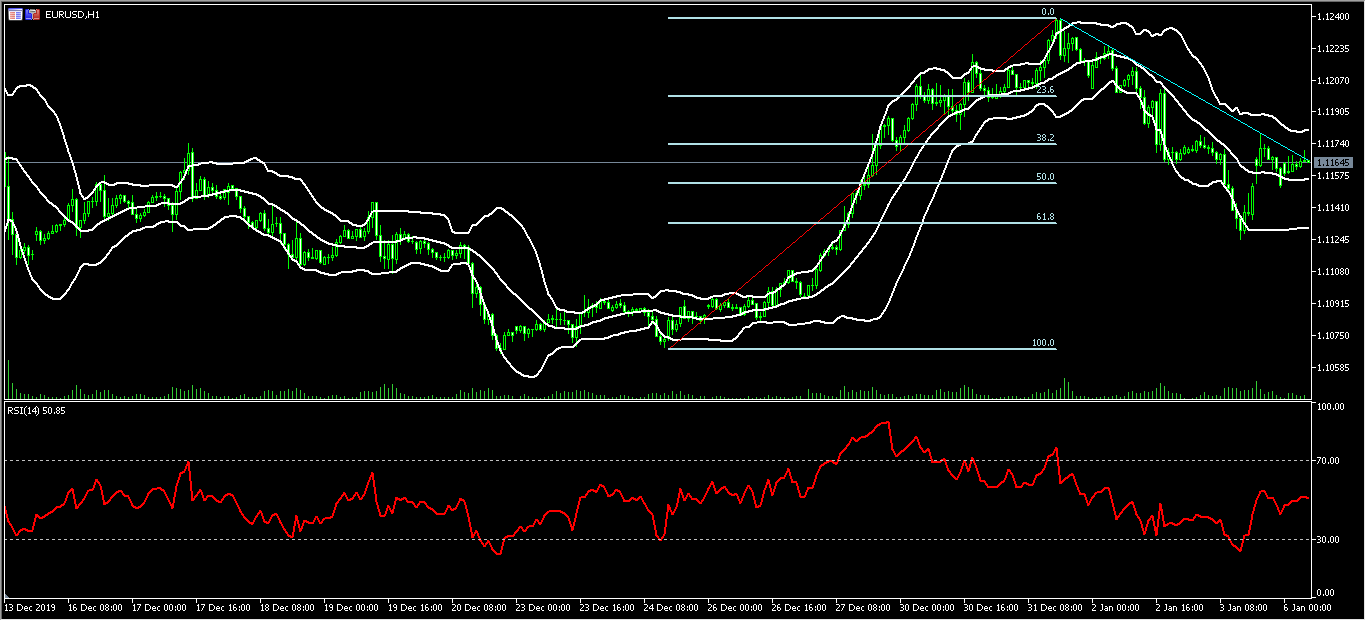
EUR/USD
The EUR/USD pair rose slightly during the Asian session. The pair is trading at 1.1165, which is between the 38.2% and 50% Fibonacci Retracement level. The price is also between the middle and upper line of the Bollinger Bands while the RSI has been moving upwards. The pair may still resume the downward trend that was started on January 2.
USD/JPY
The USD/JPY pair reached an important low of 107.75 on Friday. This was the lowest level since October 21. In general, the pair has declined by almost 2%. The price is below the 14-day and 28-day moving average and is slightly above the lower line of the Bollinger Bands. The RSI remains below the oversold level. The dots of the Parabolic SAR are above the current price. This implies that the pair may resume the downward trend as tensions in the Middle East continue.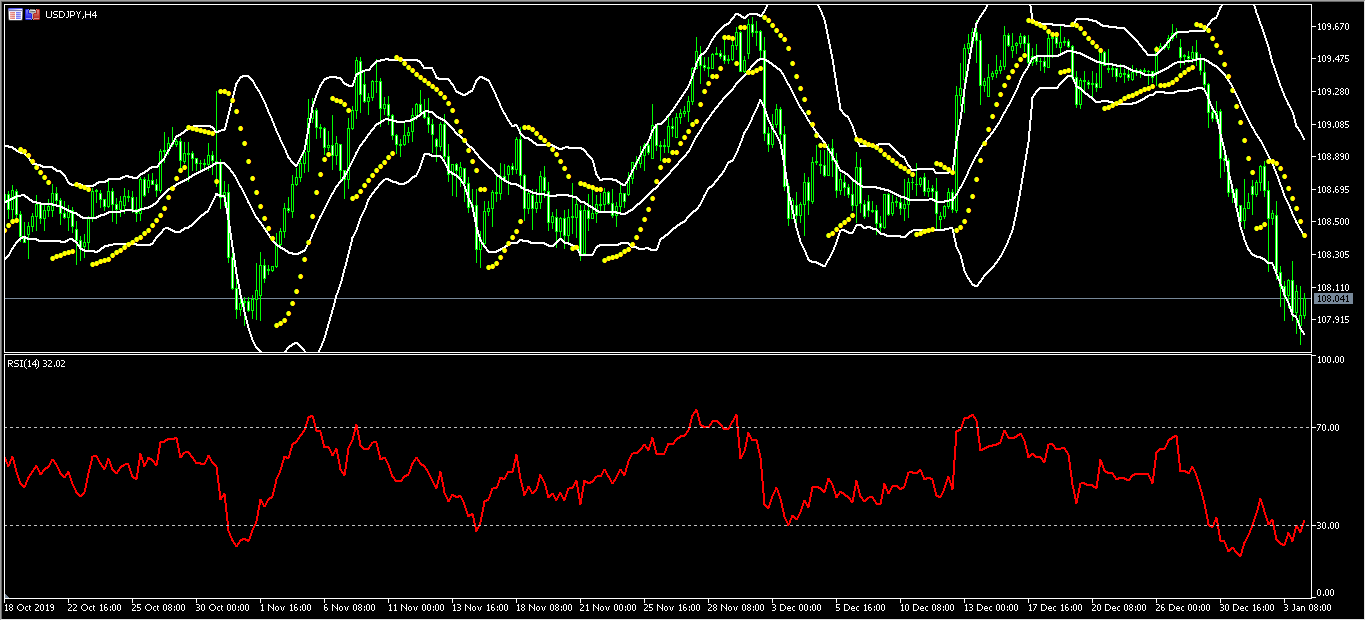
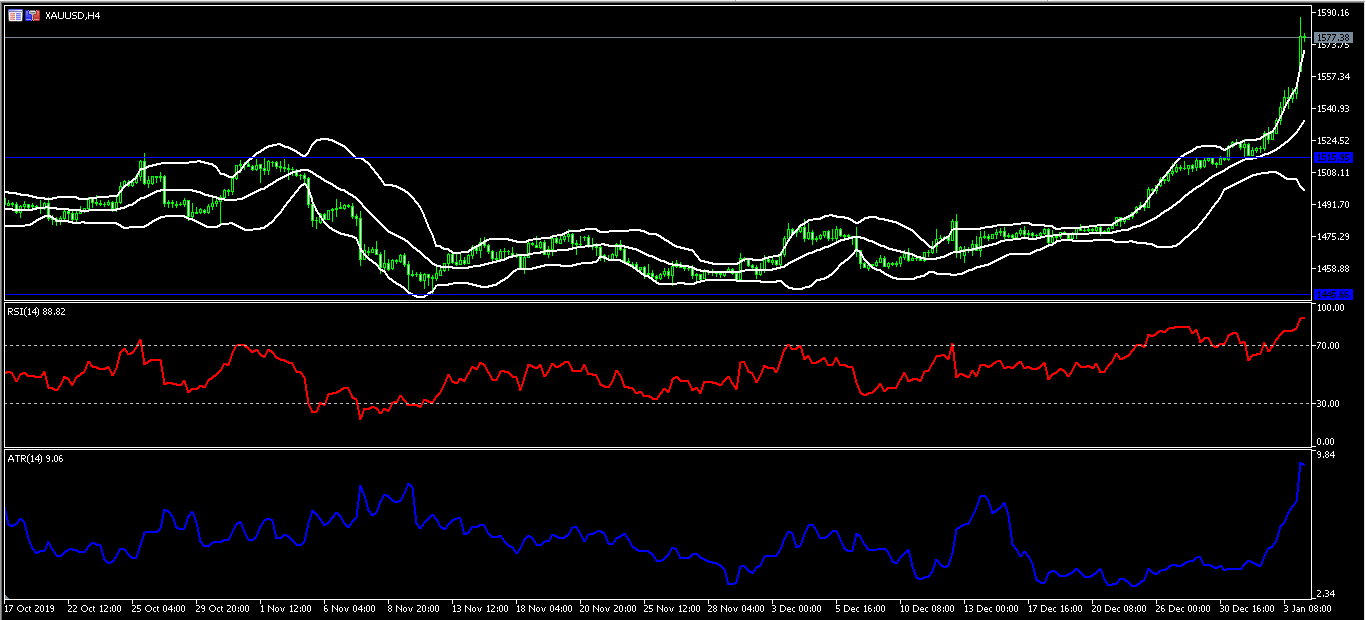
XAU/USD
The XAU/USD pair has continued the upward momentum. This is in reaction to the growing tensions in the Middle East. The pair reached a high of 1588.20. This is the highest level since April 2013. The pair is along the upper line of the Bollinger Bands. It is also above all the moving averages. The RSI has remained above the overbought level. The ATR indicator has also risen sharply, which is a sign of the rising volatility. The pair may continue soaring as tensions remain.