The US dollar index rose in overnight trading as traders reacted to positive economic data and FOMC minutes. Data released yesterday showed that building permits rose by 9.2% in January. This was the highest jump since December 2015. Housing starts declined by 3.6%, which was better than the consensus estimates of a 30% decline. The core and headline PPI rose by 0.5% on a MoM basis. The two rose by 1.7% and 2.1% on an annualized basis. The Fed minutes released yesterday showed that officials discussed maintaining rates at the current 1.5% to 1.75%. for a time. They praised what they called a “somewhat favourable” outlook of the US economy.
The Australian dollar declined after the statistics office released the January employment numbers. The numbers were generally good. The economy added 15k full-time jobs and about 5k part-time jobs. In the past year, the economy added about 257k jobs. The underemployment rate remained steady at 8.5% in January. On the negative side, the seasonally-adjusted unemployment rate rose to 5.3% from the previous 5.1%. This is the highest it has been since October last year. Australia sells most of its goods to China. This has made it relatively exposed to the country’s weakness as the coronavirus illness continues to spread.
The British pound declined in the American and Asian session as chances of a no-deal Brexit rose. The UK has proposed having a Canada-style trade deal with the European Union. The proposal would be free from the bloc’s rules and regulations. In a statement, Michel Barnier said that this would not be possible because of the country’s geographical location. Later today, we will receive retail sales data from the country. The sales are expected to have risen by 0.7% in January while the core retail sales are expected to have risen by 0.8%.
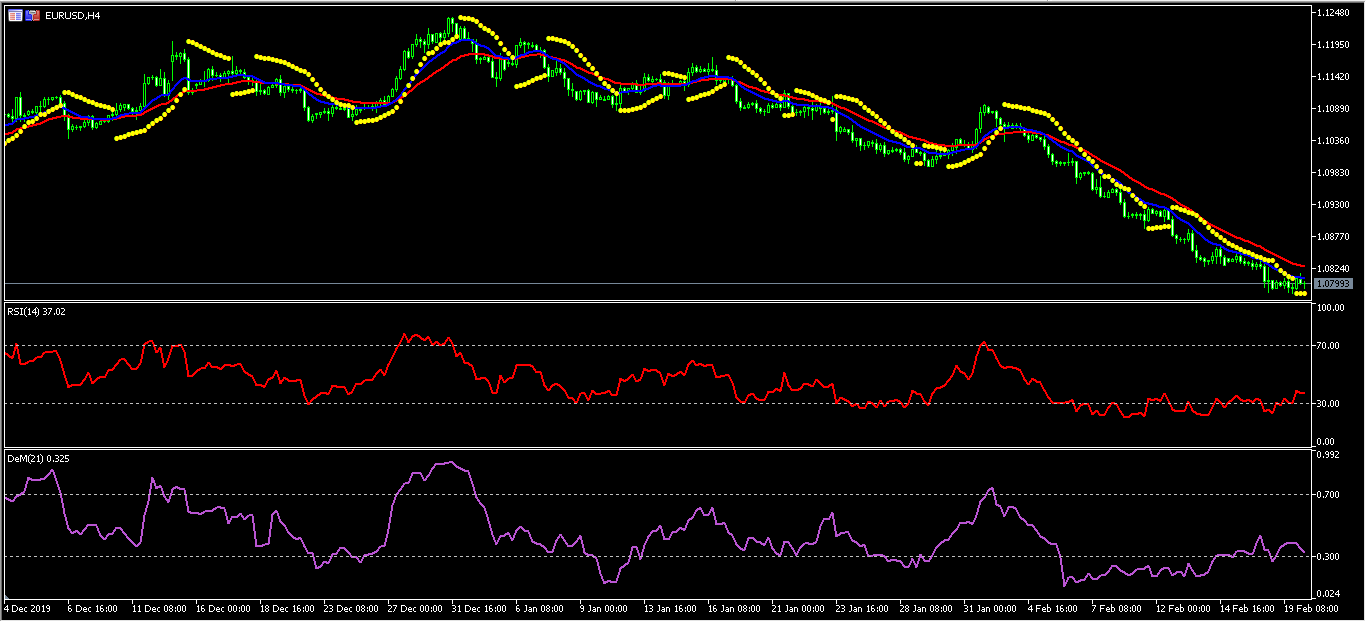
EUR/USD
The EUR/USD was little moved in overnight trading. The pair is trading at 1.0795, which is the lowest it has been since April 2017. The price is below the 14-day and 28-day EMA. The RSI has moved from the oversold level to the current 36. The same is true with the Demarker indicator. The Parabolic SAR dots are below the price on the four-hour chart. The pair appears to have found a significant resistance, which means that it might start moving higher.
USD/JPY
The USD/JPY made a significant breakout yesterday when Japan released weak economic data. The pair reached a high of 111.58, which is its highest level since May last year. This price is above the 14-day and 28-day exponential moving averages. The RSI has moved to 85, which is its highest level in more than a year. The DeMarker has reached the highest level since January. The pair may continue with the upward momentum.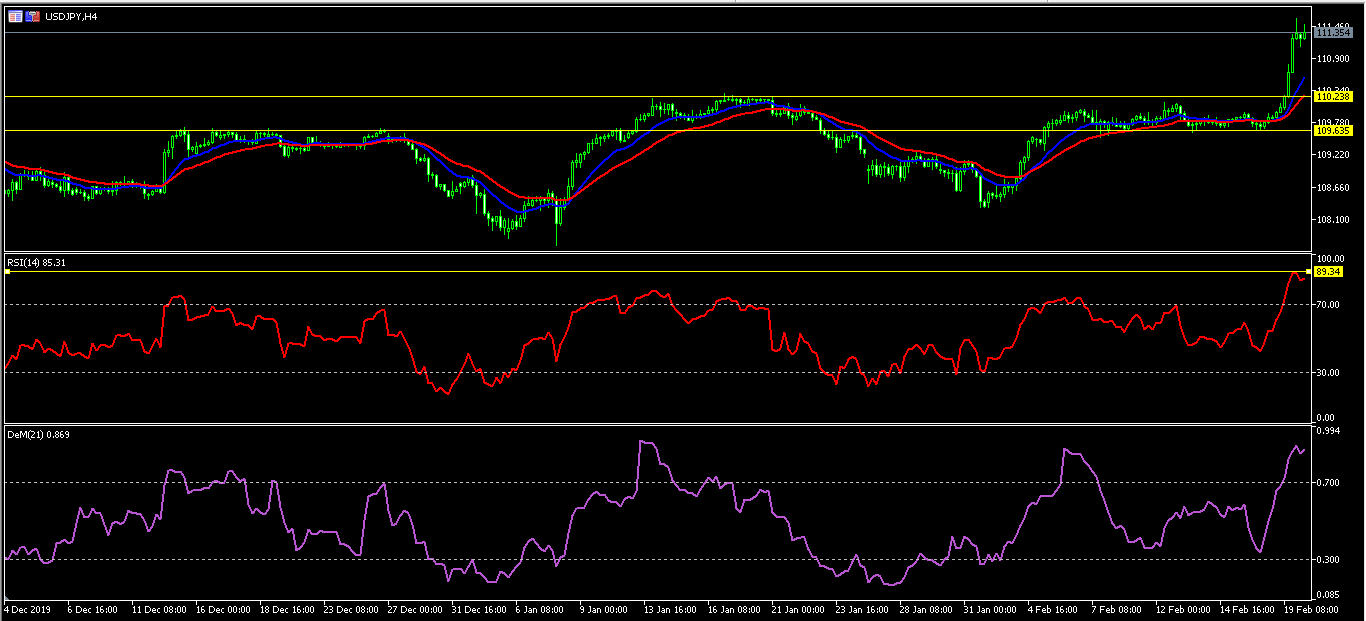
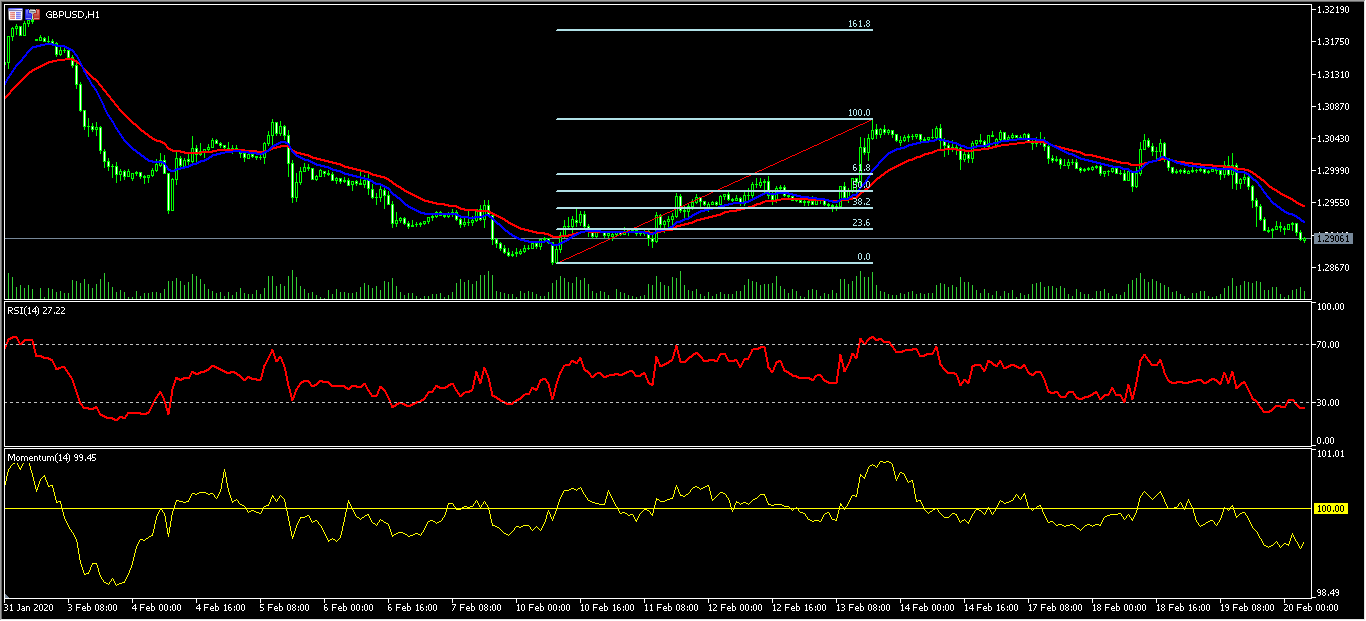
GBP/USD
The GBP/USD pair has been declining since February 13, when it was trading at 1.3070. Today, the pair reached a low of 1.2900. This price is slightly below the 23.6% Fibonacci Retracement level. The price is below the 14-day and 28-day exponential moving averages. The RSI has moved to the oversold level while the momentum indicator has declined below 100. The pair may continue moving downwards as it tries to test the important support of 1.2870.