
During market stress periods, safe-haven gold tends to generate strong returns, outperforming other alternative means of investment and hence moving rapidly in traders’ favor as a store of wealth. This year thanks to the Covid-19 pandemic, the precious metal printed new multi-year highs capitalizing more than 12% year-to-date, while compared to the same period last year it managed to earn a whopping 29% annual increase. Markets are now wondering whether gold could look more ‘golden’ in the post-lockdown period, and the view is that it may worth to hold your breath as risks continue to linger in the background.
Gold holdings hit record high
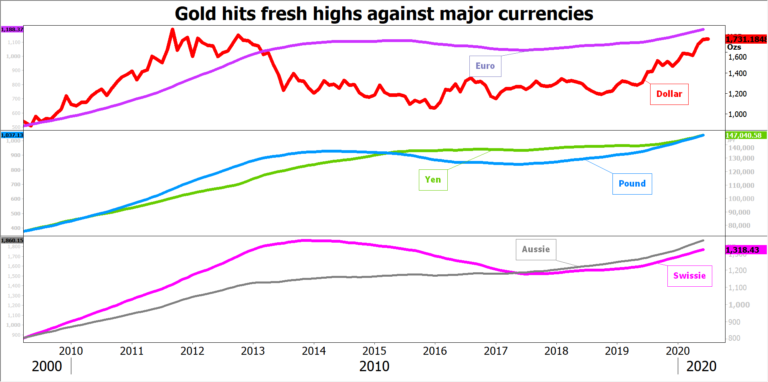
Despite supply disruptions, gold experienced huge inflows since the start of the year, most notably in exchange-traded funds (ETFs) which topped any prior year’s record, with total holding jumping to a historic high of 3,510 tonnes in May. There have been moments when traders sold the metal for cash – especially during the heavy sell-off in early March – in order to meet their daily transactions, forcing the price to fall considerably along with equity prices and other risky assets. However, the downfall was immediately corrected as massive stimulus packages from governments and central banks combined with a highly uncertain global economic environment shifted funds back to the metal, driving its price to uncharted territory not only against the US dollar, but also versus other major currencies. Anyhow, gold has been historically proved to be performing well in both good and bad times, therefore what other asset could be the most liquid haven complement to stocks and bonds at the current environment where super low interest rates reduce the opportunity cost of holding the bullion?
Stock recovery and US data feed scepticism
That said, the steep recovery in stock markets – mainly in US indices – and as a first key piece of evidence, the impressive US employment report in May, is currently feeding skepticism that room for improvement may be narrowing in the bullion market. On the one hand, no one can exclude that case in the short-term as travel restrictions are set to gradually ease in several economies from June onwards, giving a much-needed boost to the struggling tourism industry. Meanwhile, as long as there is no serious concern of a second wave of infections, traders could take their eyes off safe havens a bit and use the support from the super accommodative fiscal and monetary policies to buy riskier assets. Yet, how fast gold could decelerate may depend on the speed of recovery and the improvement in business sentiment reflected in the coming earnings releases.
But upside risks are larger for gold market
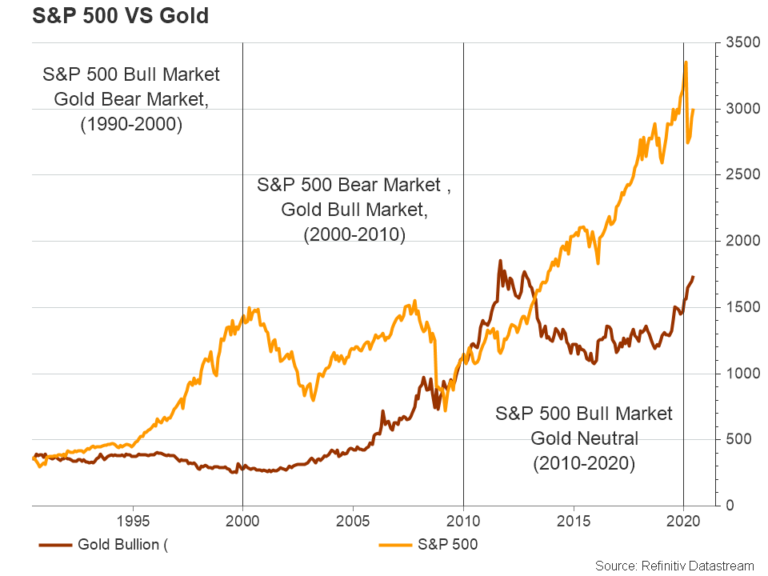
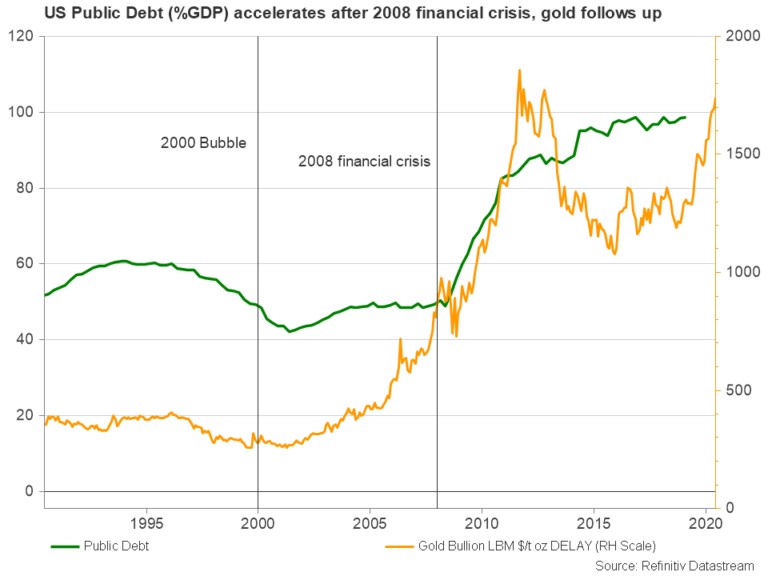
On the other hand, there are more tailwinds than headwinds in the horizon that make the “buying the dip” option a wiser choice. While the ongoing risk-on party could steal some shine from the precious metal in the near-term, ultra-high fiscal deficits could undermine confidence in the dollar and the United states which heads to the polls in November. Take the period following the 2008 financial crisis as an example. The advance in the public debt-to-GDP ratio, which more than doubled, triggered a bullish run in the gold market. Something similar happened after the 2000 bubble and after the 1930s Great Depression. Hence, it is likely the history repeats itself this year as projections estimate the deficit to quadrable and it would be up to the government to decide whether it should raise taxes or cut spending if it finds difficult to meet its toxic debt payments, cutting growth from the economy.
Inflation is another key factor to watch given its impact on real interest rates. When price growth is accelerating, real rates (nominal rates adjusted for inflation), which compete with gold, are diminishing, discouraging foreign investments in the domestic economy. In this case, gold could be a better source of purchasing power, especially when real rates are zero or negative. The latest update on consumer prices showed that inflation is subdued at multi-year lows, but the numbers were mainly extracted during the lockdown period when consumption was muted. Therefore, markets will be closely watching the next releases, but given the muted inflation pressures in previous years, it remains to be seen if the stimulus could result in a period of swelling inflation. Alternatively, even if inflation fails to accelerate, a potential cap on bond yields by the Fed (not soon though) that would ensure that nominal rates are near zero, could still benefit gold.
Finally, the trade war is in the equation too. Following the phase one trade deal, tension between the US and China did not take long to resurface as the sides played the ping pong game over whose responsibility is the virus outbreak, with President Trump lately threatening to cut passenger flights from China when Beijing loosens restrictions on international air travels on June 16. While the dispute escalation could be part of Trump’s political strategy ahead of federal elections, it is a reliable source of support for gold which experienced a dynamic rally in the face of the trade war in the previous years. Probably it could face another bright year as the second phase of trade talks could be tougher.
Technical levels in watch
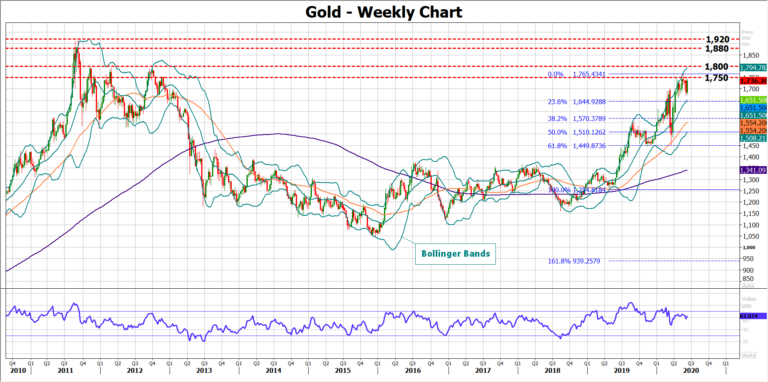
From a technical perspective the yellow metal has still some bullish fuel in store as the price is holding a positive structure above its simple moving averages (SMAs) in the weekly chart and has yet to challenge the upper Bollinger band, while the RSI continues to fluctuate comfortably above its 50 neutral mark. Yet, whether the rally could stretch towards the 2011-2012 strong resistance zone around 1,800, may depend on the 1,750 barrier that is currently keeping the bulls under control. Should the price jump above 1,800, all eyes will turn to the 1,880-1,920 territory that set the stage to a long-term bearish wave back in 2011.
Otherwise, a close below the 20-weekly SMA (middle Bollinger band) currently at 1,650 and near the 23.6% Fibonacci of the 1,265-1,765 bullish wave, could confirm additional losses towards the 38.2% Fibonacci of 1,570 and the 50-weekly SMA. Such a move would mark a lower low in the chart and signal the start of the potential bearish cycle.


