US stocks bounced back after falling by more than 1% in the first few hours. The Dow Jones ended the day higher by 300 points while the Nasdaq rose by more than 107 points. The gains ended a two-day losing streak as investors remained cautious about surging coronavirus cases. In the United States, cases continued to rise, with health officials confirming a record of 39,327 new cases. That means that the country confirmed more than 100,000 cases in the past two days alone. As a result, Texas announced that it was suspending the reopening process. This is after the number of hospitalizations increased for 13 days in a row.
The price of crude oil rose in overnight trading as traders remained optimistic about demand. The West Texas Intermediate (WTI) rose by 42 cents to $39.14 while Brent rose by 47 cents to $41.52. Some analysts attributed the gain to satellite images that showed strong pick-ups in Europe and Asia. Also, they believe that traffic is back to its original levels in cities like Beijing and Moscow. However, they are also cautious that this recovery could be hurt by the rising cases in key countries like the United States and Brazil.
The euro declined slightly as traders wait for an important speech by Christine Lagarde that will happen at 07:00 GMT. In the statement, the ECB chair will likely address the key steps the bank is taking to support the economy. Later, the ECB will release the private sector loans issued in May. From the United States, we will receive personal income, personal spending data, and consumer confidence by the University of Michigan. In Sweden, the statistics office will release the May retail sales and PPI numbers.
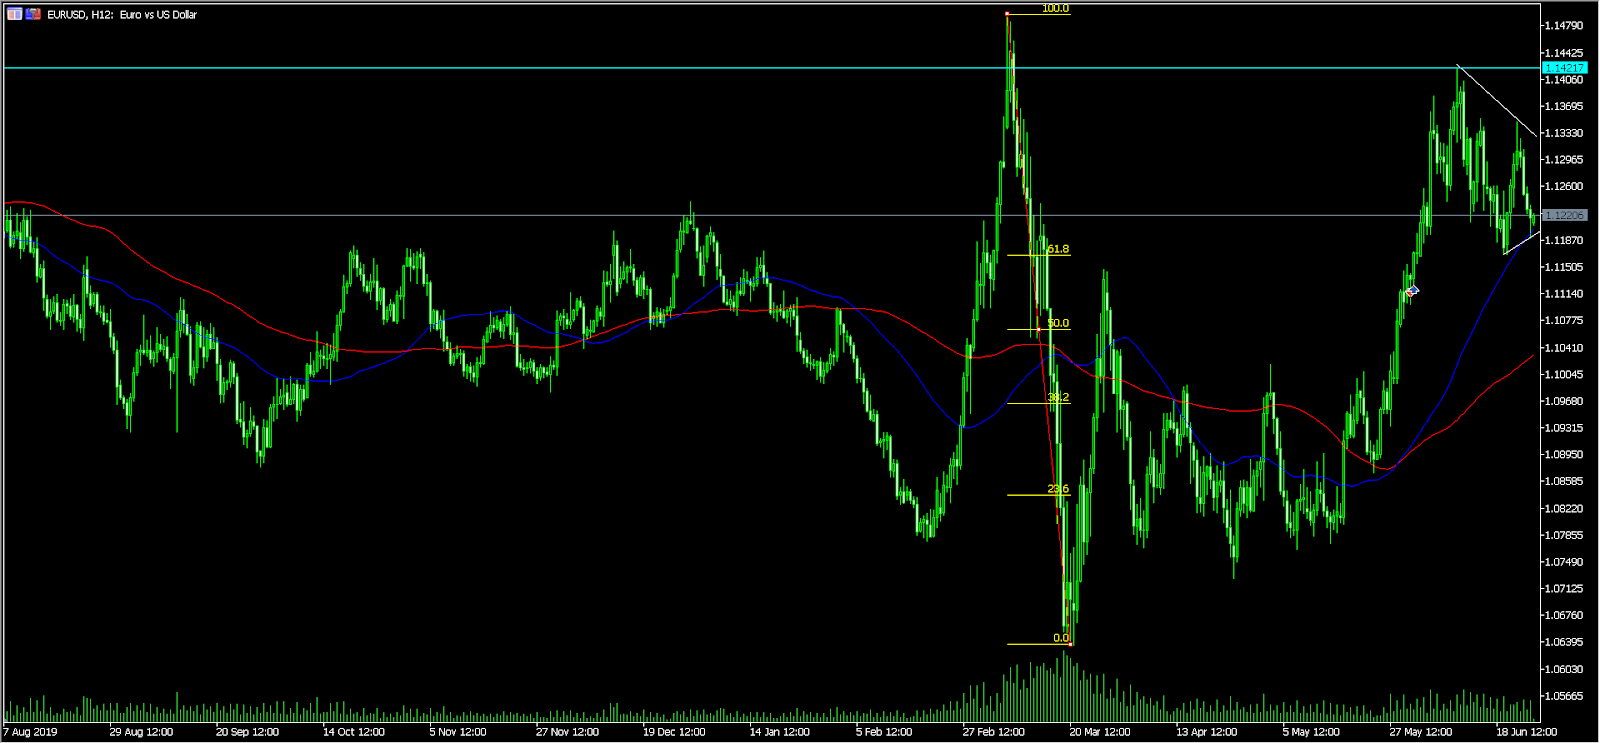
EUR/USD
The EUR/USD pair declined to an intraday low of 1.1191. On the 12-hour chart, the price is slightly above the 50 and 100-period EMAs and is slightly above the 61.8% Fibonacci retracement level. The pair has also formed an extended bullish pennant, which is shown in white. This pattern is usually a pause after a sharp rally and is usually a sign of indecision among bulls and bears. As such, there is a possibility that the pair will continue moving upwards as longs attempt to test the next resistance at 1.1412.
GBP/USD
The GBP/USD pair was little changed during the Asian session. The four-hour chart shows that the price is slightly below the 50-day and 100-day EMAs. The pair is also forming a symmetrical triangle pattern while the signal line of the MACD is below the neutral line. The triangle pattern is approaching its tip, which means that the price may experience a major breakout in the coming weeks.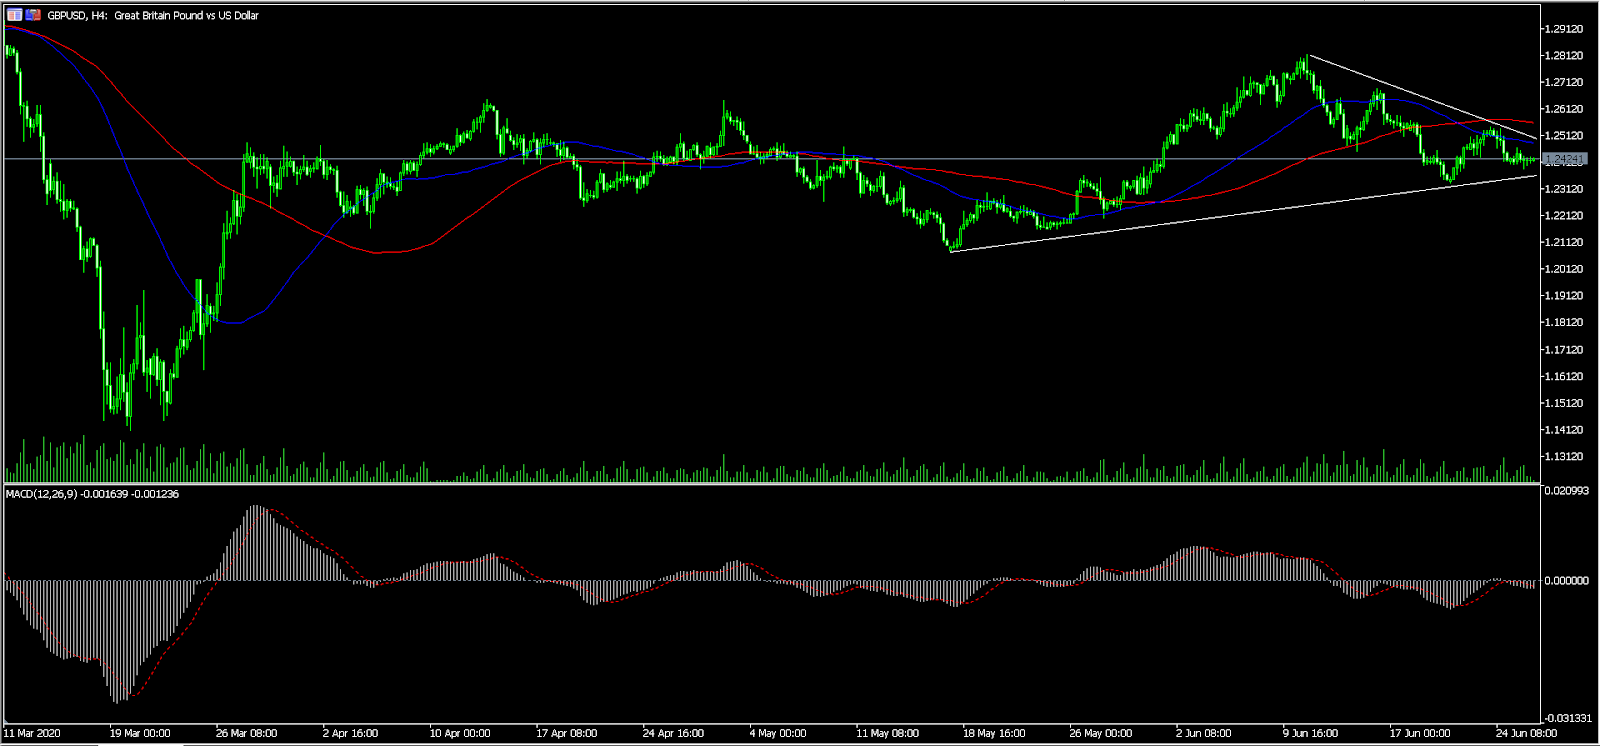
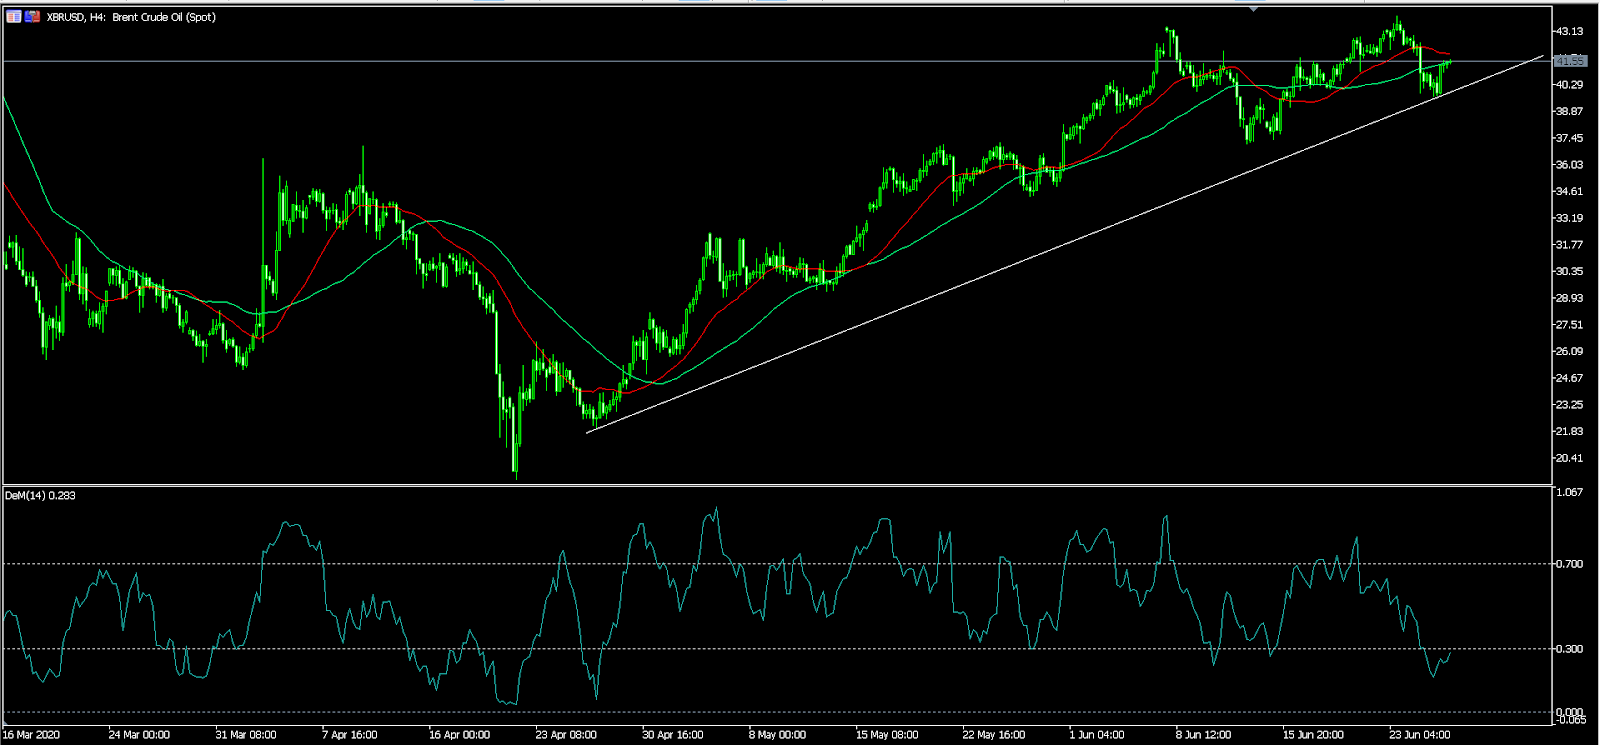
XBR/USD
The XBR/USD pair rose to an intraday high of 41.55, which is the highest it has been since Wednesday this week. On the four-hour chart, the price is above the 50-day and 100-day EMAs and is above the ascending trendline shown in white. The Demarker indicator is also moving from the oversold level 0.160 and is now at almost 0.3. The pair may continue rising as bulls wait for the oil rigs data from Baker Hughes.