
U.S. Review
Q3 PCE Rebound in the Cards, Outlook More Uncertain
- After a revised look at GDP this week suggested the second quarter may not have been quite as bad as first estimated, attention shifts to the current quarter. Fresh data this week shed light on the outlook for consumer spending.
- The bounce in Q3 consumption is looking better-than expected, though fading confidence and uncertainty about the virus and fiscal policy suggest the strength could quickly fade.
- FOMC Chair Jerome Powell announced an update to the Fed’s Monetary Policy Framework in his remarks at the Jackson Hole Symposium. For a detailed analysis of how this affects our outlook, please see Interest Rate Watch on Page 6.
Q3 PCE Rebound in the Cards, Outlook More Uncertain
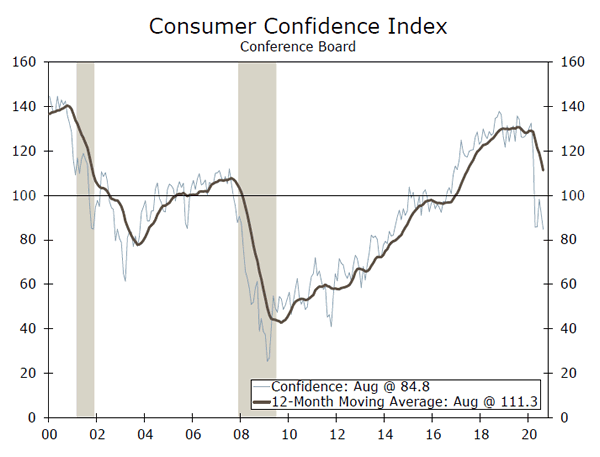
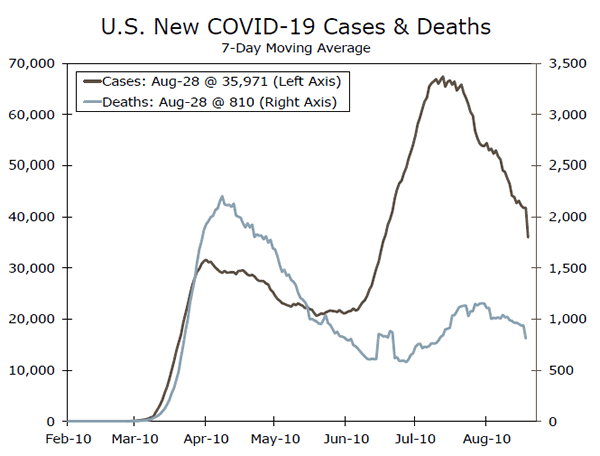
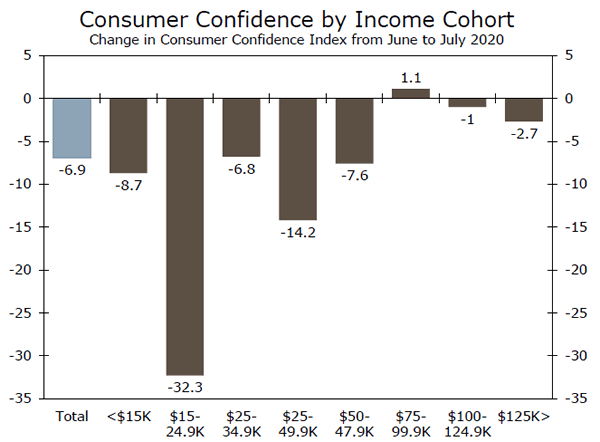
Consumer confidence measured by the Conference Board came in lower than most forecasters had predicted at 84.8 in August. This marked a 6.9-point slide from July to its lowest level since 2014. Consumers’ perception of their present situation as well as their expectations for the future faltered in August, with the expectations index sliding to its lowest level since 2016. With virus case counts again declining (top chart), recent pessimism is likely at least partially due to the expiration of the supplemental unemployment benefits of $600/week at the end of July. Consumer confidence by income supports this conclusion. Although confidence is down from February across all income cohorts, the declines from July to August were greater among lower-income households (middle chart). Since job losses have been concentrated in lower-paying industries, it is not far-fetched to conclude that these individuals have disproportionately benefitted from the unemployment stimulus in recent months. But, with that cash windfall now no longer available, these households are likely less optimistic of their financial situations. The downward revision to the University of Michigan’s consumer sentiment index in August reaffirms this conclusion. The preliminary read was likely too early in the month to capture the hit to incomes of the around 30 million Americans collecting unemployment benefits.
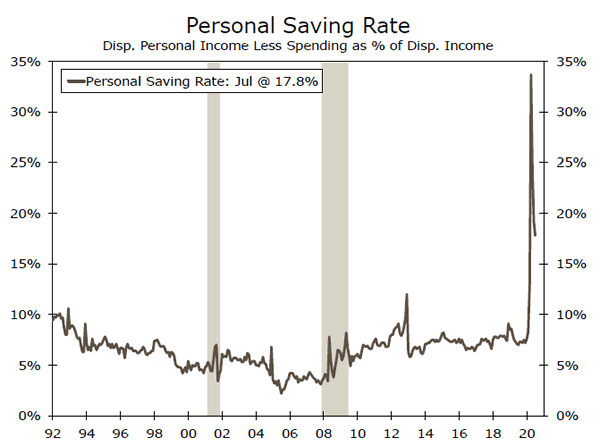
Although confidence and personal spending do not always track from month to month, a downward trend in confidence is not an encouraging sign for the consumer-led recovery. Still, real personal spending rose 1.9% in July, and considering the base effects from the second quarter, even if spending is unchanged in August and September. Personal Consumption Expenditures (PCE) are set to rise at an annualized rate north of 35% in Q3. But, the pullback in confidence, expiration of supplemental unemployment benefits and 30M+ Americans still unemployed, could lead to a pull-back in the final two months of the quarter. Regardless, a solid outturn for Q3 PCE is likely in the cards, although the fourth quarter and beyond remain highly uncertain. Not only does it remain unclear if additional fiscal stimulus will come to pass, but the virus trajectory in the fall and winter months is unknowable at present. Even if households do not receive additional stimulus, they may be wellpositioned to spend if the virus remains under control given the elevated savings built in recent months (bottom chart). Unfortunately, the broader recovery continues to remain highly dependent on the trajectory of the virus.
Perhaps the news that garnered the most market attention this week was the adjustments the Fed made to its monetary policy framework announced by FOMC Chair Powell at the Jackson Hole Symposium on Thursday. At a high level, the Fed announced it would transition to average inflation targeting around its 2% target and that it would tolerate above-maximum employment, or the labor market to run “hot,” for some time. These changes were partially expected and for more detail on how they affect our outlook, please see our recent special report and Interest Rate Watch on Page 6.
U.S. Outlook
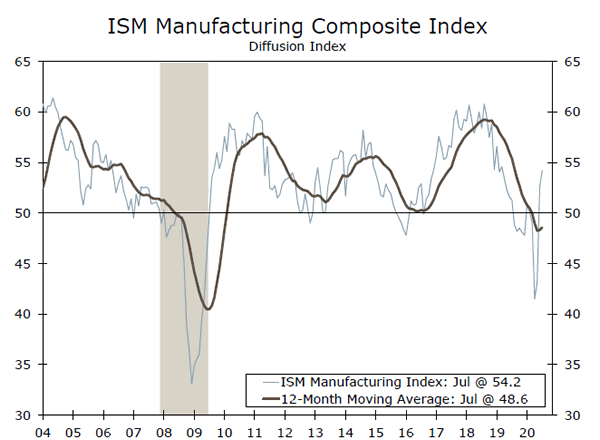
ISM Manufacturing • Tuesday
Manufacturing activity has started to recover from the shutdowns and supply chain disruptions brought on by the coronavirus pandemic earlier this year and the trade tensions that swirled before that. In July, the ISM manufacturing index hit a 16-month high of 54.2. The details painted a picture of better-balanced growth, with supplier delivery times easing after interruptions and new orders cresting above 60.
Manufacturing activity had been helped by a stronger recovery in goods rather than services as consumers have shied away from experience spending. Factory activity looks to have firmed in August, with regional Fed manufacturing surveys rising on balance and a higher reading of the Markit PMI. We expect the ISM manufacturing index to edge up to 54.3 in August.
Previous: 54.2 Wells Fargo: 54.3 Consensus: 54.5
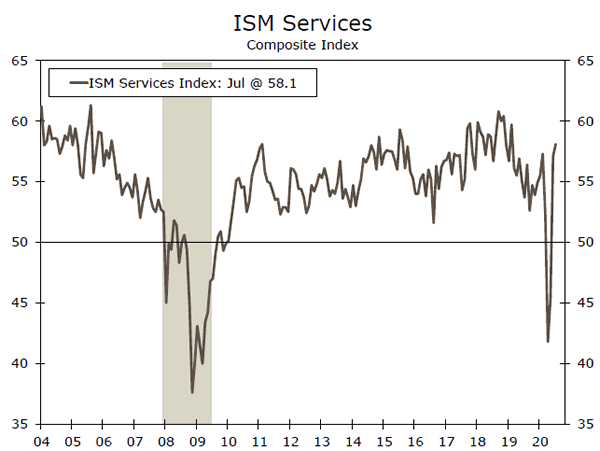
ISM Services • Thursday
While the manufacturing index has traditionally gotten the limelight, the ISM services survey is set to offer a better read on the current recovery. The need to social distance has hit the service sector unusually hard this cycle. Re-openings propelled the ISM services index back into positive territory in June and July, but August will indicate the extent to which the overall recovery is holding up.
Weekly data on jobless claims and mobility indicate that the pace of recovery has been little changed. Yet the preliminary Markit services PMI as well as the Richmond and New York Fed services surveys all improved in August, signaling that activity in the service sector picked up further. We look for the ISM services index to slip slightly in August after a breakneck pace in the business activity and new orders components last month, but to remain squarely in expansion territory.
Previous: 58.1 Wells Fargo: 56.4 Consensus: 57.4
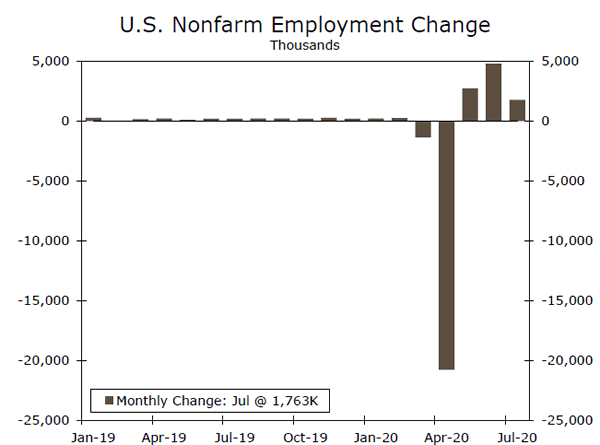
Employment • Friday
Most indicators suggest the jobs market continued to improve in August, but at a slower pace than prior months. A spike in COVID cases over the second half of July sparked concerns that payrolls could contract again for August. However, leading up to the survey week (August 9-15), jobless claims edged lower, August employment components from PMIs have improved on balance, and hiring for the 2020 Census jumped. We look for payrolls to increase 1.40M despite a drag in educational hiring after seasonal factors inflated payrolls for the sector in July.
We expect the unemployment rate to edge down only slightly in August, to 10.0% from 10.2%. Not only is hiring expected to be less robust, but last month saw a drop in the labor force despite another large increase in employment, which we expect to at least partially reverse. At the same time, the Consumer Confidence survey showed households viewed job availability less favorably in August.
Previous: 1.76M Wells Fargo: 1.40M Consensus: 1.52M
Global Review
Q2 GDP Data Plunged Across Most Economies
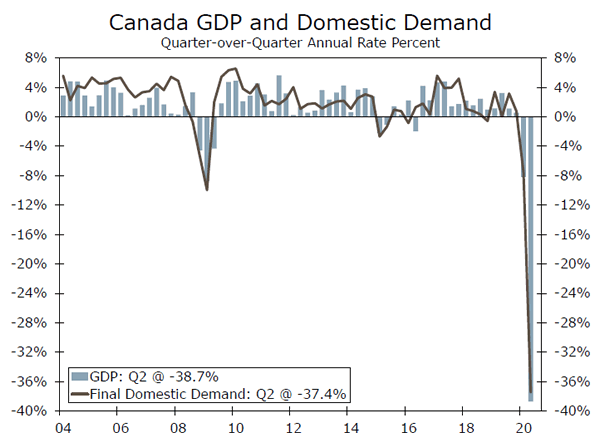
- Q2 GDP growth data released this week continued to show severe declines in most developed and emerging markets. Among the G10, Norway’s economy posted a record slump in the second quarter, plunging 6.3% quarter-over-quarter, while the Canadian economy also suffered a record decline, falling an annualized 38.7%. Meanwhile, Mexico’s economy also fell sharply as the COVID-19 pandemic weighed on key industries.
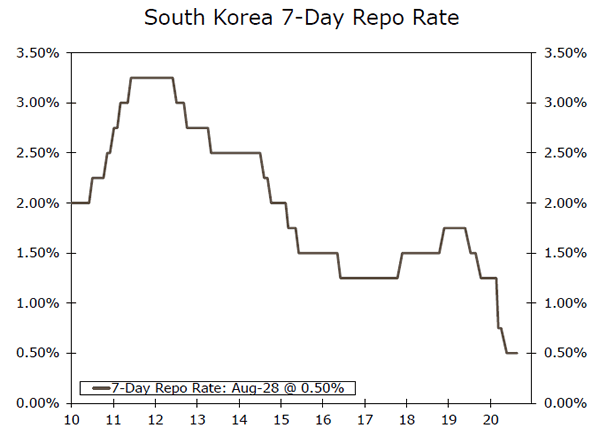
- The Bank of Korea held its 7-day repo rate unchanged at a record low of 0.50% at its meeting this week. The central bank now looks for the economy to contract 1.3% in 2020, significantly worse than its May forecast.
Monthly GDP Data Points to Rebound
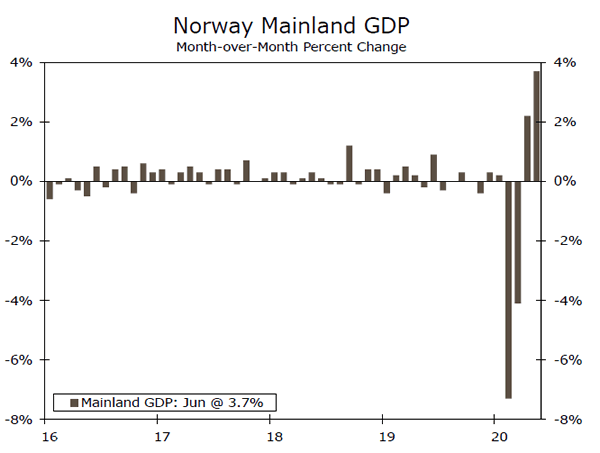
Activity in Norway suffered its largest contraction on record in the second quarter as efforts to contain the spread of COVID-19 weighed on the economy. Mainland GDP, which excludes petroleum production and shipping, plunged 6.3% quarter-over-quarter, matching the consensus forecasts. Household consumption fell 10.8% as demand for services plunged. Meanwhile, investments fell over 3%, while exports declined 8.7%. The drop in Q2 was likely due to large declines in March and April, particularly in many service industries. That said, the slump in activity was less severe than other European countries, where GDP fell more than 10%. As the economy began to re-open, activity started to pick up toward the end of the quarter. Monthly data indicated the economy grew 3.7% month-over-month in June, which suggests the worst may be past for the Norwegian economy, with the biggest contribution to growth coming from health and social work. We continue to look for growth to pick up in the second half of 2020 and into 2021, which should help the Norwegian currency strengthen against the euro and U.S. dollar. Elsewhere, the Canadian economy plunged an annualized 38.7% quarter-over-quarter, the largest drop on record. However, monthly data released indicated a rebound is underway as June GDP growth rose 6.5% month-over-month, exceeding market expectations.
Mexican Economy Still Set for Sharp Decline in 2020
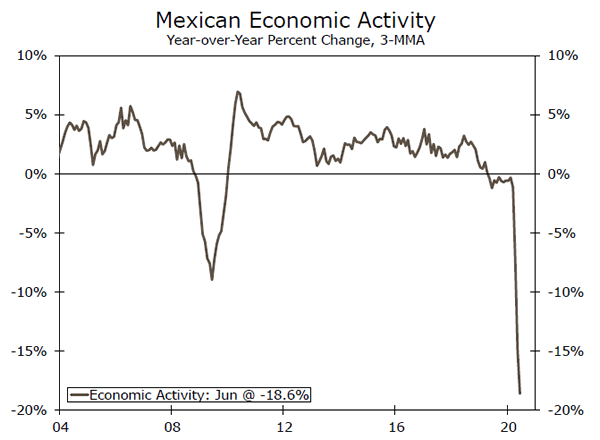
The Mexican economy posted a record slump in Q2, declining 17.1% quarter-over-quarter. However, the figure reported this week was slightly higher than the 17.3% decline reported in the preliminary release. On an annual, non-seasonally adjusted basis, GDP growth fell 18.7%. The breakdown of the quarterly data showed primary activities declined 2%, while secondary and tertiary activities plunged 23.4% and 15.1%, respectively. In a separate release this week, June data appeared to have picked up, indicting the worst of the economic downturn may be over for Mexico. The economic activity index rose from May’s record low to -13.2% year-over-year, the first monthly increase since February.
Mexico’s economy was struggling even before the COVID-19 pandemic, and the government’s push back on any meaningful fiscal stimulus packages could limit the economy’s recovery in the second half of this year. The Bank of Mexico lowered its GDP forecast for full-year 2020, and now sees growth declining between 8.8% and 12.8%.
BoK on Hold, but Much Gloomier Economic Outlook
The Bank of Korea (BoK) opted to hold its 7-day repo rate unchanged at 0.50% at its meeting this week, even though the committee was less optimistic on the outlook for the Korean economy. In the accompanying statement, the central bank said that economic growth in Korea has remained sluggish, and looks for the economy to contract a little more than 1% this year, much lower than the -0.2% forecast in May. The committee noted that, the pace of domestic growth recovery is likely to be slower than previously forecast, mainly due to the resurgence in COVID-19 cases in South Korea. At the post-decision briefing the BoK governor indicated that there is still room for an interest rate cut, but he said the central bank would need to be careful regarding such a move.
Global Outlook
RBA Policy Decision • Tuesday
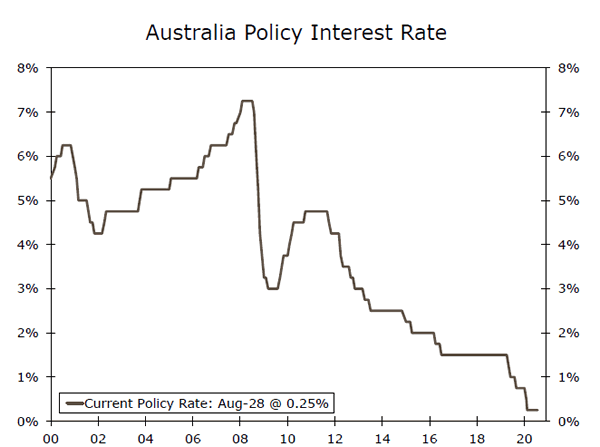
At its last policy meeting in August, the Reserve Bank of Australia (RBA) announced it would be resuming its bond buying for the first time since May, in an effort to ensure three-year bond yields remain consistent with the 0.25% target. The RBA offered to purchase up to A$500M of government securities maturing in April 2023, but added that further purchases will be made as necessary. Since March 20, the RBA has purchased roughly A$59.3B of bonds in its QE program in an effort to cushion the negative effects of COVID-19 on its economy.
At this time we do not expect further quantitative easing to be announced at next week’s meeting. While we acknowledge further monetary policy easing is possible, it is not currently part of our base case. That said, our view remains for the Cash Rate and yield on three-year government bonds to remain on hold at 0.25% through the end of 2021.
Previous: 0.25% Wells Fargo: 0.25% Consensus: 0.25%
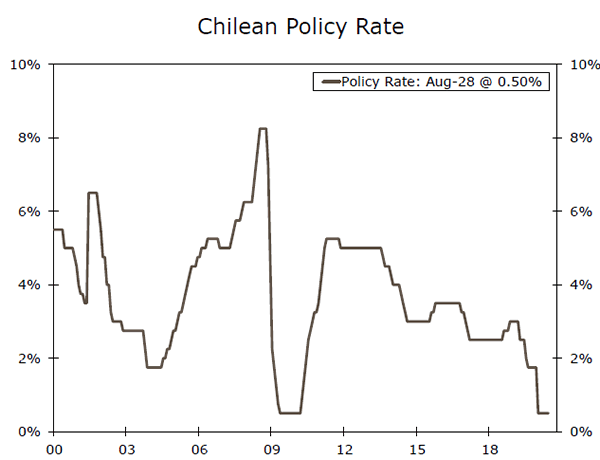
Central Bank of Chile Policy Decision • Tuesday
The Central Bank of Chile opted to keep its policy rate unchanged at a record low of 0.50% at its July 15 meeting as the COVID-19 outbreak continues to disrupt economic activity. While the board did not announce any new measures, it did signal it would continue to assess other monetary policy options to provide support to the economy. These potential policy options include additional asset purchases and liquidity measures to support the extension of credit. Despite the Chilean Central Bank cutting policy rates aggressively and embarking on its own QE program over the course of the year, CPI has fallen below the central bank’s target rate of 3%. Intuitively, additional rate cuts would make sense. However, we believe the central bank lacks policy space to cut rates further as additional rate cuts would push real interest rates further into negative territory and could result in a much weaker currency. In this context, we expect the central bank to keep rates on hold at its policy meeting next week.
Previous: 0.50% Wells Fargo: 0.50%
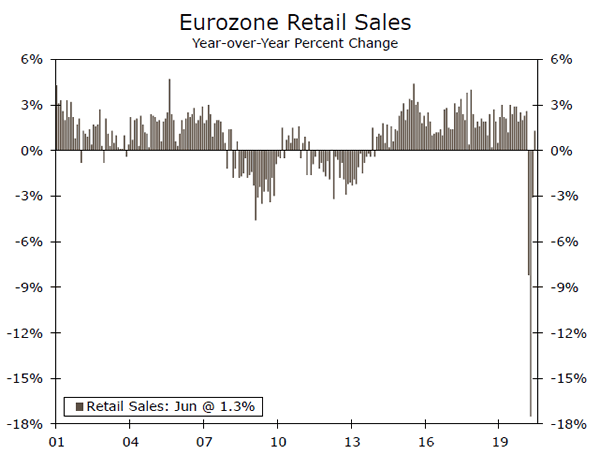
Eurozone Retail Sales • Thursday
Next week’s release of Eurozone July retail sales and August inflation report will offer the latest insight into the how the economy is recovering from the COVID-19 pandemic in the second half of this year. Despite the severe economic decline in the second quarter, the Eurozone economy has appeared to pick back up heading into the third quarter. June retail sales rose 5.7% month-over-month—the second consecutive increase—returning to pre-pandemic levels. The gain was driven by solid increases in textiles, clothing and footwear (+20.4%) as well as car fuel (+20.4%), while non-food products increased 12.1%. By country, Spain and Italy outperformed, rising 16.5% and 13.8%, respectively. Next week, July retail sales is expected to slow, rising just 1.2%. Meanwhile, the July CPI rose 0.4% year-over-year, while the core CPI firmed to 1.2% year-overyear. The August inflation print is expected to edge lower to 0.2%.
Previous: 5.7% Consensus: 1.2% (Month-over-Month)
Point of View
Interest Rate Watch
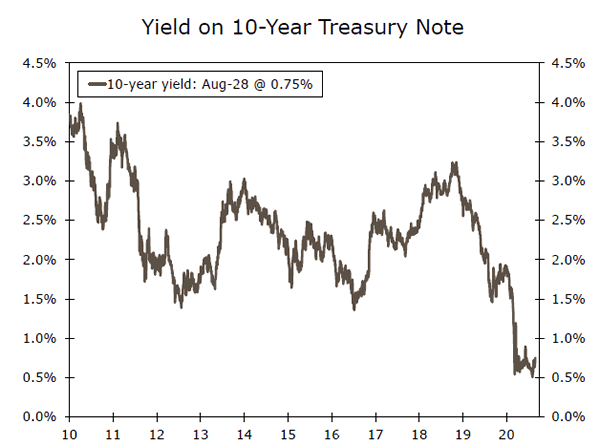
Have Long Rates Bottomed?
The yield on the benchmark 10-year Treasury security, which fell precipitously when the pandemic started to spread in the United States, has been bumping along the bottom over the past few months (top chart). Will long-term interest rates go even lower from here or will they move higher?
There is good reason to believe that, in the absence of a significant acceleration in coronavirus cases that locks down the economy again, long-term rates will not fall much further from here. Let’s start with the speech that Fed Chair Powell made this week in Jackson Hole, WY. As we discussed in more detail in a separate report, Fed policymakers are in effect signaling that they are willing to tolerate a higher rate of inflation. Consequently, fixed income investors should demand a bit more inflation protection in the form of higher yields on U.S. Treasury securities.
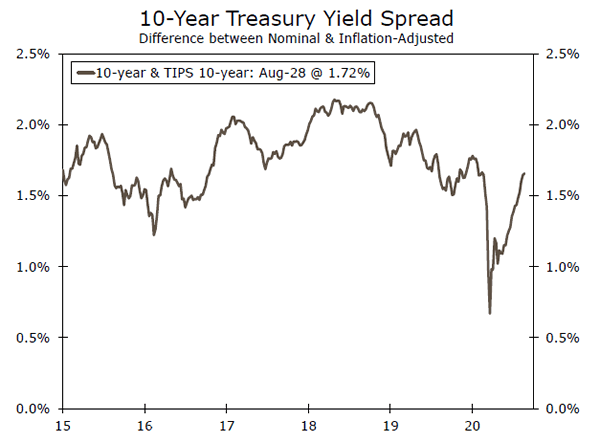
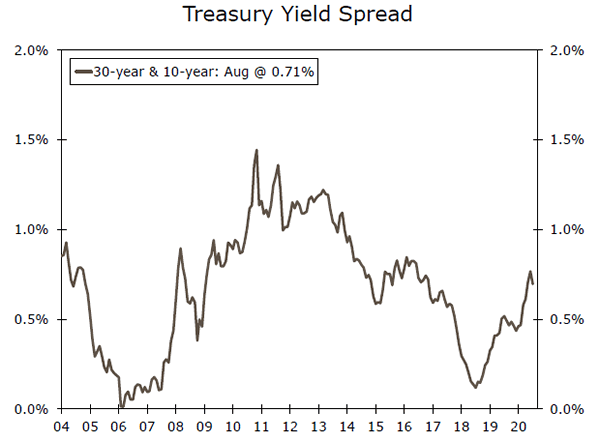
In that regard, a widely followed measure of inflation expectations, namely, the yield spread between the 10-year Treasury note and its inflation-protected counterpart, has trended higher over the past few months and is now back to the level that prevailed in February (middle chart). This so-called TIPS spread shows that fixed income investors essentially expect inflation to average roughly 1.7% per annum over the next 10 years. The yield spread between the 30-year bond and the 10-year note has also widened in recent months (bottom chart). Some of this spread widening at the long end of the curve may reflect unease with the long-term outlook for U.S. government debt. But it is also consistent with higher expectations of inflation down the road.
Unless governors re-impose restrictions that essentially lock down the economy, it seems that long-term rates have essentially reached bottom. That said, we do not look for them to snap higher anytime soon either. In our view, the economic recovery that is taking shape will continue, but we look for the unemployment rate to remain elevated through at least the end of next year. Consequently, the FOMC likely will remain on hold for quite some time. Until the Fed gets back into tightening mode, long-term rates likely will remain low.
Credit Market Insights
Lending to Weigh on Housing’s Boom?
As noted in U.S. Review and in our most recent Housing Chartbook, the housing market has been on fire. While a double digit unemployment rate and surging home sales seem incompatible, several explanations have been offered for the current divergence. That said, the concentration of job loss among those more likely to rent, pre-existing demographic trends supporting home buying and shifting preferences in the stay-at-home economy are all likely playing a role.
Though even if this robust demand persists, there are other channels through which the COVID crisis could limit the housing market’s upside. Mortgage lending, for instance has been complicated by economic volatility and changing debt relief policies. In March and April, mortgage credit availability, as tracked by the Mortgage Bankers Association’s credit availability index, collapsed. Some alternatives to the conventional mortgage even stopped being offered by many lenders. At this time, however, home sales were already hampered by lockdown measures. In the second quarter Senior Loan Officer Opinion Survey, banks reported tightening lending on residential real estate loans across the board, but this did not seem to weigh on home sales, which increased at a record pace as public health restrictions were lifted. Similarly, mortgage originations soared in the second quarter, but the median credit score of borrowers reached its highest level since 2000. Although lending has tightened, it has not been able to hold back the housing sector’s momentum.
Topic of the Week
Household Debt-At-Risk Amid Jobs Losses
The U.S. economy has added more than nine million jobs in the past three months, but payrolls today remain more than 8% below their February peak due to the 22 million jobs that vanished in March and April.
However, momentum in the labor market is slowing and delinquencies for some categories of debt are rising. To what extent are various categories of household debt-atrisk if it takes a prolonged time for individuals to find work?
In order to shed some light on this question, we conducted an analysis of different categories of household debt across income cohorts to estimate potential losses that could occur if workers remain unemployed for a prolonged period and are not able to service their debt. We explain the full methodology and framework for our analysis in a recent special report.
Our analysis suggests that the share of household debt at risk, although large in absolute dollar terms, likely does not present an existential risk to the overall financial system.
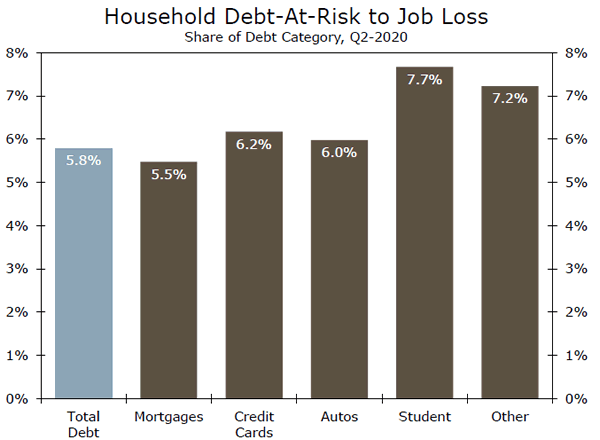
Our base-case scenario finds that the share of total household debt-at-risk totals roughly $800 billion, which is equivalent to approximately 6% of total household debt outstanding. But, there are also some mitigating factors that could reduce that amount.
By category of debt, the share of debt-at-risk is highest for student loans with about 8% of those loans at risk, followed by credit cards and auto loans (both roughly 6%). Mortgages are the least vulnerable according to our analysis with about a 5.5% share of debt outstanding at risk as a direct result of recent job losses.
Under a worst-case scenario, total household debt-at-risk balloons to more than $3 trillion, which would represent more of an existential risk to the financial system. But we suspect under such a scenario the government would provide some sort of policy support to reduce the risk of an outright implosion of the financial system.


