
We have revised our growth forecasts for the Australian economy in 2020 from minus 4.7% to minus 3.5%. Forecast growth in the September quarter has been increased from flat to 1.8% while growth in the December quarter is revised down from 2.8% to 2.2%.
For 2021 we have revised down growth from 3.0% to 2.5%. The unemployment rate that was expected to reach 8.5% by the end of 2020 has been lowered to 7.8%; while the forecast end 2021 rate has been held around 7.5%
The GDP Report this week signalled that the Australian economy had contracted by a record 7% in the June quarter. Consumption contracted by a spectacular 12.1% and hours worked fell by 9.8%. The fall in consumption explained 98% of the overall reduction in activity.
Despite that collapse in hours worked total nominal wage income ‘only’ fell by 2.5% and total nominal household income actually rose by 2.2%.
With a sharp fall in spending and an actual increase in incomes the savings rate rose to 19.8% from 6.0%, highlighting the significant improvement in household balance sheets which would be consistent with considerable pent up demand to spend.
In earlier recessions, a contraction in spending has been a voluntary decision associated with shocks to incomes and confidence. In this recession the contraction has been the result of government policy aimed at protecting Australians from the health risks associated with Covid-19.
On August 4, following the announcement of the imminent Stage 4 lockdown in Melbourne, Westpac revised down its national growth forecasts to include the expected impact of these measures on the Victorian economy as well as a likely spill over to confidence in the other states, most notably NSW which at the time was on the ‘edge’ with the potential for a material lift in virus cases (a risk that failed to materialise).
Actually,we had already been forecasting the 7% contraction in the June quarter but revised down growth in the September quarter to 0% to be followed by a strong rebound of 2.8% in the December quarter as Melbourne reopened.
On a state by state basis we forecast Victoria (24% of the national economy) to contract by 9% in the September quarter to be followed by a 6% recovery in the December quarter as the state moved towards a Stage 2 setting through the December quarter.
For the other states we emphasised the momentum which was apparent through June settling on 2% (September quarter); 2% (December quarter) for NSW (33% of the national economy); 3% and 1.5% % for QLD; SA; TAS ; NT (29%); and 4% ; 3% for WA(14%).
These are highly uncertain times and forecasting the impact of government restrictions on growth will always be an inexact science.
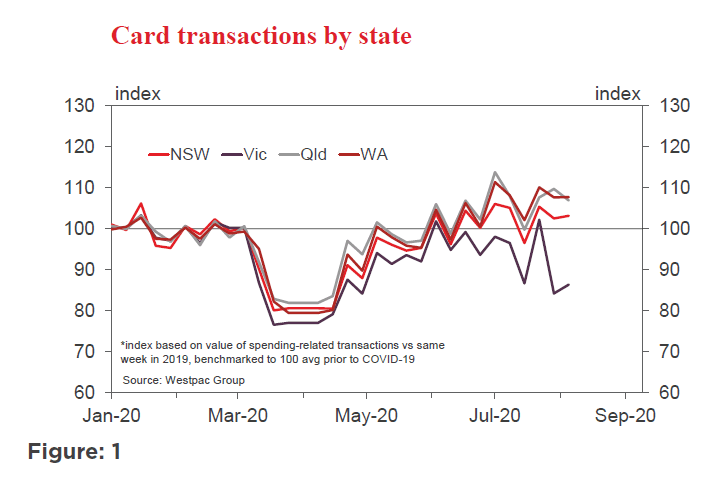
We have now seen high frequency data for Victoria for July and August. This data includes Westpac’s Card Tracker Index, which measures the turnover in various spending categories from Westpac’s millions of transactions on a daily basis. (Figure 1).
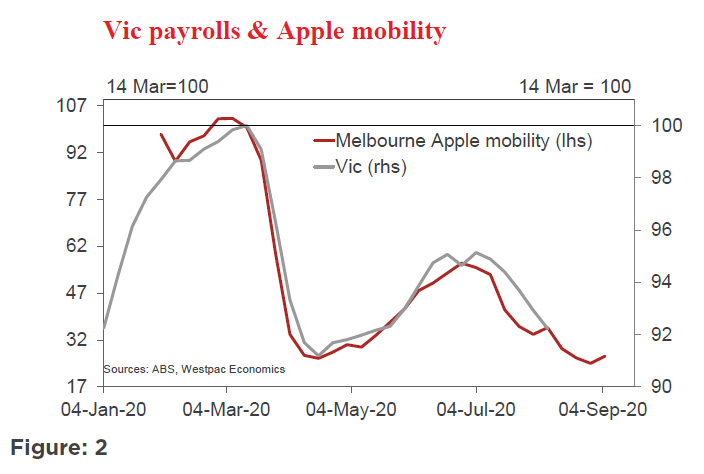
We also receive the Apple Mobility Indexes for each of the states. (see Figure 2 for Victoria), that has been providing a useful lead indication of jobs growth.
While there is a clear underperformance of the Victorian data relative to the other states it is not signalling a 9% fall in average activity in Victoria in the September quarter relative to the June quarter, which had already fallen significantly. The Mobility Index is sending a similar style signal about employment growth.
We also have ‘hard data’ for July. The ABS Labour Force Survey revealed a 1.3% lift in hours worked nationally in July, following a 4.2% increase in the month of June.
Our figuring points to hours worked in the September quarter increasing by around 2.8%.
Note that hours worked contracted by 9.8% in the June quarter while, output contracted by 7%. Clearly, the big swings in employment are occurring in the more job intensive sectors leading to larger swings in hours worked than output.
We have pared back the expected contraction in Victoria in the September quarter from 9% to 4% (still, possibly, on the conservative side). We have also lifted the growth profile for NSW in the September quarter from 2% to 3%( as early nervousness in the quarter is likely to have settled down) and QLD/SA/TAS from 3% to 3.5% while leaving the September forecasts for WA unchanged.
Those revisions boost our growth forecast for the September quarter from ‘flat’ to 1.8%.
That 1.8% lines up with our ‘top down’ assessment through the hours worked approach which we forecast to increase by 2.8%. Note that the relationship between hours worked and output in the September quarter is likely to broadly follow what we saw in the June quarter where output contracted by around 70% of the contraction in hours worked (7% compared to 9.8%).
Our explanation around the likely resilience of spending in Victoria in the September quarter to the Stage 4 lockdowns relies partly on what we saw in the June quarter where the savings rate lifted to 19.8%. Despite being locked down many Victorians have seen a substantial boost in available funds and, recently, have accessed more online facilities to support expenditure on household goods and those other forms of expenditure that have not been precluded by the lockdown. (note Figure 1).
And bear in mind that the ‘starting point’ for the level of spending in Victoria reflected the national 12.1% contraction in consumer spending we saw in the June quarter.
With the contraction in Victoria in the September quarter being milder than previously expected the rebound during the recovery phase in the December quarter will be more subdued. We have scaled back the recovery pace to 4% (from 6%), broadly equating to the forecast momentum in NSW in the September quarter.
Growth in the December quarter for Australia is therefore revised down to 2.2% from 2.8% previously.
Under our previous growth forecast we expected that, by end 2021, the Australian economy would be operating at around 1.7% below the activity levels in the December quarter of 2019.
Many disruptions to the economy will still be apparent in 2021. There is likely to be a lift in business failures once government and bank support packages have been withdrawn.
A recent survey from the Australian Bureau of Statistics found that 24% of those respondents who were receiving some form of support expected to close once the support terminated.
While structural change will generate new successful businesses the early stages of the changes will see net losses of firms; the retightening of insolvency laws will impact the more fragile businesses; some industries including tourism; travel; and education will not have recovered while the shock to population growth will impact construction.
Even the advent of a vaccine will not restore the economy to ‘normality’ immediately.
Consequently, we still consider it likely that the Australian economy will be operating below its pre-COVID level capacity (by around 1%) by the end of 2021.
We have lowered our 2021 growth forecast from 3% to 2.5%.
As discussed in the introduction, we expect the unemployment rate to be much lower than the 10%, by year end, which is currently forecast by the Reserve Bank.
Stronger underlying demand and a more modest rise in the participation rate are expected to be underpinned by stronger jobs growth to year’s end.
However, reflecting the expected difficulties in 2021, jobs growth is expected to undershoot output growth leaving the unemployment rate at 7.5% by end 2021


