U.S. Highlights
- Covid-19 infections are surging in much of the world, prompting new restrictions in Europe and dampening market sentiment early in the week.
- U.S. data painted a clear picture of pandemic life. Inflation pressures for services hard hit by social distancing have cooled notably.
- Meanwhile, American consumers continue to snap up goods that will help them to enjoy life at home. That strength in September retailing put markets in a better mood late in the week.
Canadian Highlights
- Covid-19 is spreading at an alarming rate in Canada. Financial markets reacted with mid-week volatility but recouped much of losses as the week came to a close.
- The impact of the virus was not seen in data due to its backward-looking nature. Manufacturing sales weakened in August, while housing sales activity continued to run hot in September.
- This month also saw CERB transition to new benefits that require recipients to look for employment. But, with the country firmly in the second wave, finding new work could prove to be a challenge.
U.S. – Global Infections Surge
Markets had a choppy week as infections surged in parts of the world, and uncertainty about the next round of stimulus continued. A strong retail report for September did put markets in a better mood on Friday.
Earlier in the week, the IMF released their updated global forecast. It emphasized that the recovery will be long, uneven and uncertain. Their forecast contraction for 2020 (-4.4%) is slightly smaller than expected back in June, but the rebound is also shallower. So long as the pandemic is controlled next year, it expects the global economy to rebound 5.2%. Unfortunately, at the moment in many areas of the globe, the pandemic is far from controlled.
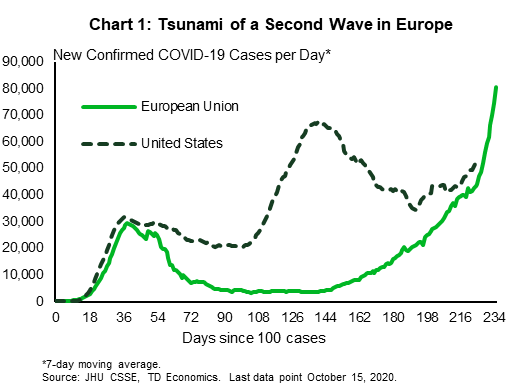
Infections have been on the upswing in Europe, where daily infections are well above their spring peaks, and have recently surpassed the U.S. (Chart 1). As a result, countries have imposed new restrictions to turn the tide, from curfews in France’s largest cities, to curbs on socializing indoors in London. New restrictions are more targeted relative to the spring, and therefore, the economic impact is likely to be much less severe. However, it still casts a pall over the outlook for Europe.
In the U.S., the latest inflation report should quiet the stagflation chatter that had emerged after a couple of hot months for core inflation. Both headline and core CPI rose a middling 0.2% in the month of September. However, removing an outsized 6.7% month/month increase in used vehicle prices leaves core inflation flat on the month.
During the pandemic, the prices of many goods have risen sharply. But services inflation has ebbed from 3% year-on-year in February to 1.9% in September, as demand has been hard hit by social distancing. Services account for 63% of the CPI basket, so the cooling heavily influences the overall trend. You have to go back to 2011 to see services inflation pressures as soft as it is today.
The good news came from consumers, who ramped up their spending at retailers in September. Retail sales rose 1.9% on the month, driven by a big jump up in clothing purchases (+11% m/m), department stores (+9.7% m/m), sporting goods, hobby, book and music stores (+5.7% m/m) and vehicle sales (+3.6% m/m). There is some speculation that the strength in clothing may be due to the delayed back-to-school in many parts of the country. Even removing that influence, it was a strong month, and puts some upside risk to our forecast for consumer spending in the third and fourth quarter.
Like price patterns, the trend in retail sales also tells the tale of pandemic life (Chart 2). The hardest hit area is restaurants and bars, which have faced closures and restrictions. Since most consumers are staying home a lot more, there is also less of a need to get dressed up to go out, and even with September’s jump, clothing sales are below their pre-crisis level, as are department stores which would include a fair amount of clothing purchases. The strongest areas, apart from online shopping in general, are for things that make staying home a bit more appealing, such as new gym equipment or other hobbies and materials for home and garden improvement projects.

Canada – Second Wave Likely To Weaken The Recovery
Covid-19 continued to spread at an alarming rate this week in Canada (Chart 1). Daily cases averaged almost 2,300 up from 2,200 the week before.
Financial markets took note of the pick-up in cases, leading to a bout of mid-week volatility as participants grew fearful of governments imposing more restrictions on the economy. However, losses were recouped later in the week and at the time of writing, the TSX was only 0.2% below close last week. Oil prices saw a similar trend emerge, but as the week ended sat at $40, little changed from last Friday.
The impact of the second wave was not seen in economic data released for the week, due to its backward-looking nature. We are still receiving data points from summer months, but even these are pointing to a slowing recovery. For instance, following three consecutive monthly increases, manufacturing sales declined by 2% month-on-month in August and forward-looking indicators are providing mixed-signals. New and unfilled orders were down, but at the same time, solid Markit PMI readings in Canada and the U.S. suggest continuing improvements in manufacturing sales. Rising caseloads could tilt the scales however, weighing on demand growth and weakening activity in the manufacturing industry.
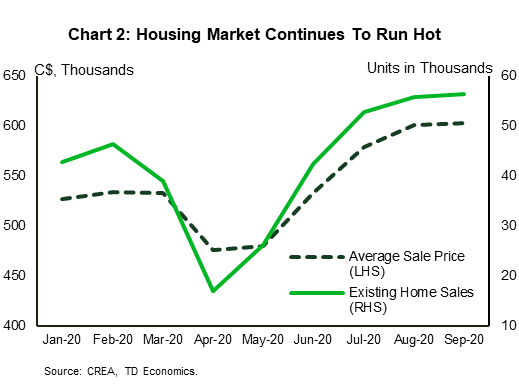
Unlike manufacturing sales, the housing market remains on a hot streak. Existing home sales rose for the fifth straight month, increasing 0.9% month-on-month and reaching an all-time sales record in September (Chart 2). Sales are now 20% above pre-pandemic levels. In addition, prices moved up, rising 0.4% to a record $604,000 last month. Meanwhile, new listings pulled back 10.2%, almost completely reversing its gain in August and making for very tight market conditions. As a result, the sales-to-new listings ratio posted its third highest reading in the history of the series of 77.2 in September. Almost every province was in sellers’ territory last month.
The housing market continues to be one of the brightest spots in the Canadian economy through this pandemic. It also is a reflection of the uneven impact of the health crisis. Higher wage workers have been relatively less affected by the pandemic and are able to contribute to a sizzling housing market, while a large proportion of lower wage workers have yet to find new employment.
This month saw the Canada Emergency Response Benefit (CERB) program transition to expanded employment insurance and the Canada Recovery Benefit (CRB). Individuals enrolled in the programs will see no change to their weekly income supports ($500/week) but will have to look for work to remain eligible. Finding new employment may be no easy task, however. Especially for those with previous experience in “high-touch” industries (i.e. food and accommodation services). The second wave has already forced Ontario and Quebec to shut down businesses like restaurants, bars, and gyms for 28 days. Only with the virus under control, can provinces safely reopen the entire economy. Until then, the next phase of the recovery will be slow and choppy.

Canada: Upcoming Key Economic Releases
Canadian Business Outlook Survey – Q3
Release Date: October 19th, 2020
The Business Outlook Survey (BOS) and accompanying Canadian Survey of Consumer Expectations (CSCE) will give the Bank of Canada a key update on business and household sentiment heading into the October MPR. The Q3 edition of the BOS should be quite a bit more upbeat than the summer survey was; economic data has routinely surprised to the upside since May, and by the time the survey was conducted (late August and early September) the economy had already unwound roughly two-thirds of total job losses. We also expect to see the better data reflected in improving consumer sentiment in the CSCE, particularly with regard to expectations for spending growth and house price growth. Concerns of the COVID pandemic will nonetheless be evident in both documents, and we will be particularly interested to see if there have been material shifts lower in inflation expectations.
Chart: Canadian business outlook survey

Canadian Consumer Price Index – September
Release Date: October 21st, 2020
Previous: -0.1% m/m, 0.1% y/y, Index: 137.0
TD Forecast: -0.3% m/m, 0.3% y/y, index: 136.6
Consensus: NA
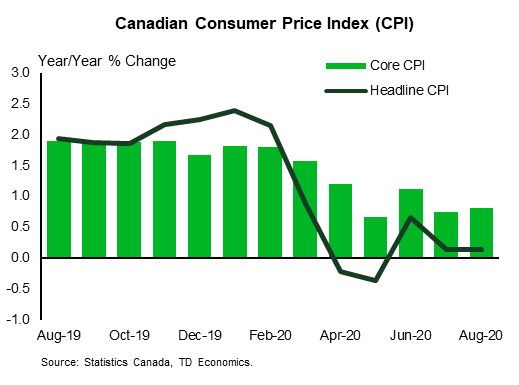
TD looks for inflation to rise to +0.3% y/y in September reflecting base effects, as monthly inflation is forecast at -0.3% m/m compared to last September’s print of -0.4%. Energy prices will remain a drag on headline inflation, subtracting roughly 0.4 p.p. from the y/y figure as gasoline prices remain approximately 10% below their levels from last September. Negative seasonal effects will be evident in the monthly data, with ex-food-and-energy prices expected to decline by 0.2% m/m and food prices dropping by a full percentage point, but the disruptions caused by the COVID-19 pandemic implies a higher than normal degree of uncertainty around typical seasonal patterns. Our forecast implies CPI inflation of +0.2% y/y for Q3 as a whole, which is slightly lower than the BoC’s central scenario from July which looked for inflation to sit at +0.4% y/y in the third quarter. We look for the core CPI measures to hold around their current average of 1.7% y/y, though the persistence of slack in the economy suggests that risks will skew towards lower core CPI metrics.
Chart: Canadian CPI
Canadian Retail Sales – August
Release Date: October 21st, 2020
Previous: +0.6%, ex-auto: -0.4%%
TD Forecast: -0.4%, ex-auto: +0.6%
Consensus: NA, ex-auto: NA
Retail sales are forecast to fall by 0.4% m/m August, marking the first decline since April and reversing most of July’s tepid 0.6% rise. Our forecast is weaker than Statistics Canada’s flash estimate for a 1.3% m/m increase, but it’s hard to be too concerned about the pullback as a) retail activity has been back above its pre-pandemic level since June, and b) our forecast still implies a 2.4% increase relatively to August 2019. Moreover, the slight negative print largely reflects a softer month for the auto sector, as we look for a modest increase in ex-auto & gasoline sales. Google mobility data also showed an uptick in traffic at retailers, which further supports a positive print for core retail sales. Real retail sales are expected to print roughly in line with the headline nominal figure. house price growth. Concerns of the COVID pandemic will nonetheless be evident in both documents, and we will be particularly interested to see if there have been material shifts lower in inflation expectations.