
U.S. Highlights
- Covid-19 infections continued to rise this week, nearing record highs set in July. Concerns regarding this trend weighed on markets, but progress on a new stimulus package helped improve the mood later in the week.
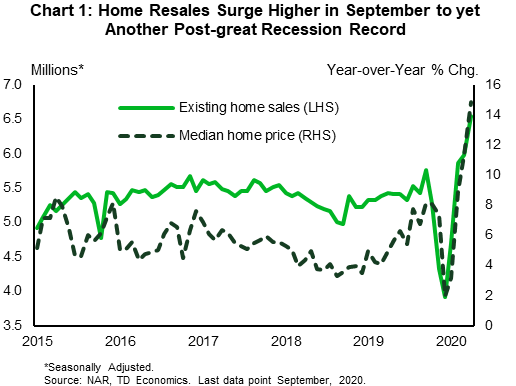
- Positive housing reports reinforced the sector’s position as a bright spot in the U.S. economy. Existing home sales soared 9.4% in September, blowing expectations out of the water, while price growth accelerated further.
- Fast-rising prices are good news for builders who have recognized the need to build more homes. Housing starts also pushed higher in September (+1.9%), with gains concentrated in the single-family segment.
Canadian Highlights
- Retail sales edged up in August, but the recovery is petering out. Renewed restrictions and exhausted pent-up demand are likely to keep a lid on sales growth going forward.
- Business sentiment and consumer expectations have improved in the third quarter, but remain well below historical standards.
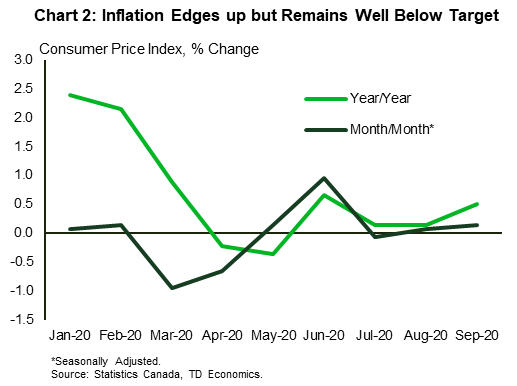
- At just 0.5% consumer price inflation remains below target and is showing little signs of breaking out any time soon, although unprecedented monetary and fiscal support has allayed deflationary fears for now.
U.S. – Housing Market Remains A Bright Spot
Markets continued their choppy ride this week, as investors weighed a rising trend in new infections against hopes for fiscal stimulus. Signs of progress on the latter helped put markets in a better mood later in the week, while a strong housing report provided an added fillip.
The September existing home sales report reinforced the notion that the housing market remains a bright spot, even as most sectors of the economy continue to struggle under the weight of the pandemic. After gains moderated in the two months prior, resale activity surged by 9.4% in September, blowing expectations out of the water. Sales are now at a new post-Great Recession high and nearly 14% above their pre-pandemic level (Chart 1). Details from the report suggested that the purchasing of homes in vacation destinations – a trend that appears to have been supported by an improved flexibility of working from home – played a part in boosting overall sales. While the latter are up 21% year-over-year (y/y), sales in vacation destination counties accelerated over the summer and are up 34% y/y according to the National Association of Realtors.
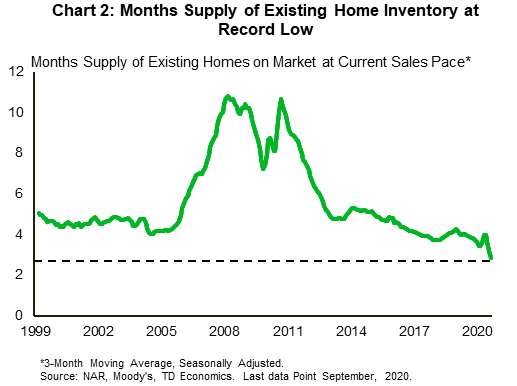
With low mortgage rates and a still-improving labor market, we expect resale activity to continue grinding higher, but at a more moderate pace. A sharp acceleration in home price growth is eroding affordability and a record-low supply of housing means that markets will remain tight. Housing inventory now sits at just 1.47 million or a record low of 2.7 months at the current sales pace (Chart 2). As a result, the median existing home price has accelerated to a sharp 15% y/y – the fastest pace since the “frothy” days of 2005.
Low inventory and fast-rising prices are good news for homebuilders who have recognized the need to build more homes. More shovels were put to the ground in September, with housing starts up 1.9% on the month. Gains were concentrated in the single-family segment, while multi-family starts fell for the second consecutive month – a trend that seems to align with a tilt to less-denser suburban living as a result of the pandemic. Added supply in the new home market would help by enabling move-up buyers to acquire new homes, thereby easing the gridlock in the resale market. That said, the support from this channel will take time.
The few remaining indicators pointed to a slowing economic recovery outside housing. Initial jobless claims fell by 55k to 787k last week – better than expected, but still slightly higher than at the start of the month. Meanwhile, continuing claims from all programs eased to a still-elevated 23.2 million at the start of the month (data is delayed). Anecdotal evidence from the Beige Book also pointed to a “slight to modest” pace of growth this fall. Coupled with the fact that the virus’ spread is nearing a record high, these elements support the case for added fiscal stimulus.
The outcome of the election, which is now a little over a week away, will have important implications for the economy (see here) and the amount of fiscal stimulus. So far, Joe Biden is leading in the polls. But, judging from what happened in 2016, it’s worth continuing to take these numbers with a grain of salt.
Canada – Retail Sector’s Comeback Has Fizzled Out
Financial markets had a difficult week. The S&P/TSX Composite registered a 0.9% drop on the week (as of writing), amid losses in the technology, utility and mining sectors. Elsewhere, oil markets seesawed this week. WTI ended down 0.8% as of writing at around U.S. $40.5, as demand worries overshadowed a decline in U.S. crude supplies.
In terms of economic data, August retail sales edged up 0.4% on the month, the smallest monthly increase since the onset of the recovery (Chart 1). Retail sales are now 3.5% above their year-ago level, but the latest print disappointed both the median analyst forecast and Statistics Canada’s preliminary forecast for a 1.1% increase. The moderation in retail sales growth is likely to continue as post-lockdown pent-up demand appears to be exhausted. Rising new cases paired with renewed restrictions will also continue to hinder sales in the near-term. Statistics Canada’s flash estimate points to a flat reading in September.
In a separate release, August wholesale sales advanced for a fourth consecutive month, albeit much slower than the gains seen in early summer. Sales were up in both real and nominal terms, with a 0.3% increase month-on-month bringing nominal sales 1.7% above pre-pandemic levels. However, digging deeper into the data shows continued weakness in some subsectors – motor vehicles, household goods, and food and beverages – where sales were still below their pre-pandemic levels.
Meanwhile, the Bank of Canada’s Business Outlook Survey and Survey of Consumer Expectations for the third quarter showed a pickup in business sentiment and expectations. Despite the improvement, firms continue to report weak and uneven sales growth. And while firms have increased hiring and business investment, both remain weak amid high uncertainty, subdued demand and cashflow concerns. On the consumer side, expectations for labor market outcomes, income, and spending all improved, but remain well below historical standards. It is important to note that these surveys were conducted before the second wave of infections hit in the latter half of September. Business sentiment is likely to have deteriorated since then.
In other news, CPI inflation rose 0.5% year-on-year in September, up from 0.1% in August and a touch above the median consensus estimate of 0.4% (Chart 2). Prices rose in six of the eight major categories, with the fastest increase seen for shelter (1.7%) and health and personal care (up 1.6%). Meanwhile, the two categories with price declines were clothing and footwear (-4.1%) and recreation, education and reading (-1.2%). Inflation remains far from the Bank of Canada’s target and is showing little signs of breaking significantly higher, although unprecedented monetary and fiscal support is to thank for allaying near-term deflationary fears.
Elsewhere, the Teranet-National Bank National Composite Home Price Index registered yet another strong gain in September, increasing by 1.1% on the month. All 31 markets included in the index, including 11 major cities posted gains – the first across-the-board monthly gain since the index began tracking the current sample of markets in 2009. Price gains in cities around Toronto were higher than in the Greater Toronto Area itself, further giving credence to the view that city dwellers are moving to the suburbs for more space amid the virus.

U.S: Upcoming Key Economic Releases
U.S. Real GDP – Q3
Release Date: October 29, 2020
Previous: -31.4%
TD Forecast: 30.0%
Consensus: 32.0%
Real GDP appears to have surged in Q3, albeit after a larger plunge previously. The rebound likely extended to consumer spending, residential investment and business investment. Net exports probably subtracted from growth, with imports up much more than exports. Our 30% q/q AR forecast for overall real GDP implies a net decline of 4.0% since Q4 of 2019, identical to the peak-to-trough decline in the severe 2008-09 recession. Meanwhile, timely data are pointing to slowing/stalling in the current quarter.

U.S. Personal Income & Spending – September
Release Date: October 30, 2020
Previous: PCE deflator: 0.3% m/m, 1.4% y/y; core PCE deflator: 0.3% m/m, 1.6% y/y
TD forecast: PCE deflator: 0.1% m/m, 1.5% y/y; core PCE deflator: 0.1% m/m, 1.7% y/y
Consensus: PCE deflator: 0.2% m/m, 1.5% y/y; core PCE deflator: 0.2% m/m, 1.7% y/y
Consumer spending probably finished Q3 with a solid gain, consistent with the retail sales data that have already been reported. Real spending appears to have risen at about a 39% q/q annual rate in Q3 as a whole, helped by fiscal stimulus as well recovery in the labor market. Stimulus is starting to fade, however, and it will fade a lot more in coming months unless a new fiscal package is enacted in Washington. CARES Act provisions boosted the level of personal income by 4.7 percentage points in August.

Canada: Upcoming Key Economic Releases
Bank of Canada Rate Decision*
Release Date: October 28, 2020
Previous: 0.25%
TD Forecast: 0.25%
Consensus: 0.25%
TD looks for the Bank of Canada to keep the overnight rate at 0.25% in October while standing pat on any changes to forward guidance or QE. Despite the unchanged policy mix, the meeting should still bring some noteworthy developments; the October MPR will offer a more detailed analysis of the supply shock from COVID-19, along with quarterly forecast updates that include a substantial mark-to-market upgrade on 2020 GDP. We expect the policy statement to maintain a cautious tone, reflecting the Bank’s view for a drawn-out recovery and uncertainty around second wave of COVID, while noting that the recovery to date has been stronger than anticipated and flagging the supportive role of fiscal stimulus. We do not expect the Bank to show any inclination towards negative rates following Governor Macklem’s recent mention of unconventional policy options, but we see a pivot to yield curve control as a material risk to next week’s meeting.

Canadian Real GDP – August
Release Date: October 30, 2020
Previous: 3.0%
TD Forecast: 0.8%
Consensus: NA
TD looks for industry-level GDP to rise by 0.8% m/m for the fourth month of expansion following the historic plunge in Mar/Apr. This is roughly in line with flash estimates for 1.0% and consistent with the deceleration observed across other economic data. With the recovery stagnating in some sectors, we expect a more mixed performance across industry-level GDP; contracting manufacturing sales and oil sands production will weigh the goods-producing sector, along with sluggish retail and wholesale trade for services. On a brighter note, August was another blistering month for residential construction and resale activity, while labour market data showed a strong performance across education services ahead of the return to school. Industry-level GDP growth of 0.8% m/m would leave output 5.0% below levels from February and maintain a low bar for 45% annualized growth in Q3, although there is considerably more uncertainty around Q4 given the slowing recovery and resurgence in COVID infections across Canada.


