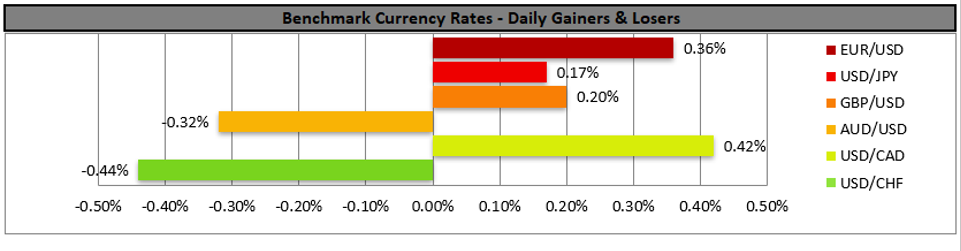
The USD seems to be heading for the worst week in the month today as the markets seem to be characterized by a positive mood, probably spurred also by the change of government and its big spending plans. Against EUR, the greenback is in the back foot as the common currency may also have gotten some support from ECB’s interest rate decision to keep its monetary policy steady without touching neither the rates nor its PEPP asset buying program, keeping a wait and see position as mentioned yesterday. It should be noted that the risk on mood characterizing the market seem to have erased prior week’s gains and pushed some US stockmarket indices to even higher record levels, confirming also the market’s preference for risker assets. Should the market’s risk on mood be continued we may see the USD suffering further losses, while traders could be eyeing today’s financial releases with the preliminary PMIs for January in Europe and the US being predominant.
EUR/USD continued to rise breaking the 1.2155 (S1) resistance line, now turned to support. As per yesterday’s analysis of the pair, given that EUR/USD was able to break the upward boundary, of its sideways movement we switch our rangebound movement bias in favour of a bullish outlook. The upward trendline which is still forming and was incepted in the 20th of January seems to guide the pair, while the RSI indicator below our 4-hour chart shows an advantage for the bulls. On the other hand, a correction lower could be in the cards for pair after the steep rise. Should the bulls maintain control over the pair’s direction we could see EUR/USD aiming if not breaking the 1.2215 (R1) resistance line. Should the bears take over, we could see the pair breaking the prementioned upward trendline, 1.2155 (S1) support line and start aiming for the 1.2100 (S2) level.
Gold eases as yields tick up
Gold weakened somewhat during the late American session yesterday and the Asian session today breaking the negative correlation with the USD, with analysts pinpointing a slight rise of the US yields as a possible reason. Worries for the US employment market seem to be ongoing, despite a modest drop of the initial jobless claims figure last week, while increased economic activity seems to be present given yesterday’s financial releases. Also focus of Gold traders remains on the $1.9 trillion stimulus relief proposed by U.S. President Joe Biden as disagreements seem to revive in Washington threatening the size and the timing of such an additional stimulus to revive the world’s largest economy from the effects of the pandemic. Should the negative correlation between USD and gold revive today and a risk on sentiment be on display, we may see gold’s prices regaining some ground.
XAU/USD retreated just before reaching the 1877 (R1) resistance line yesterday, cancelling our bullish bias, hence we temporarily switch our outlook in favor of a sideways movement, until the precious metal decides on the direction of its next leg. Please note that the RSI indicator is just above the reading of 50, implying a rather indecisive market, maybe with a small advantage for the bulls. Should the precious metal actually find fresh buying orders along its path, we may see its prices, breaking the 1877 (R1) resistance line and start aiming for the 1907 (R2) level. Should a selling interest be displayed by the markets we could see gold’s prices, breaking the 1850 (S1) support line and aim for the 1824 (S2) support level.
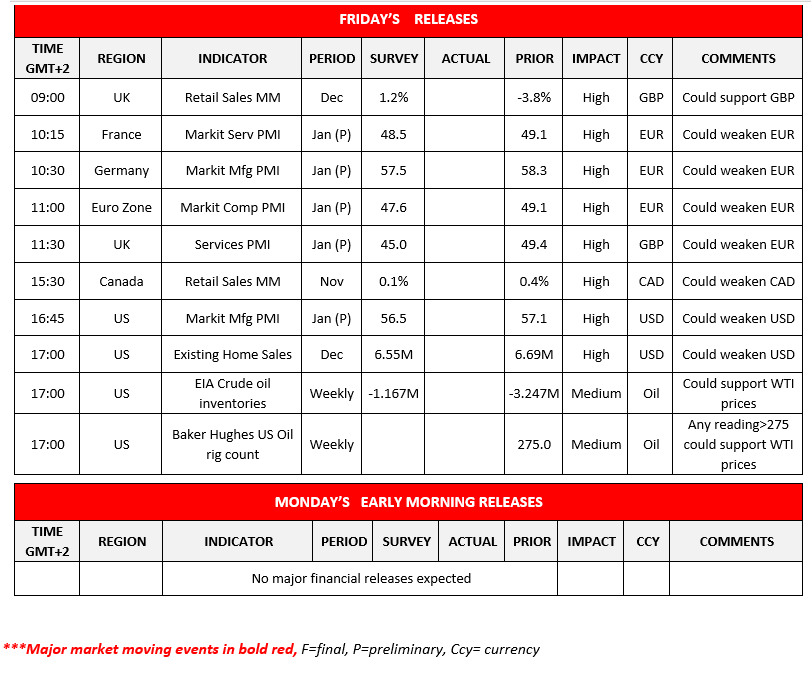
Other economic highlights today and early Tuesday:
Today we highlight the release of January’s preliminary Markit PMIs for France, Germany, Eurozone, UK and the US as the main releases. Also of interest are UK’s retail sales for December and Canada’s retail sales for November, while in the American session we also get the US existing home sales for November. Oil traders could be keeping an eye out for the weekly EIA crude oil inventories figure as well as the Baker Hughes oil rig count as both could cause some volatility for oil prices.
EUR/USD H4 Chart
Support: 1.2155 (S1), 1.2100 (S2), 1.2050 (S3)
Resistance: 1.2215 (R1), 1.2285 (R2), 1.2350 (R3)
XAU/USD H4 Chart
Support: 1850 (S1), 1824 (S2), 1800 (S3)
Resistance: 1877 (R1), 1907 (R2), 1930 (R3)