
U.S. Highlights
- The week’s data confirmed that the U.S. economy continued to make progress early in 2021.
- That progress looks likely to get a substantial shot in the arm from the $1.9 trillion American Rescue Plan in the coming weeks. We have upgraded our U.S. forecast to include the impact of the plan.
- Retail sales and the housing market continued to show strength in January, as consumers’ preference for all things “home” remained well entrenched.
Canadian Highlights
- It was an eventful week as mixed economic data weighed on financial markets and oil prices went on a rollercoaster ride due to the Texas winter storm.
- Manufacturing and retail sales suffered setbacks in December as a result of the continuing spread of the virus and tightening restrictions. This should prove temporary as provinces gradually ease restrictions in upcoming months.
- Canada’s housing market has been running hotter than hot so far through the pandemic. Home sales and prices moved further into uncharted territory in January.
U.S. – Economy Progresses in January
Overall it was mixed news week for financial markets, from the deep freeze in the southeast and devastating blackouts in Texas, to generally positive economic data. Generally, the U.S. economy continues to make progress. Industrial production picked up in January, and both the Empire and Philly Fed manufacturing indices confirmed resilience in the manufacturing sector.
That progress looks set to get a substantial shot in the arm. With the impeachment trial over, House Speaker Pelosi expects a vote on President Biden’s American Rescue Plan by the end of next week. Given the high likelihood of passage, we have updated our U.S. forecast to include it (see update). In combination with the $900 billion package in late 2020, the lift to growth is substantial, adding over 1.5 percentage points to real GDP growth over the course of 2021.
January’s retail sales report provided evidence that Keynesian economics works. If governments deposit money in Americans’ accounts, they will spend it. Retail sales rebounded strongly in January, up 5.3% month-on-month, well above market expectations for a 1.1% increase. This is the first month of growth since September, as the rising numbers of Covid-19 infections and waning government income support programs dampened momentum in the final months of last year.
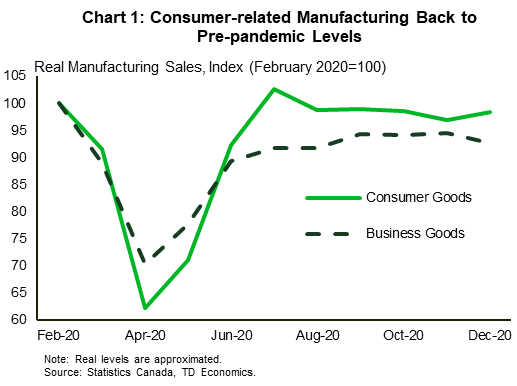
Gains at retailers were broad based. Sales were strongest at furniture and electronics stores (+13.1% m/m), non-store retailers (+11% m/m), sporting goods & music stores (+8.0% m/m) and food services & drinking places (+6.9% m/m). Nearly a year from the start of the pandemic, the change in sales by segment tells its story. Americans have spent more time at home than they ever imagined and are spending more on things that help them enjoy their confinement (Chart 1). Staying at home clearly doesn’t require getting dressed up, with sales at clothing stores down sharply.
After such a strong January, some weakness in February retail sales would not be surprising. Still, we expect a strong quarter for consumer spending given the healthy starting point and an increasing number of jurisdictions lifting restrictions as Covid-19 case counts fall. In addition to the latest round of assistance from Washington, consumers are sitting on approximately $1.6 trillion in excess savings from 2020, presenting upside risk to the spending outlook.
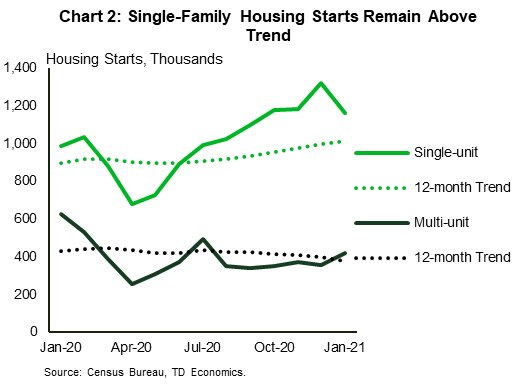
As consumers focus their spending on the home, the housing market has been another area of strength. Housing starts gave back some of their gains in January, but the trend remains strong, particularly for single-family homes (Chart 2). The permits data suggests the lull should be temporary, with authorizations up sharply on the month. Single-family home construction, in particular, has been re-energized during the pandemic. This is likely due to a combination of low interest rates, homebuilder confidence in the durability of demand for lower-density housing, and potentially greater availability of workers. While we expect some deceleration from the recent vigorous pace of housing starts aver the coming months, our forecasted level of construction is higher than it was a year ago.

Canada – Hotter Than Hot Housing Activity
It was an eventful week this week. Mixed economic data weighed on financial markets, with the S&P/TSX composite index down 0.6% from close last week. Meanwhile, oil prices went on a rollercoaster ride, first rising as the Texas winter storm raised concerns of lower near-term production. Then, dropping due to worries of weak demand from U.S. oil refineries. At the time of writing, the WTI price of oil was $60, roughly unchanged from last Friday.
Zooming out, oil prices have been on an upswing this year. Supply-side constraints, and stronger global demand have lifted prices 25% since December, leading to rising inflationary pressures. The consumer price index rose 0.4% m/m in January, and energy prices were a key contributor. Most other categories also saw price increases. Even still, core CPI inflation (excluding the most volatile components) only edged up to 1.6% y/y last month (December: 1.5%). As long as the health crisis is crimping demand, inflation is likely to be subdued.
The adverse impacts of the pandemic were also reflected in December economic data. Both manufacturing and retail sales tumbled in the month, declining 4% and 3.6% respectively. In manufacturing, only nine of the 21 industries posted increases in shipments, with the weakness mainly concentrated in industries geared towards businesses. Consumer-oriented manufacturing, on the other hand, has recovered close to pre-pandemic levels (Chart 1).
Resilient consumer demand was unable to lift the retail sector, however. Rising caseloads and tightening restrictions resulted in sales declining in nine out of 11 subsectors in December. Moreover, sales were down in every province for the first time since April. Statistics Canada estimated that the decline extended into January, with sales anticipated to decline by 3.3%. If this comes to pass, it will wipe out all gains since strict lockdowns ended last spring.
The setback should prove temporary. Cases are trending down and provinces are gradually relaxing restrictions. Consumers also have the funds to spend as the economy opens up. As we detailed in a recent report, households have amassed around $200 billion in additional savings through 2020 and are continuing to save at a historically elevated rate. If Canadians opt to unleash a portion of these savings, it could turbocharge the recovery. Consumption growth could be two to three percentage points higher than our baseline forecast of 5% over 2021 and 2022.
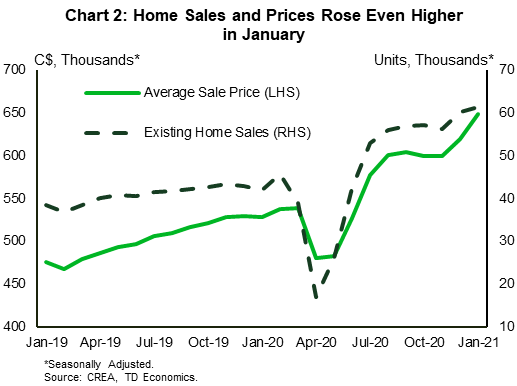
In the meantime, some of this cash is flowing into housing activity. Indeed, the red-hot housing market continued to rack up gains in January. Existing home sales and prices both moved higher, and now stand in uncharted territory (Chart 2). Compared to a year ago, existing home sales are up 46.2%, while prices are up 22.8%. A number of factors, including low mortgage rates, a race for space, and a fear of missing out, are likely driving these advances. At some point, the frenzy will die down and rising mortgage rates, limited supply and diminished affordability will cool the market. As of now however, there’s no clear indication of any slowing in Canada’s housing market.
U.S: Upcoming Key Economic Releases
U.S. Personal Income & Spending – January
Release Date: February 26
Previous: Spending: -0.2% m/m; Income: 0.6% m/m
TD Forecast: Spending: 2.7% m/m; Income: 10.0% m/m
Consensus: Spending: 1.3% m/m; Income: 10.0% m/m
A surge in consumer spending in January has already been signaled by the retail sales report. Personal income likely rose even more than spending, lifted by the second round of individuals’ stimulus payments. Core PCE inflation appears to have been relatively strong as well, mainly due to an adjustment to Medicare payment rates and an equity-market-related surge in portfolio management fees. Those sources of strength should probably not be extrapolated, but the 12-month change in core PCE likely rose to 1.6% from 1.5%.


