US stockmarkets rallied yesterday, with the Dow Jones and the S&P 500 reaching new record highs, while Nasdaq also was on the rise, as financial data in the US implied a quicker than expected recovery of the US economy. Specifically, the ISM non-manufacturing PMI for March outperformed market expectations, implying that economic activity in the sector has expanded in a faster rate than expected for the month. On the other hand, the factory orders growth rate for February declined into the negatives yet was overshadowed by the ISM PMI release. At the same time the USD tended to weaken against a number of its counterparts possibly experiencing safe haven outflows, given the risk on turn of the markets after the Easter weekend. The weakening of the USD allowed gold’s prices to progress higher, given also that US yields were on the retreat, as the 10 year yield reached 1.69%, providing ample of firepower for Gold’s bulls. On the fundamental level, US Treasury Secretary Yellen signalled the end of US isolation, making the case for an effectively global corporation tax rate yet the slight rise of Coronavirus cases in the US tends to feed some worries. We expect fundamentals to play a key role today given the lack of high impact financial releases.
Dow Jones continued to be on the rise yesterday breaking the 33500 (S1) resistance line, now turned to support. We tend to maintain a bullish outlook for the index as long as it remains above the upward trendline incepted since the 1st of April. We must note though that the RSI indicator below our 1-hour chart has clearly surpassed the reading of 70 and may be implying that the index is overbought. Should the bulls maintain their control over the index’s direction, we may see Dow Jones aiming if not breaking the 33800 (R1) resistance line in search of greener pastures. Should the bears take over, we may see Dow Jones breaking the prementioned upward trendline, the 33500 (S1) support line and aim for the 33200 (S2) level.
Oil prices drop on demand worries
Oil prices fell yesterday as worries for the demand outlook of the black gold tended to increase, while at the same time the markets kept in mind OPEC’s announcement to ease some output cuts from May to July. Specifically, the rise of the coronavirus cases in Europe, India and Canada tended to shroud the prospects of the global economic recovery, despite the US economy recovering faster than expected and China being at rather healthy levels. On the supply side OPEC had announced last week that the production is to rise from May to July, while Iran has reportedly boosted exports to China despite the sanctions imposed. WTI prices recovered somewhat due to the weaker USD, yet should market worries intensify, we may see oil prices dropping once again.
WTI dropped yesterday and during the American session broke the 59.00 (S1) support line aiming for the 57.20 (S2) level, yet later on recovered some of the lost ground resurfacing above the S1. For our bias in favor of a sideways bias to change we would require the commodity’s price action to break clearly the 59.00 (S1) support line. It should be noted though that there may be some bearish tendencies present given that the RSI indicator below our 4-hour chart, is below the reading of 50. Should a selling interest be displayed by the markets, we may see WTI prices breaking the 59.00 (S1) support line and aim for the 57.20 (S2) support level which reversed the pair’s downward motion on the 23rd of March. Should the commodity’s prices find buying orders along their path, we may see WTI aiming if not breaking the 61.15 (R1) resistance line, which forms the upper boundary of its sideways motion.
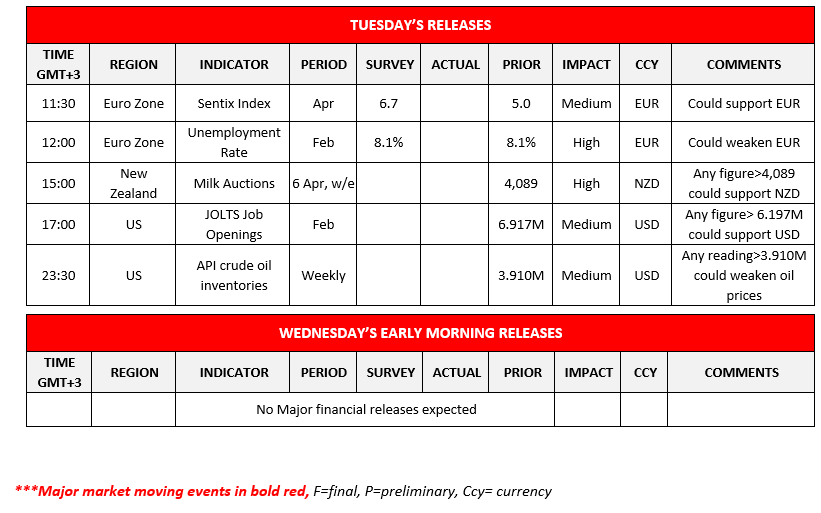
Other economic highlights today and early Tuesday:
In today’s European session we note from the Eurozone the unemployment rate for February as well as the forward looking Sentix Index for April and for Kiwi traders the milk auctions figures. In the American session we get from the US the JOLTS job openings for February and later on the API weekly crude oil inventories figure.
US 30 Cash H1 Chart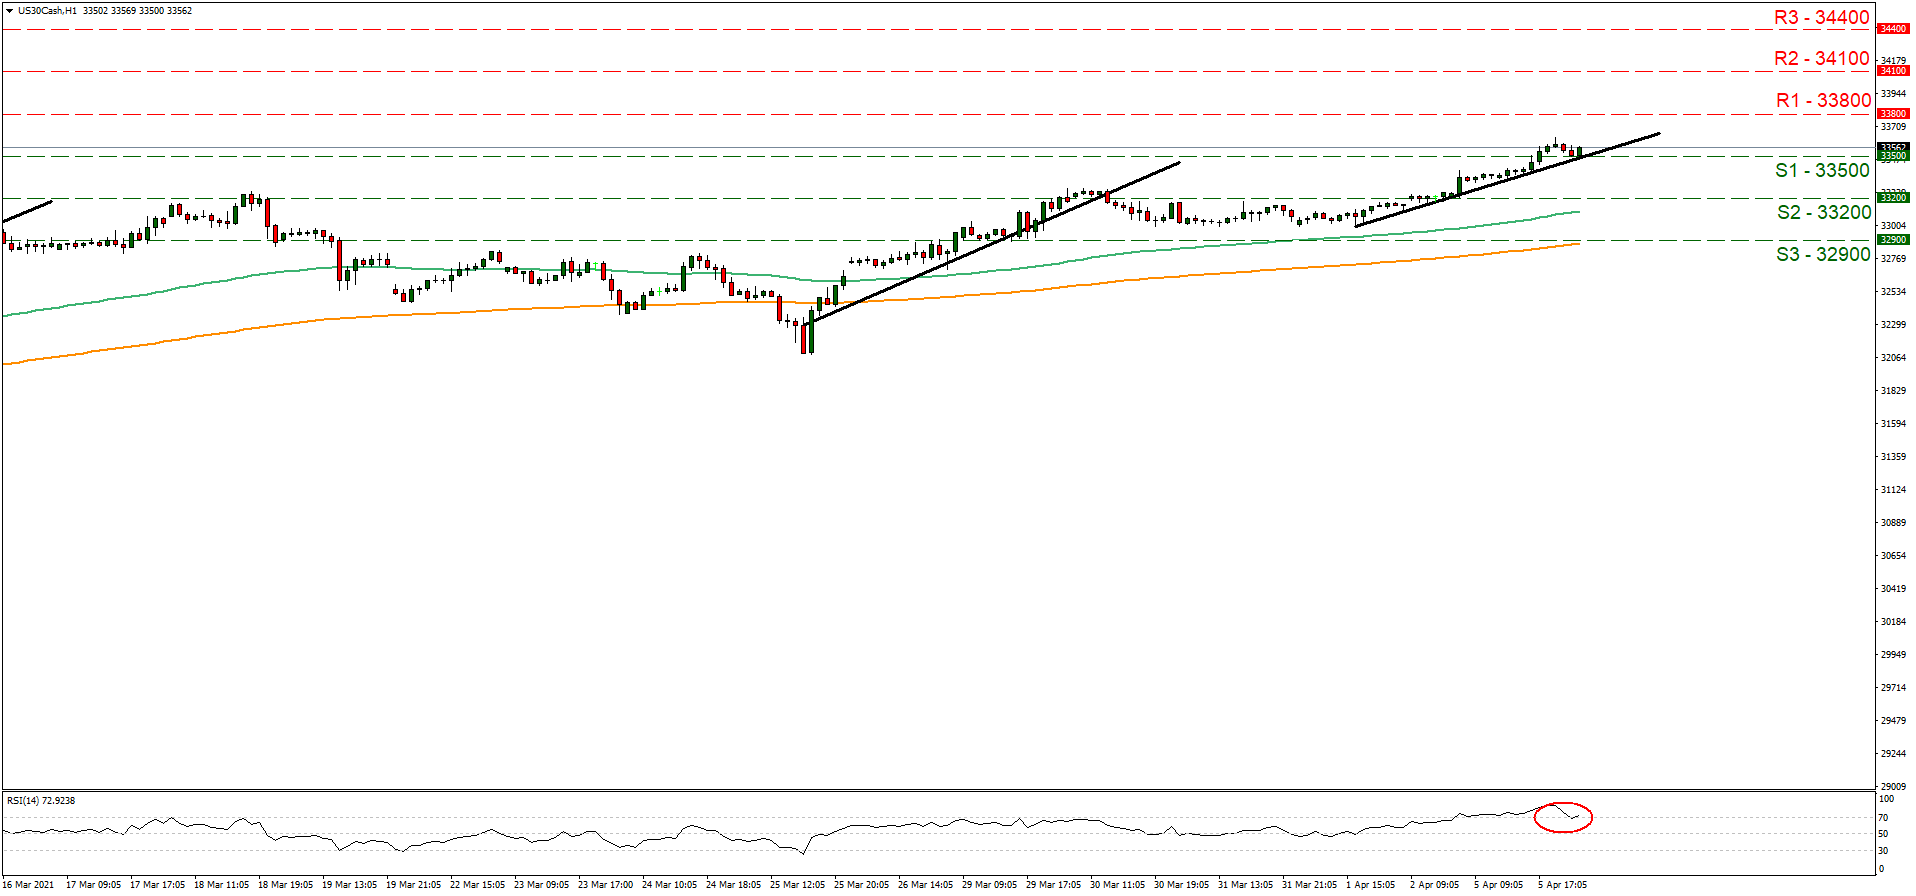
Support: 33500 (S1), 33200 (S2), 32900 (S3)
Resistance: 33800 (R1), 34100 (R2), 34400 (R3)
WTI H4 Chart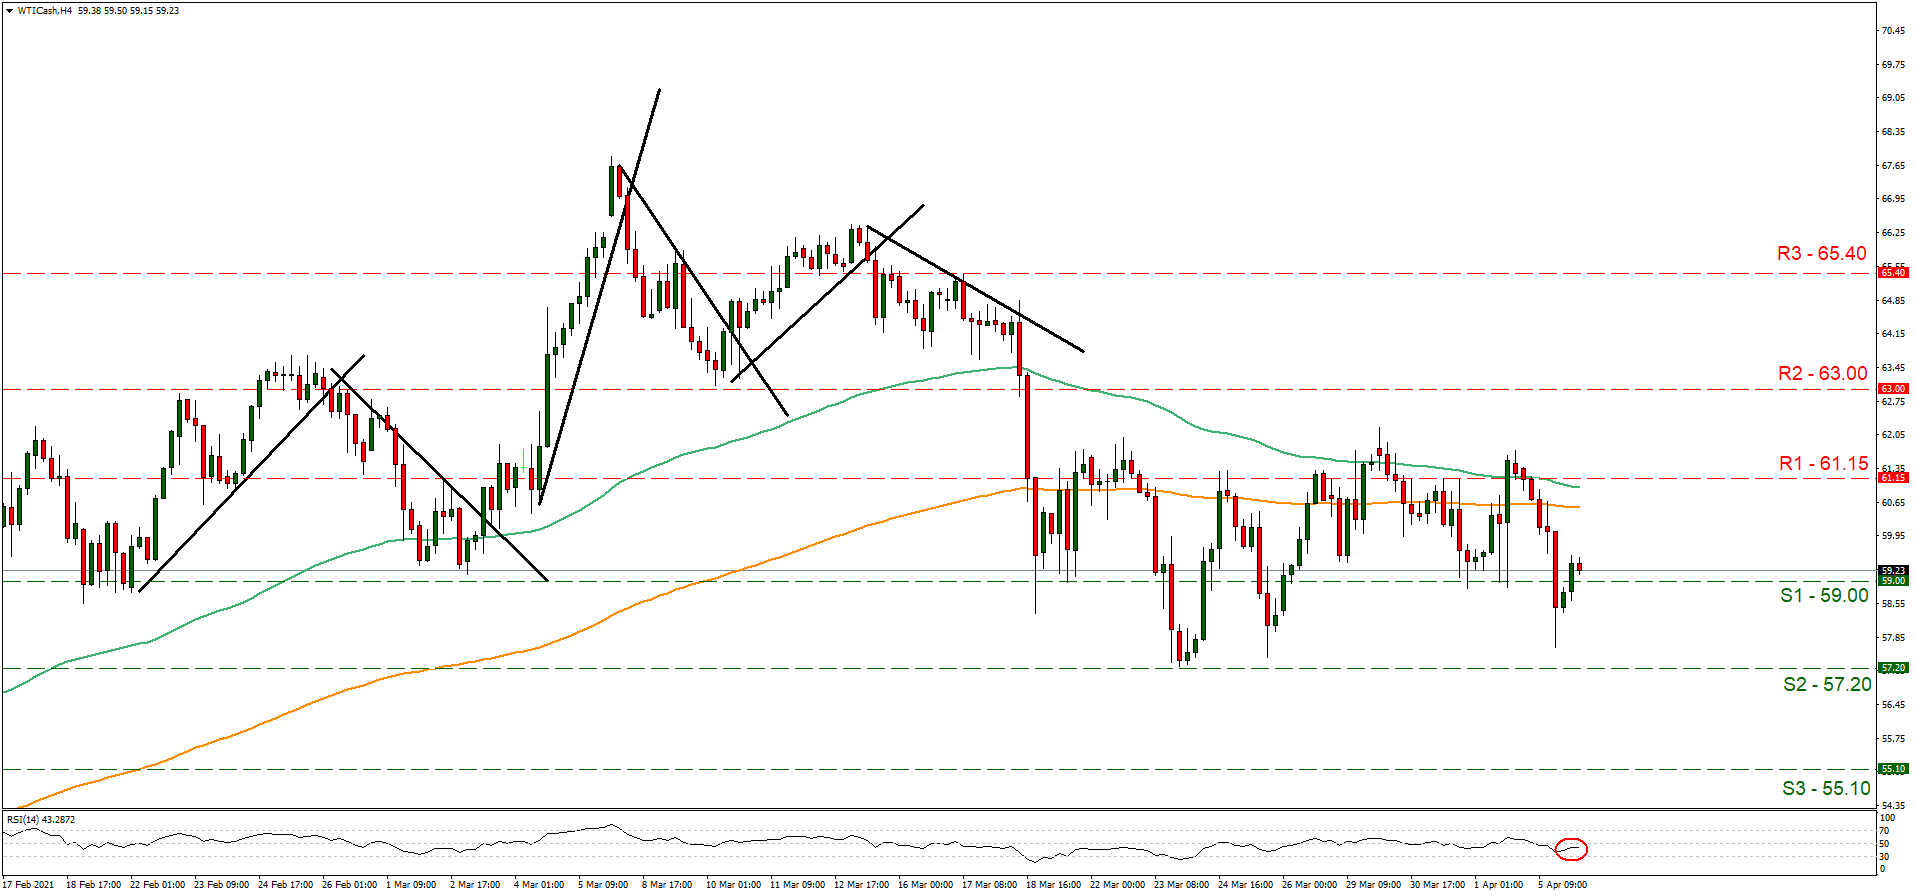
Support: 59.00 (S1), 57.20 (S2), 55.10 (S3)
Resistance: 61.15 (R1), 63.00 (R2), 65.40 (R3)