
Summary
United States: Growing Pains: Extended Lead Times, Supply Chain Constraints, Difficulty Finding Labor
- The unmistakable message delivered in this week’s data is that the U.S. economy could be growing even faster were it not for limited access to essential raw materials and labor.
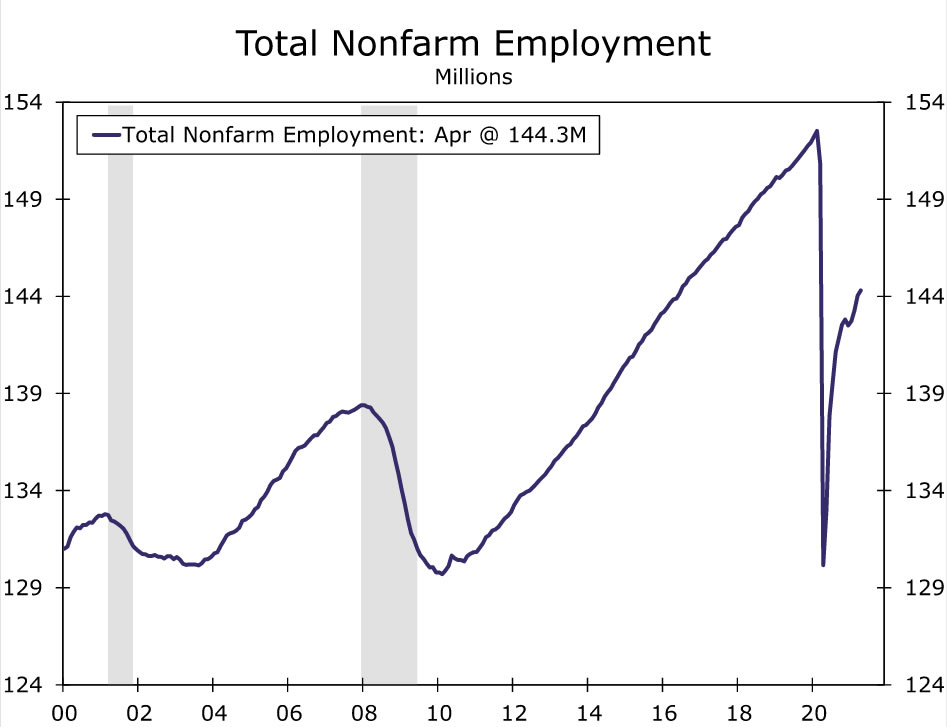
- The April jobs report was a massive disappointment. Employers added just 266,000 workers, not even in the same ZIP code as the one-million job surge that was expected. Finding and retaining workers is a massive problem. Another is that manufacturers forced to idle plants for lack of materials have to furlough workers.
- The reopening of the service sector was a bright spot as the leisure & hospitality sector added 331,000 new jobs.
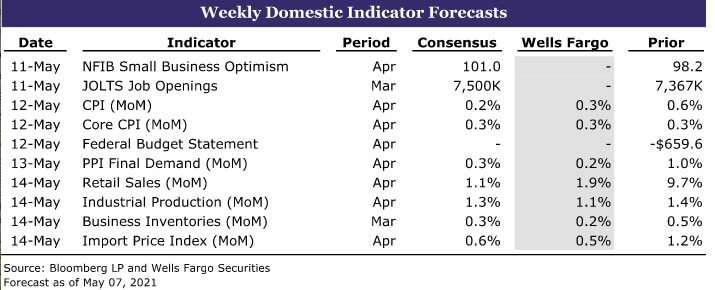
- Next week: CPI (Wednesday), Retail Sales (Friday), Industrial Production (Friday)
International: Bank of England Less Easy
- The Bank of England (BoE) scaled back the pace of asset purchases at its meeting this week and also signaled that the economy may be recovering quicker than expected. In our view, it is likely BoE asset purchases get further tapered in the near future.
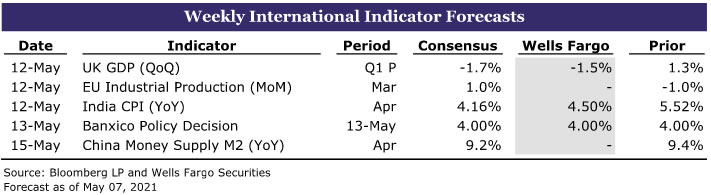
- Next week: U.K. GDP (Wednesday), India CPI (Wednesday), Central Bank of Mexico (Thursday)
Credit Market Insights: Loan Demand Remains Tepid in Q1
- This week, the Federal Reserve released the Q1 results from its Senior Loan Officer Opinion Survey. Broadly speaking, the results showed that demand for bank loans remains relatively tepid across most lending categories.
Topic of the Week: What’s Driving the Sharp Rise in Lumber Prices?
- The knock-on effects of the pandemic have constrained the lumber supply at a time when demand has soared. Lumber futures contracts for May are up around 60% since a month ago and 374% over the year.
U.S. Review
Show Me That Smile Again: ISM Slumps Despite Backlogged Orders Hitting Record High
The unmistakable message delivered in this week’s data is that the U.S. economy could be growing even faster were it not for limited access to essential raw materials and labor.
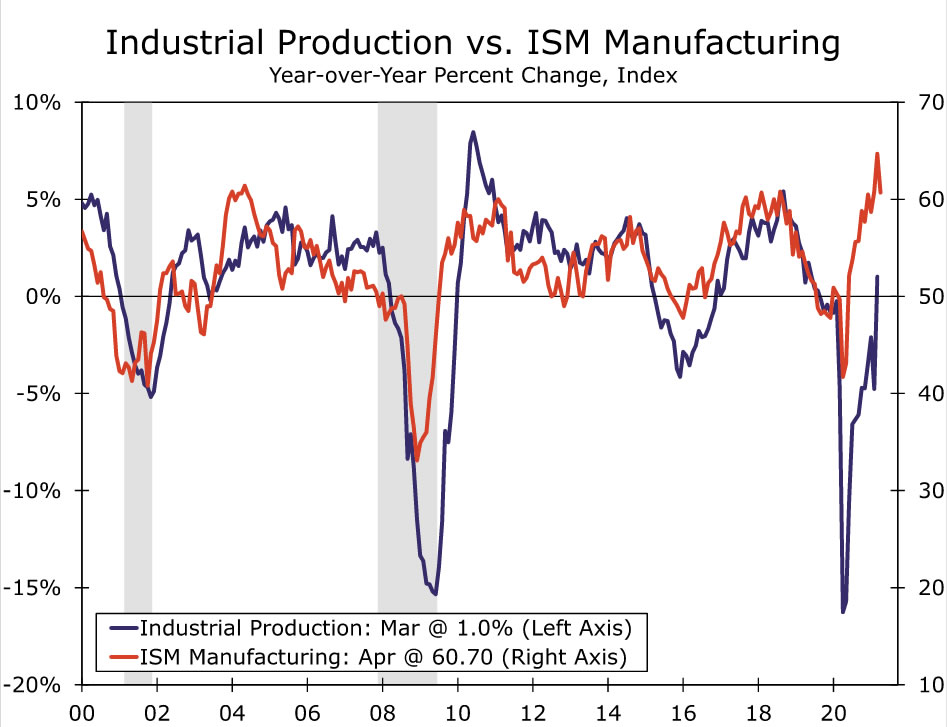
The ISM manufacturing report demonstrated this dynamic for the factory sector. The headline measure slowed to 60.7 in April from 64.7 in March. The sharpest decline among the sub-components was the 5.6-point drop in the production index. That is not a terribly encouraging sign after industrial production fell in February and only partly recouped the loss in March. Note, however, supply chain shortages, particularly in microchips and processors, have shuttered auto assembly plants across the country. For more on that, see our related special report.
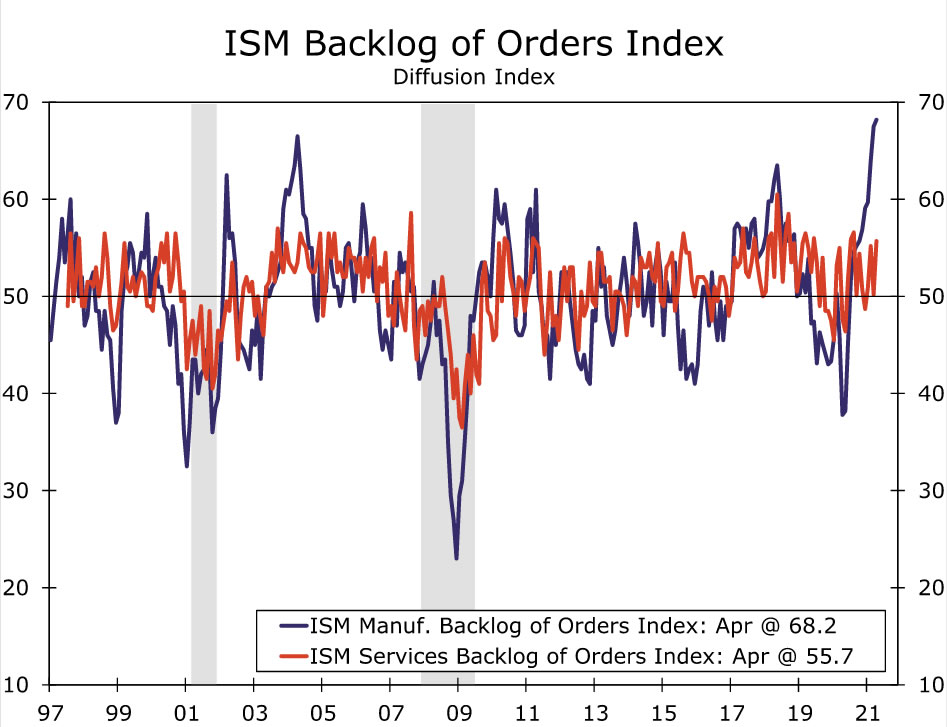
New orders slowed to a still-blistering 64.3 in April from 68.0 in March, even as plants cannot keep up with demand. For more evidence, look no further than backlogged orders which rose to an all-time high of 68.2.
Supplier deliveries were down slightly, but remained near record highs. While many industry respondents highlighted supply chain problems, our favorite came from the plastics and rubber products space: “In 35 years of purchasing, I’ve never seen [anything] like these extended lead times and rising prices.”
Nowhere Near the End: Service Sector Recovery Is Just Getting Started
The fact that the ISM services index slipped a point to 62.7 in April from 63.7 in the prior month would ordinarily be an indication that the service sector is moderating. As was the case in the manufacturing ISM though, that is not a clean read of things. To the extent that activity is slowing (the activity sub-component dropped 6.7 points in April), it is not for want of demand for services, but rather the fact that service companies are short-handed on supplies and the help they need to operate. Our take is that the demand factors that drive service sector activity are actually heating up.
The supply chain problems we have written about in recent weeks are wreaking havoc on the components that factor into the ISM’s headline measure. For the services ISM, these are the components that feed into the headline: activity, new orders, supplier deliveries and employment.
New orders fell 4.0 points to 63.2, a number that is still quite high, but admittedly a slip from last month. The backlog of orders jumped 5.5 points; that’s more than new orders fell, but because backlogs do not factor into the headline, there is no boost.
The scarcity of materials amid the increasing demand as the service sector continues to come back online is stoking inflation. The ISM manufacturing prices paid series rose to 89.6, the highest reading since 1979 bar two months in the summer of 2008 when oil prices were surging. Yet unlike in 2008, demand is far from wavering. That has put manufacturers in a better position to pass on costs than see their margins squeezed.
This is evident in housing market data as well. Although the March construction spending report missed estimates on the headline due to some softness in commercial real estate spending, residential investment increased 1.7%. The same supply chain dynamics are at play here as well, as evident in the sharp run-up in lumber prices. For more on that, see this week’s Topic of the Week.
The Best Is Getting Ready to Begin: Surge in Leisure & Hospitality Hiring Amid Otherwise Ugly Jobs Report
The April Jobs report revealed nonfarm employers added just 266,000 jobs over the month. With spending soaring, employers continue to staff up to meet surging demand. The awakening of the service sector was evident in the fact that the ISM services employment index rose to 58.8 in April. Amid an otherwise hugely disappointing jobs report, the service sector was a bright spot; leisure & hospitality employment rose by 331,000 in April.
The biggest headwind for the labor market at present is the difficulty employers are having finding workers. A record 42% of independent businesses in March reported having at least one position hard to fill, with comments from this week’s ISM Services report indicating staffing challenges carried on into April. As one respondent put it, “consistent with the past year, labor continues to be the biggest issue we are facing. Finding and retaining labor—skilled and unskilled—is highly challenging and frustrating. As the challenges continue, we are not accepting all the work that we could if we had the labor.”
U.S. Outlook
Consumer Price Index (CPI) • Wednesday
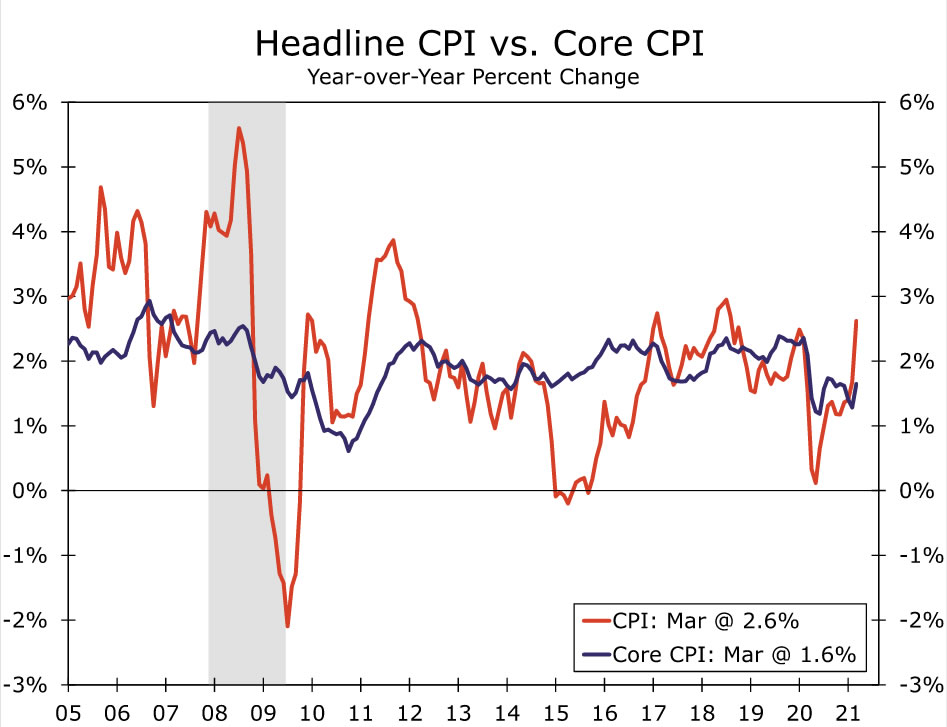
We expect consumer prices continued to firm in April. While frequently purchased items like food and gasoline were more expensive last month, the overall inflation story continues to very much be a reawakening of the service sector and increasingly constrained supply giving way to price pressure. We expect to see a continued pickup in services inflation, as demand resumes and nudges prices higher. Supply problems and shortages continue to intensify and are adding to price pressure across the goods sector. This is particularly visible in the used auto market recently.
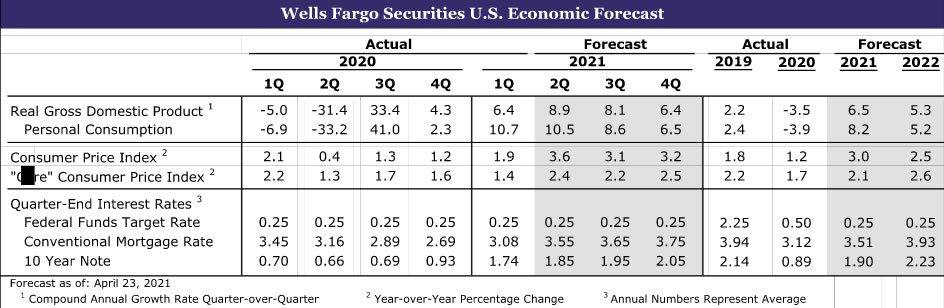
Take note, the period of higher year-over-year (YoY) comparisons is upon us. The 0.3% monthly gain in the CPI, if realized, will push the YoY rate to 3.7%, or the highest rate since 2011. The YoY rate of the core index is also set to rise above 2%. YoY comparisons will be flattered by low base effects from when prices collapsed last year due to lockdowns and is what the Fed has deemed will be transitory increases in prices. We agree, but expect inflation to settle at a higher rate even once transitory factors and price pressures associated with the reopening of the economy fade.
Retail Sales • Friday
Retail sales have ebbed and flowed with stimulus support in recent months. Direct checks from the recent COVID-relief packages boosted spending in the months they were delivered (January & March) and what we’ll find on Friday is if consumers clamped down on spending in April as they did following stimulus in February.
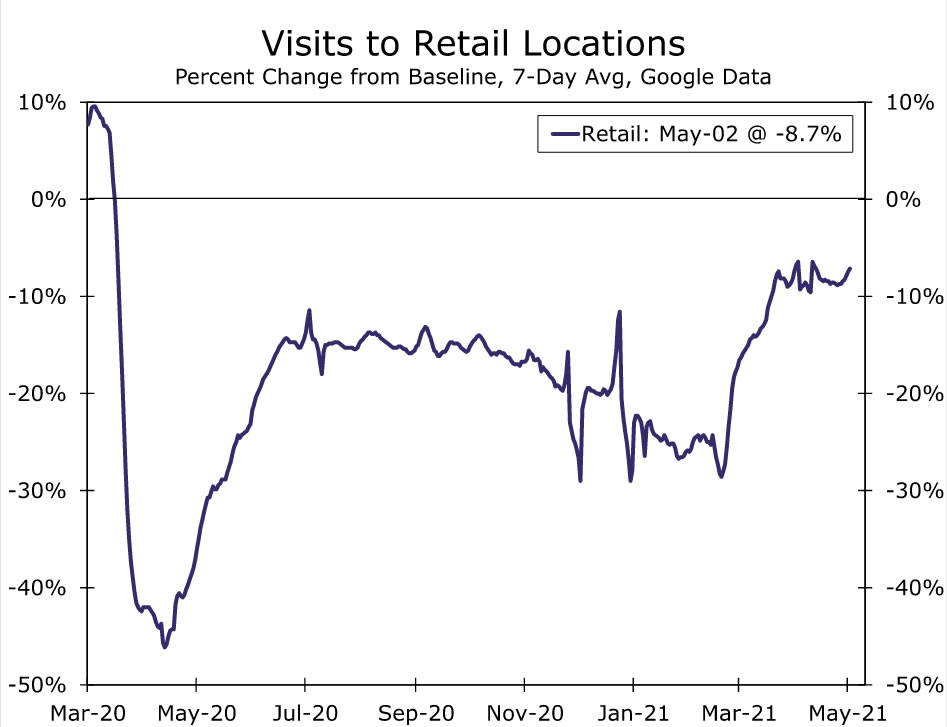
We expect consumers continued to spend and forecast retail sales rose 1.9% last month. We believe the improved public health situation from February helped boost activity. Separately released data show auto sales rose to a level not seen since 2005 in April. Outside autos, sales likely rose 1.2%. High-frequency data from OpenTable and Google suggest households visited restaurants and retail locations last month at the fastest clip since the start of the pandemic and is indicative of an improvement in sales.
If sales come in weaker than we anticipate, we would fault payback after a stimulus spending spree in March and not view it as an early indication of a coming pullback in spending. Although we expect the pace of goods spending to moderate over the course of the year, an improving public health situation, ample household savings and the desire to get out after a year of staying home amid increasingly warmer weather supports our view that spending should remain elevated this summer.
Industrial Production • Friday
We forecast industrial production rose 1.1% last month, but the industrial sector continues to be constrained by severe bottlenecks across the supply chain. The ISM manufacturing survey for April showed some pullback among key components, like production, employment and new orders, and the anecdotal comments from manufacturers continued to emphasize difficulties with supply. We expect demand remains strong amid exceptionally low inventories as well as consumers and businesses in a strong position to spend, but the lack of supply of key inputs is standing in the way of a more robust rebound in manufacturing.
We anticipate this was particularly evident in the auto sector last month, and explored this in a recent special report. Production has been pummeled by the global semiconductor shortage, which likely kept output depressed as many automakers have had to temporarily idle plants due to shortages. This is happening despite the surge in auto sales and adding to price pressure in the sector. Supply issues extend beyond autos and have the potential to constrain overall output this year.
International Review
Bank of England Less Easy
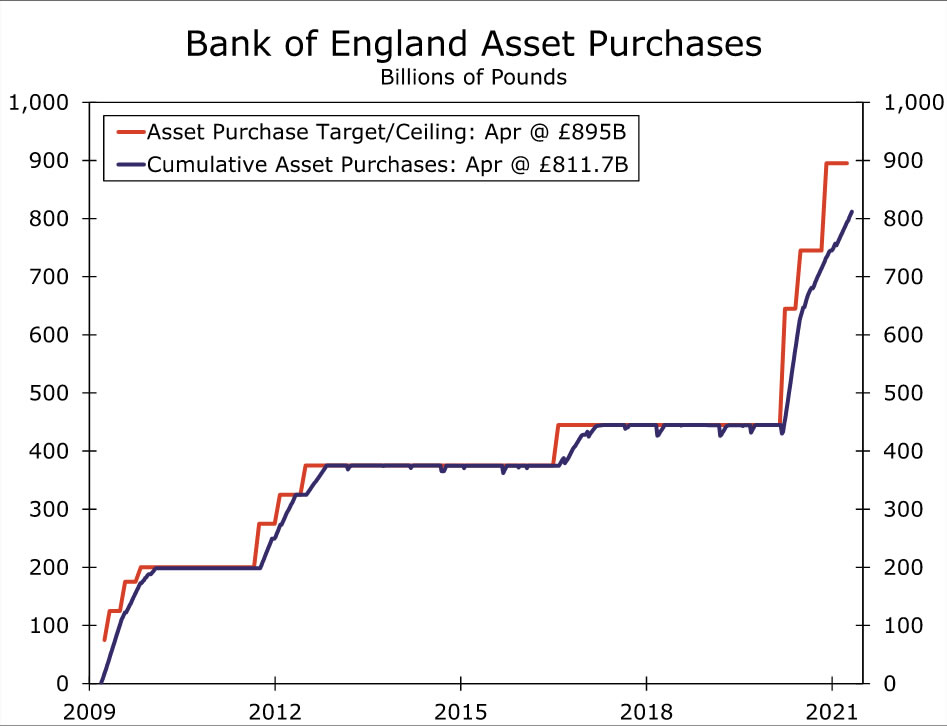
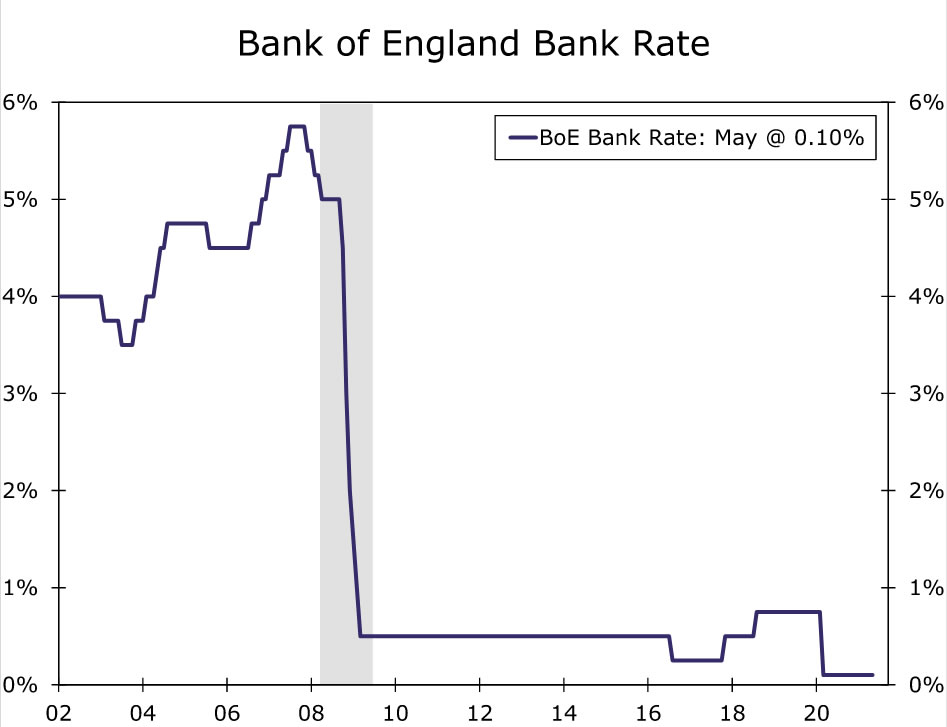
The Bank of England (BoE) met this week to assess monetary policy, leaving its key policy parameters unchanged. The BoE kept its Bank Rate at 0.10% and also maintained its bond purchase target at £895 billion. There was, however, a modest tweak in the BoE’s approach in that it said it would slow the pace of bond purchases, which is mathematically natural if the purchase program is to persist only until late this year. In fact, the BoE was quite specific with respect to its purchase plans between now and August, indicating it would conduct three bond-buying operations per week, with each being £1.147 billion. That equates to weekly bond purchases of £3.44 billion, down from a purchase pace of £4.44 billion per week over the past several weeks.
Despite the adjustment in the pace of asset purchases, the Bank of England said this operational change should not be interpreted as a change in its stance of monetary policy. Policymakers also highlighted the uncertainty regarding the outlook for the U.K. economy and that the central bank is still far from tightening policy. As far as the outlook for the economy, the Bank of England also revised its GDP growth forecast significantly higher. The BoE now projects 2021 GDP growth of 7.25% (compared to 5% in February) but sees 2022 GDP growth at 5.75% (compared to 7.25% previously). Meanwhile, with respect to CPI inflation, the BoE expects 2021 inflation at 2.5% (compared to 2% in February) and 2022 inflation at 2% (compared to 2.25% previously).
The slowdown in the pace of bond purchases combined with more upbeat economic forecasts allows us to believe a moderate tapering in the pace of bond purchases seems likely in the near future. To that point, tapering asset purchases could begin as early as the BoE’s August meeting, so long as economic data hold up and the country’s vaccine campaign remains undisrupted. In our view, interest rate hikes are still probably a ways off. We believe asset purchases would likely be tapered first and adjustments to interest rates would follow once the BoE’s quantitative easing program ends. In that context, we do not expect an initial interest rate hike until the first half of 2023, as inflation pressures also remain somewhat modest.
International Outlook
United Kingdom GDP • Wednesday
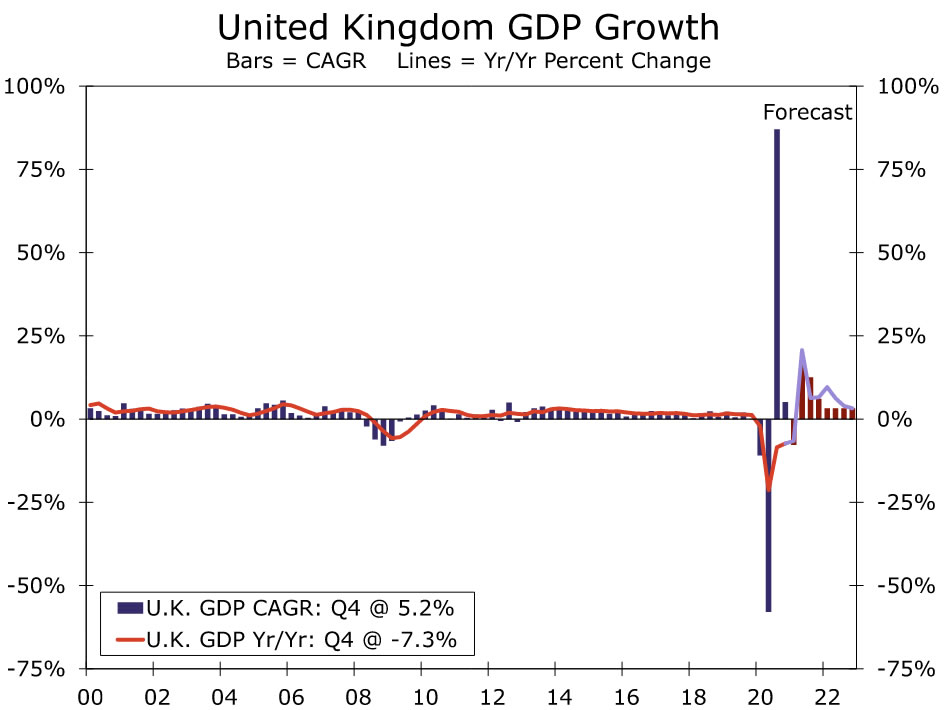
Next week, the United Kingdom will report Q1 GDP data, and we expect the economy contracted over the first three months of the year. Early this year, the U.K. struggled with a renewed outbreak of COVID, as new variants of the virus spread rapidly across London. Lockdowns were implemented soon after, and the hit to economic activity was significant earlier in the year and will likely have a damaging effect on GDP. We expect the U.K. economy contracted 1.5% in Q1, a slightly smaller decline than consensus estimates for a 1.7% contraction. However, the prospects for the U.K. economy have improved lately, as the U.K. is one of the most vaccinated countries in the world. An improved vaccination campaign has allowed the economy to lift restrictions and has sparked an uptick in activity nationwide.
As leading indicators have improved, we have revised our GDP forecast for the U.K. economy higher. As we noted above, the Bank of England also revised its forecast higher and expects the U.K. economy to grow around 7% this year. Under those assumptions, the U.K. will be back to pre-pandemic levels of output possibly by the end of 2021.
India CPI • Wednesday
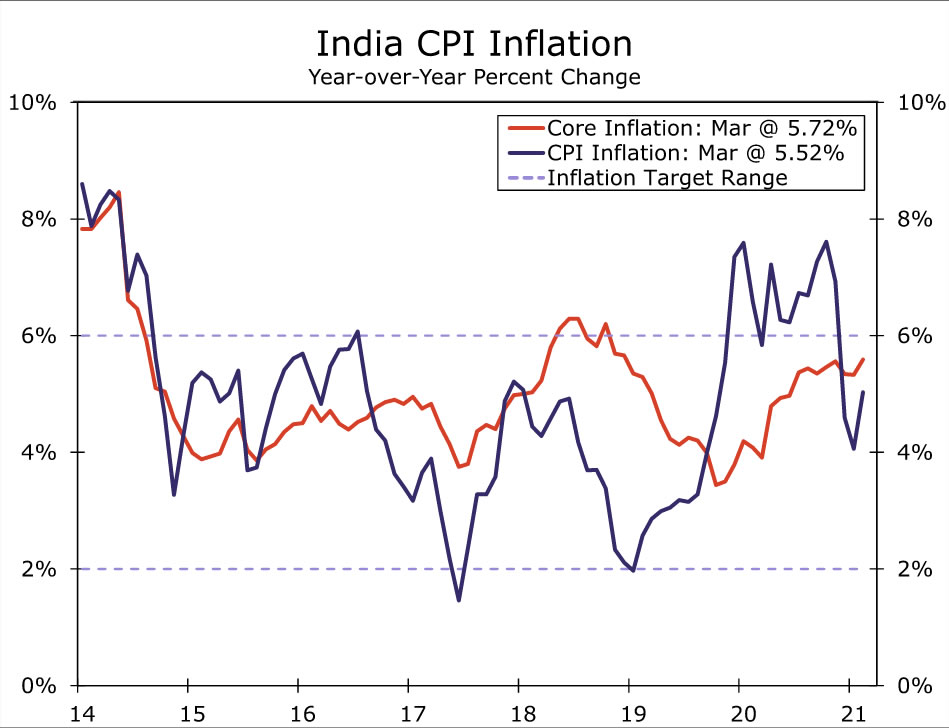
COVID conditions across India continue to intensify, as the country is now the clear global hotspot for the virus. New restrictions have been put in place in Mumbai and New Delhi, complicating the economic recovery for the remainder of this year. To that point, we recently revised our GDP forecast for 2021 lower due to the spike in COVID cases and the restrictions that have been put in place over the past month. With GDP likely to slow going forward, the outlook for inflation may wind up taking a different path. Oil prices, a key component of India’s CPI basket, continue to rise, while food prices remain elevated. In addition, new restrictions likely mean new supply chain disruptions. Similar supply chain disruptions pushed CPI inflation well above the central bank’s target earlier in the pandemic.
As of March, CPI inflation is 5.52% year-over-year, still below the Reserve Bank of India’s inflation target of 4% +/- 2%. However, as supply chain disruptions increase, commodity prices push higher and the rupee remains at depressed levels, inflation could begin a renewed push higher as well. In the coming months, perhaps starting in April, it would not be surprising to see CPI inflation trend above the upper bound of the central bank’s inflation target.
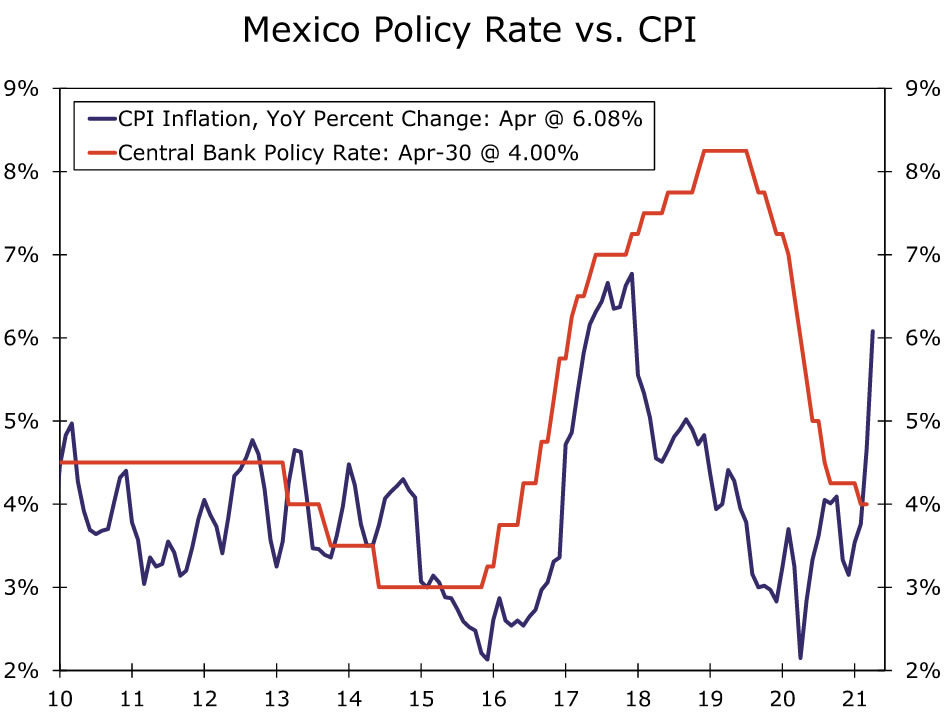
Central Bank of Mexico • Thursday
Monetary policy has been on hold in Mexico since the end of February; however, the last meeting may have been an indication that interest rates could be on the verge of moving higher in the near future. While it is unlikely policy rates get lifted next week, we do expect rate hikes by the end of this year. To that point, the Mexican peso has been volatile lately, while inflation is already elevated and likely to trend higher over the next few months. A weak currency and elevated inflation could provide Mexican policymakers with justification to begin the monetary tightening cycle. In addition, peer emerging market central banks have already started raising policy rates, which could provide an extra incentive for the Central Bank of Mexico to lift rates over the next few months as well.
Next week’s meeting should provide markets with additional insight into the possible path of monetary policy. Specifically, we will be watching for the composition of votes as it relates to interest rates and the presence of any dissenters from keeping rates on hold. In March, the decision to hold rates steady at 4.00% was unanimous; however, with bi-weekly inflation above 6%, we could see a more pronounced signal from the central bank that rate hikes will be coming in the near future.
Credit Market Insights
Loan Demand Remains Tepid in Q1
This week, the Federal Reserve released the Q1 results from its Senior Loan Officer Opinion Survey. Broadly speaking, the results showed that demand for bank loans remains relatively tepid across most lending categories. Banks reported weaker demand, on net, for commercial and industrial (C&I) loans to large and middle-market firms, while demand for C&I loans from small firms remained basically unchanged. Loan demand was a bit more robust on the household side with moderately stronger demand for auto loans and stronger demand for residential real estate loans. Demand for credit card and other consumer loans remained basically unchanged.
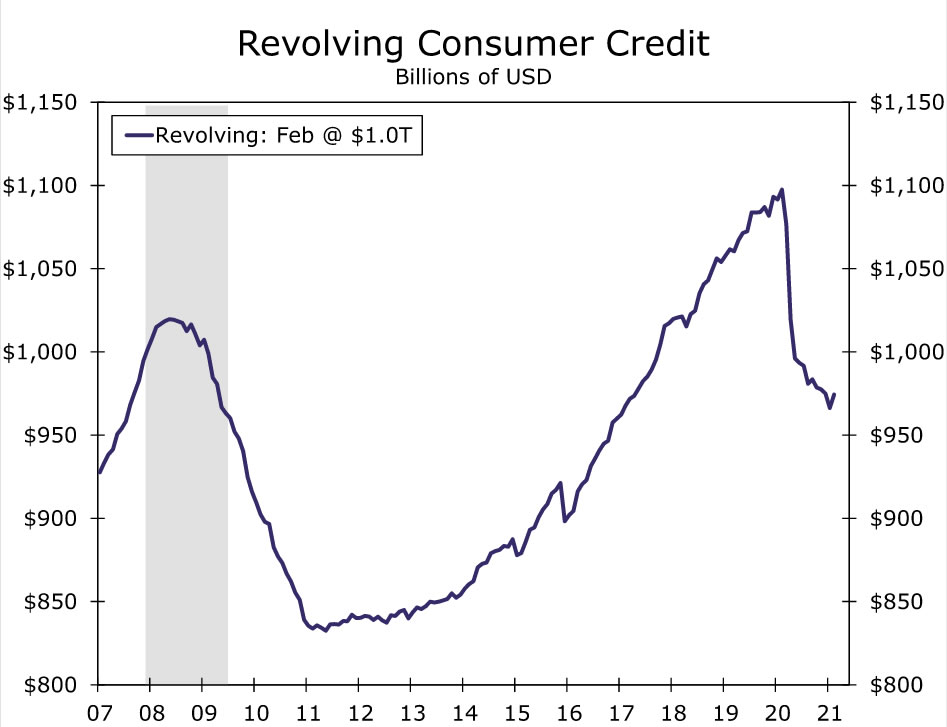
The relatively weak demand for bank loans is reflected in the lending data. Loans and leases made by commercial banks are down 0.4% over the 12-month period ended in March 2021. This is not altogether surprising, in our view; the federal government’s multiple COVID relief laws have been a fire hose of liquidity for households, businesses and state and local governments. To some extent, public sector credit creation has substituted for private sector credit creation in the past 12 months. For example, revolving consumer credit debt (think credit cards) has declined by more than $100 billion since the pandemic began (see chart), and the last data point predates the $1.8 trillion American Rescue Plan enacted in mid-March. Additional paydowns appear likely in the March and April data.
In response to weak loan demand, banks have eased lending standards for some types of loans, according to the senior loan officer survey. Banks eased standards on residential real estate loans, credit card loans, auto loans and other consumer loans. Not all sectors saw easier standards, however, as banks reported unchanged standards for commercial real estate (CRE) loans and tighter standards on construction and land development loans. Given how uncertain the medium- and long-run outlooks are for CRE sectors of the economy like office and retail, more cautious lending in these areas is perhaps not surprising. (Return to Summary)
Topic of the Week
What’s Driving the Sharp Rise in Lumber Prices?
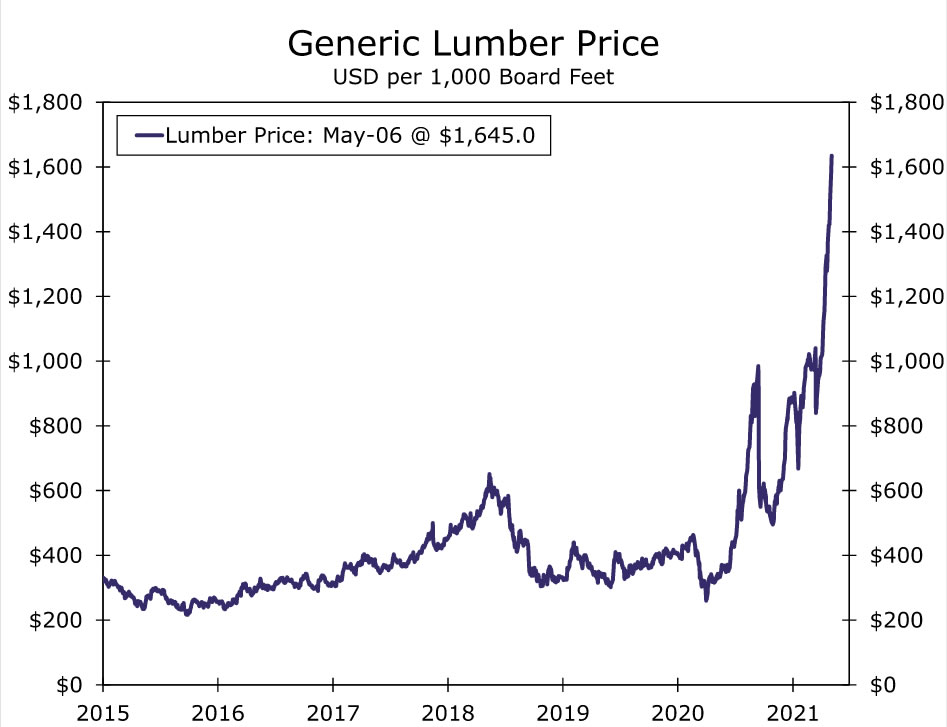
Lumber prices are skyrocketing. As of this writing, lumber futures contracts for May delivery were priced at $1,645 per 1,000 board feet, up about 60% since a month ago and 374% above the $347 contract price averaged during last May. So, why are lumber prices rising at the fastest rate since the housing boom that followed World War II? The answer is that the knock-on effects of the pandemic have constrained supply at a time when demand for lumber has soared.
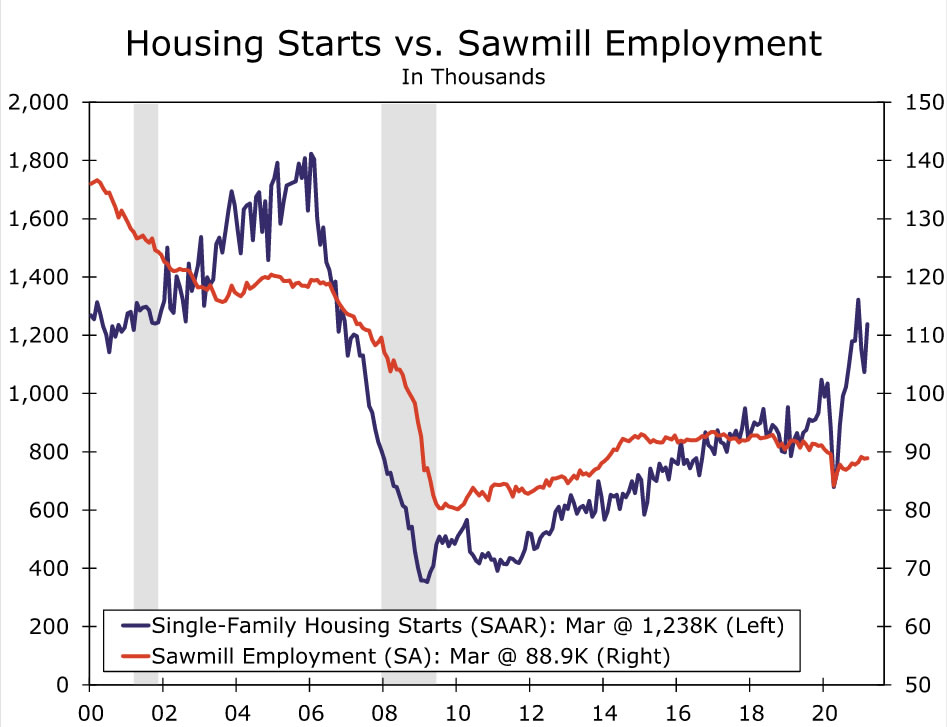
Demand from home builders has been particularly robust. The pandemic has spurred a need for more space and a rush of home buying. With little inventory of existing homes for sale, prospective buyers are increasingly looking to the new home market, and builders are struggling to keep pace with the unanticipated upshift in demand. What is more, relatively few trade-up options and fast-rising home prices (and homeowners’ equity) have led to a surge in home additions and renovation projects, which has only added to the lumber frenzy. Spending on single-family construction and home improvement projects are both up over 20% in the past year.
Supply-side issues for lumber are fairly straight forward. Sawmills have struggled to ramp up supply to meet the strong demand. Like many industries, lumber producers temporarily idled capacity last year, and while more capacity has come back online, many are still hampered by operating restrictions implemented to slow the spread of COVID. Producers are struggling to rehire workers, a problem that is becoming increasingly common across all industries. Producers ramping up production to pre-pandemic levels might not even be enough. Many sawmills were permanently shuttered in the aftermath of the housing bust in 2008, and only a few new mills have been opened over the past decade alongside the lackluster recovery in home building.
On top of that, Canada, which has long been a major supplier of lumber to the United States, has had its own supply issues, in part due to an ongoing beetle infestation. Over the past decade, the mountain pine beetle has destroyed an estimated 15 years of lumber supplies in British Columbia, Alberta and the Pacific Northwest. Moreover, COVID-related mill curtailments have only added to Canada’s supply challenges. Production has increased more recently and Canadian lumber imports have picked up. In December, the U.S. Commerce Department reduced tariffs on Canadian lumber to 9% from 20%. Removing the tariffs on softwood lumber imports from Canada might provide some modest short-term relief, but the supply problem has more to do with the unique challenges of restarting production and normalizing supply chains as the pandemic dissipates.
Overall, the unprecedented spike in lumber prices poses an enormous challenge for the construction industry. In addition to ascending lumber costs, builders are having to contend with rising prices for many other materials, including copper, steel, household appliances and cabinets. Supply shortages should ease somewhat later this year, as COVID risks recede further and more sawmills reopen in the Pacific Northwest. Imports from Central Europe and Scandinavia are helping make up part of the shortfall, but a weaker dollar makes those imports more expensive. A quick resolution to the industry’s supply woes by building new sawmills is unlikely, however, as construction of a new plant is a capital-intensive process that often takes years.


