
News and Events:
Oil caps worst week since November
The West Texas Intermediate is about to post its largest weekly decline since the first week of November when it dropped 9.50% to below $45 a barrel. This week, the WTI slid almost 7% as it dipped below $50 a barrel for the first time since the November OPEC ‘supply cut’ deal. The move was initiated on Wednesday after the EIA reported that US stockpiles had surged by 8.2 million barrels in the previous week, more than four times what the market was expecting, pushing US inventories (excluding strategic reserve) to an all-time high of 528 million barrels.
The market has begun to consider the possibility that OPEC and certain non-OPEC members such as Russia, who initially agreed to curb production back in November, may now be backtracking on their promise. Indeed, the US shale industry was the primary beneficiary of this ‘supply cut’ as shown by the massive rise in rig count (+38% or 168 new wells since November last year). In this fight, the US has been continuously increasing their market share on the back of those who agreed to cut production.
On the top of this, the market positioning on the NYMEX had reached extreme levels recently as the total net position reached 387k contracts. Even back in June 2014, the market wasn’t that bullish (348k net long). Therefore, we believe that there is room for further downside move in crude oil prices. Investors were betting that the recovery in prices would be proven sustainable as the main oil producers seemed to have found an agreement. We would not be surprised to see OPEC and Russia back-pedalling on the ‘supply cut’ deal as it is clearly to the advantage of the US right now. We expect further weakness of crude prices as traders unwind their long positions, with $45 a barrel as the next target.
Tread cautiously in EM
Markets are currently repricing in three Fed rate hikes (four in 2018), which is forcing the US yield curve higher. The complacency in the market to price in faster rate hikes looks to have diminished. While the USD has gained versus the G10 (especially commodity-linked currencies NOK and NZD), widening interest rate differentials and softer commodity prices have not supported broad-based EM selling. In fact, EM currencies have widely improved against the dollar. Part of the rationale of the lagging behavior is due to signs of reflation, which should push policymakers to manage accommodating policy correctly. In addition, the delay in the US trade policy has provided EM with a bit of macro-head winds respite. Yet, with 8 trillion sitting in negative yielding sovereign paper, the probability that higher US rates will attract flows driving USD higher has significantly increased. Further, EM volumes seem to be completely mispricing the risk relating to Fed tightening and global protectionism. As markets price in a quicker rate of Fed hikes, low yielding EM currencies, already behind the curve, will come under selling pressure.
NFP report irrelevant as Fed hike is a done deal
After the massive ADPs on Wednesday, which came in slightly below 300k, financial markets are now awaiting confirmation from the NFPs, which are expected to come in for February lower than the January print, 200k vs 227k. From our standpoint, this read is irrelevant as it will have little impact on the US central bank’s decision concerning the raising of rates.
Despite the occasional spectacular miss from the ADP, we would not expect a low NFP read. A weak read could drive the dollar lower, knowing that there is room for disappointment as a rate hike is now priced in by the financial markets.
Moreover, there is the increasing probability of rate hikes at the next meetings. We reaffirm our belief that the Fed will not raise rates above 2% for the next two years as it could trigger a much deeper crisis.
The dollar should remain strong and while today’s NFPs are likely to be a non-event, one should not forget Trump’s stance that the dollar is too high. For the time being, European uncertainties are definitely sending the greenback higher.
Today’s Key Issues (time in GMT):
- Feb CPI MoM, exp 0,90%, last 0,00% DKK / 08:00
- Feb CPI YoY, exp 1,10%, last 0,90% DKK / 08:00
- Feb CPI EU Harmonized MoM, exp 0,80%, last -0,10% DKK / 08:00
- Feb CPI EU Harmonized YoY, exp 1,00%, last 0,70% DKK / 08:00
- mars.03 Money Supply Narrow Def, last 8.85t RUB / 08:00
- Jan Retail Sales YoY, last 0,90% EUR / 08:00
- Jan Retail Sales SA YoY, exp 2,50%, last 2,90%, rev 2,10% EUR / 08:00
- mars.07 FIPE CPI – Weekly, exp -0,03%, last -0,05% BRL / 08:00
- 4Q Unemployment Rate Quarterly, exp 11,70%, last 11,60% EUR / 09:00
- Jan Industrial Production MoM, exp -0,50%, last 1,10%, rev 0,90% GBP / 09:30
- Jan Industrial Production YoY, exp 3,20%, last 4,30% GBP / 09:30
- Jan Manufacturing Production MoM, exp -0,70%, last 2,10%, rev 2,20% GBP / 09:30
- Jan Manufacturing Production YoY, exp 2,90%, last 4,00%, rev 4,20% GBP / 09:30
- Jan Construction Output SA MoM, exp -0,20%, last 1,80% GBP / 09:30
- Jan Construction Output SA YoY, exp 0,30%, last 0,60%, rev 2,60% GBP / 09:30
- Jan Visible Trade Balance GBP/Mn, exp -£11100, last -£10890, rev -£10915 GBP / 09:30
- Jan Trade Balance Non EU GBP/Mn, exp -£2425, last -£2114, rev -£2527 GBP / 09:30
- Jan Trade Balance, exp -£3100, last -£3304, rev -£2026 GBP / 09:30
- Feb BoE/TNS Inflation Next 12 Mths, last 2,80% GBP / 09:30
- Feb IBGE Inflation IPCA MoM, exp 0,43%, last 0,38% BRL / 12:00
- Feb IBGE Inflation IPCA YoY, exp 4,86%, last 5,35% BRL / 12:00
- Jan Industrial Production YoY, exp 0,50%, last -0,40% INR / 12:00
- Feb Unemployment Rate, exp 6,80%, last 6,80% CAD / 13:30
- Feb Change in Nonfarm Payrolls, exp 200k, last 227k USD / 13:30
- Feb Net Change in Employment, exp -5.0k, last 48.3k CAD / 13:30
- Feb Two-Month Payroll Net Revision USD / 13:30
- Feb Full Time Employment Change, last 15,8 CAD / 13:30
- Feb Change in Private Payrolls, exp 215k, last 237k USD / 13:30
- Feb Part Time Employment Change, last 32,4 CAD / 13:30
- Feb Change in Manufact. Payrolls, exp 10k, last 5k USD / 13:30
- Feb Participation Rate, last 65,9 CAD / 13:30
- Feb Unemployment Rate, exp 4,70%, last 4,80% USD / 13:30
- Feb Average Hourly Earnings MoM, exp 0,30%, last 0,10% USD / 13:30
- Feb Average Hourly Earnings YoY, exp 2,80%, last 2,50% USD / 13:30
- Feb Average Weekly Hours All Employees, exp 34,4, last 34,4 USD / 13:30
- Feb Labor Force Participation Rate, last 62,90% USD / 13:30
- Feb Underemployment Rate, last 9,40% USD / 13:30
- Feb NIESR GDP Estimate, exp 0,60%, last 0,70% GBP / 15:00
- Feb Monthly Budget Statement, exp -$190.0b, last $51.3b USD / 19:00
- Feb Foreign Direct Investment YoY CNY, exp -4,20%, last -9,20% CNY / 23:00
The Risk Today:
EUR/USD has consolidated higher but the demand seems to weaken. Hourly resistance is given at 1.0679 (16/02/2017 high) while hourly support at 1.0493 (22/02/2017 low). The technical structure suggests deeper consolidation towards 1.0500. In the longer term, the death cross late October indicated a further bearish bias. The pair has broken key support given at 1.0458 (16/03/2015 low). Key resistance holds at 1.1714 (24/08/2015 high). Expected to head towards parity.
GBP/USD continues to edge lower since the pair has broken support given at 1.2254 (19/01/2017 low). The road is wide-open for further decline. Hourly resistance is now given at 1.2214 (09/03/2017 high). The long-term technical pattern is even more negative since the Brexit vote has paved the way for further decline. Long-term support given at 1.0520 (01/03/85) represents a decent target. Long-term resistance is given at 1.5018 (24/06/2015) and would indicate a long-term reversal in the negative trend. Yet, it is very unlikely at the moment.
USD/JPY is pushing higher towards key resistance given at 115.62 (19/01/2016 high). Hourly support can be found at 113.56 (06/03/2017 low). We favor a long-term bearish bias. Support is now given at 96.57 (10/08/2013 low). A gradual rise towards the major resistance at 135.15 (01/02/2002 high) seems absolutely unlikely. Expected to decline further support at 93.79 (13/06/2013 low).
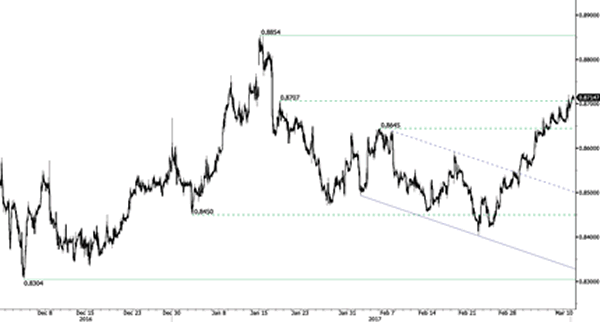
USD/CHF continues to improves. Hourly resistance is implied by upper bound of the uptrend channel. Key resistance is given at a distance at 1.0344 (15/12/2016 high). Expected to see further strengthening. In the long-term, the pair is still trading in range since 2011 despite some turmoil when the SNB unpegged the CHF. Key support can be found 0.8986 (30/01/2015 low). The technical structure favours nonetheless a long term bullish bias since the unpeg in January 2015.
| EURUSD | GBPUSD | USDCHF | USDJPY |
| 1.1300 | 1.3445 | 1.1731 | 121.69 |
| 1.0954 | 1.3121 | 1.0652 | 118.66 |
| 1.0874 | 1.2771 | 1.0344 | 115.62 |
| 1.0610 | 1.2169 | 1.0120 | 115.38 |
| 1.0454 | 1.1986 | 0.9967 | 111.36 |
| 1.0341 | 1.1841 | 0.9862 | 106.04 |
| 1.0000 | 1.0520 | 0.9550 | 101.20 |


