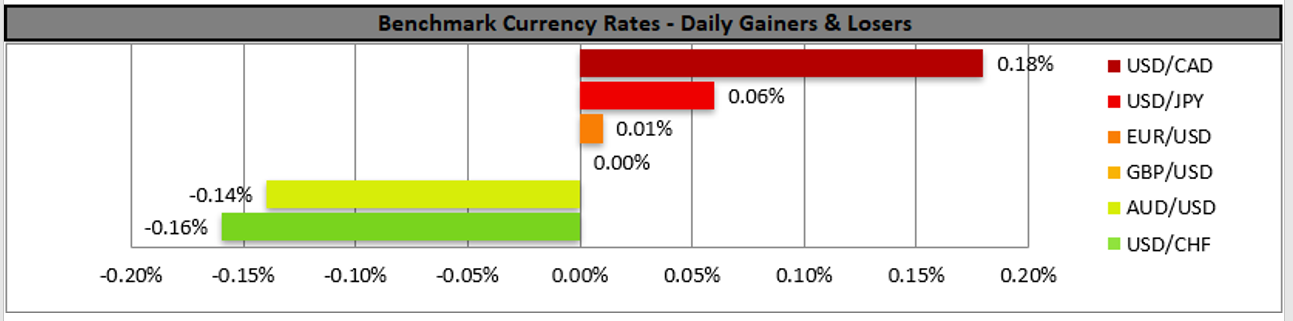
The USD tended to edge a bit higher against a number of its counterparts yesterday, while stockmarkets wobbled with little volatility. The markets seem to be focusing on the release of the US inflation rates, due out tomorrow and whether we will see new 12 year highs on the headline rate on a year-on-year level, which could once again add pressure on the Fed to taper its QE program. It should be noted that US yields tended to weaken further which was supportive for US stockmarkets yet at the same time the markets seem to worry about a possible acceleration of the US inflation rates. It should be noted that in the US political spectrum the US Senate passed a package of legislation to boost the US side regarding the competition with China yet has also some provisions which could be against Chinese tech companies and could spark Beijing’s fury once again. Given the lack of financial releases we expect fundamentals to take over for USD and the US stockmarkets today.
Dow Jones maintained a sideways motion near the 34700 (R1) resistance line. We tend to keep our bias for a sideways motion between the 34400 (R1) resistance line and the 34700 (S1) support line, given its range bound movement since the 27th of May and the subsequent breaking of the upward trendline incepted since the 20th of May on the 2nd of June. Also please note that the RSI indicator below our 4-hour chart remains near the reading of 50, implying a rather indecisive market. Should a selling interest be displayed by the market, we may see the index breaking the 34400 (S1) support line and aim for the 34100 (S2) support level. Should the buyers be in charge of Dow Jones’s direction, we may see the index breaking the 34700 (R1) resistance line and aim for the 35100 (R2) level.
BoC to remain confidently on hold?
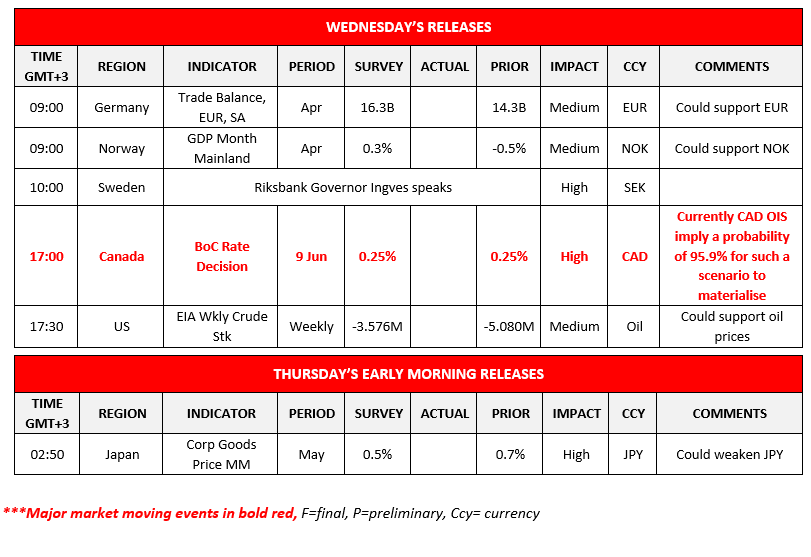
Today during the American session, we get from Canada, BoC’s interest rate decision. The bank is widely expected to remain on hold at 0.25% on Wednesday and CAD OIS imply a probability of 95.9% of such a scenario materializing. Hence, we would shift our attention to the bank’s accompanying statement, and we may expect the bank’s confidence to be maintained in which case the Loonie may get some support. A recent Reuters poll has noted that the next tapering of the bank’s QE program could be in the next quarter, while a rate hike may be earlier than what the market expects it. We would not be surprised to see the bank paving the way for more hawkishness in the coming months, starting with the meeting next week. On the other hand, though the CAD has been in a strong sideways motion against the USD since mid May and it may be difficult for it strengthen further against the USD as it has reached levels not seen since 2017.
USD/CAD edged higher yesterday, yet overall the sideways motion between the 1.2140 (R1) and the 1.2060 (S1) levels seems to continue. The movement of the pair’s price action for the past month allows us to maintain our bias for a rangebound motion as described above. On the other hand, the RSI indicator below our 4-hour chart is above the reading of 50 implying a slight advantage of the bulls. Should the bulls actually gain control over the pair’s direction, we may see USD/CAD’s price breaking the 1.2140 (R1) resistance line and aim for the 1.2230 (R2) resistance level. To the downside and should the bears take over, we could see USD/CAD’s price action breaking the 1.2060 (S1) support line and aim for the 1.1995 (S2) support level.
Other economic highlights today and the following Asian session:
Today during the European session, we get Germany’s trade data for April and Norway’s GDP rates for April, while Riksbank Governor Ingves is scheduled to speak. In the American session we highlight BoC’s interest rate decision and a bit later, oil traders may be more interested for the release of EIA’s weekly crude oil inventories figure. During Thursday’s Asian session, we get from Japan the corporate goods prices growth rate for May.
US30 Cash H4 Chart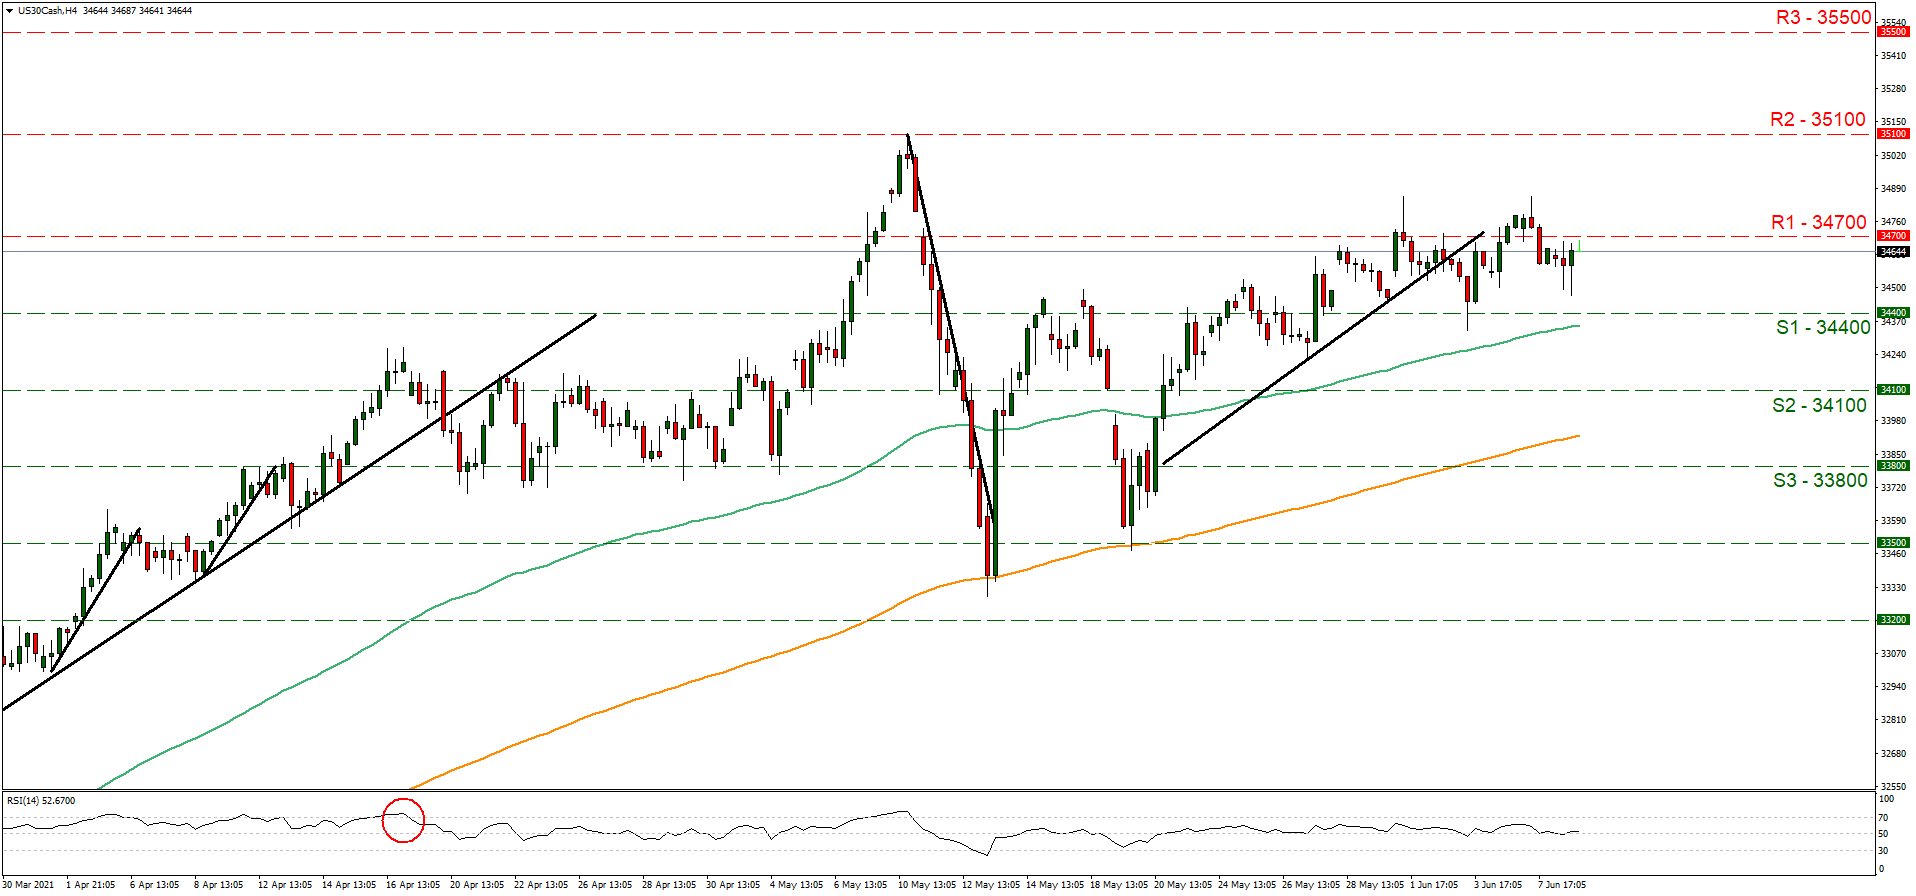
Support: 34400 (S1), 34100 (S2), 33800 (S3)
Resistance: 34700 (R1), 35100 (R2), 35500 (R3)
USD/CAD H4 Chart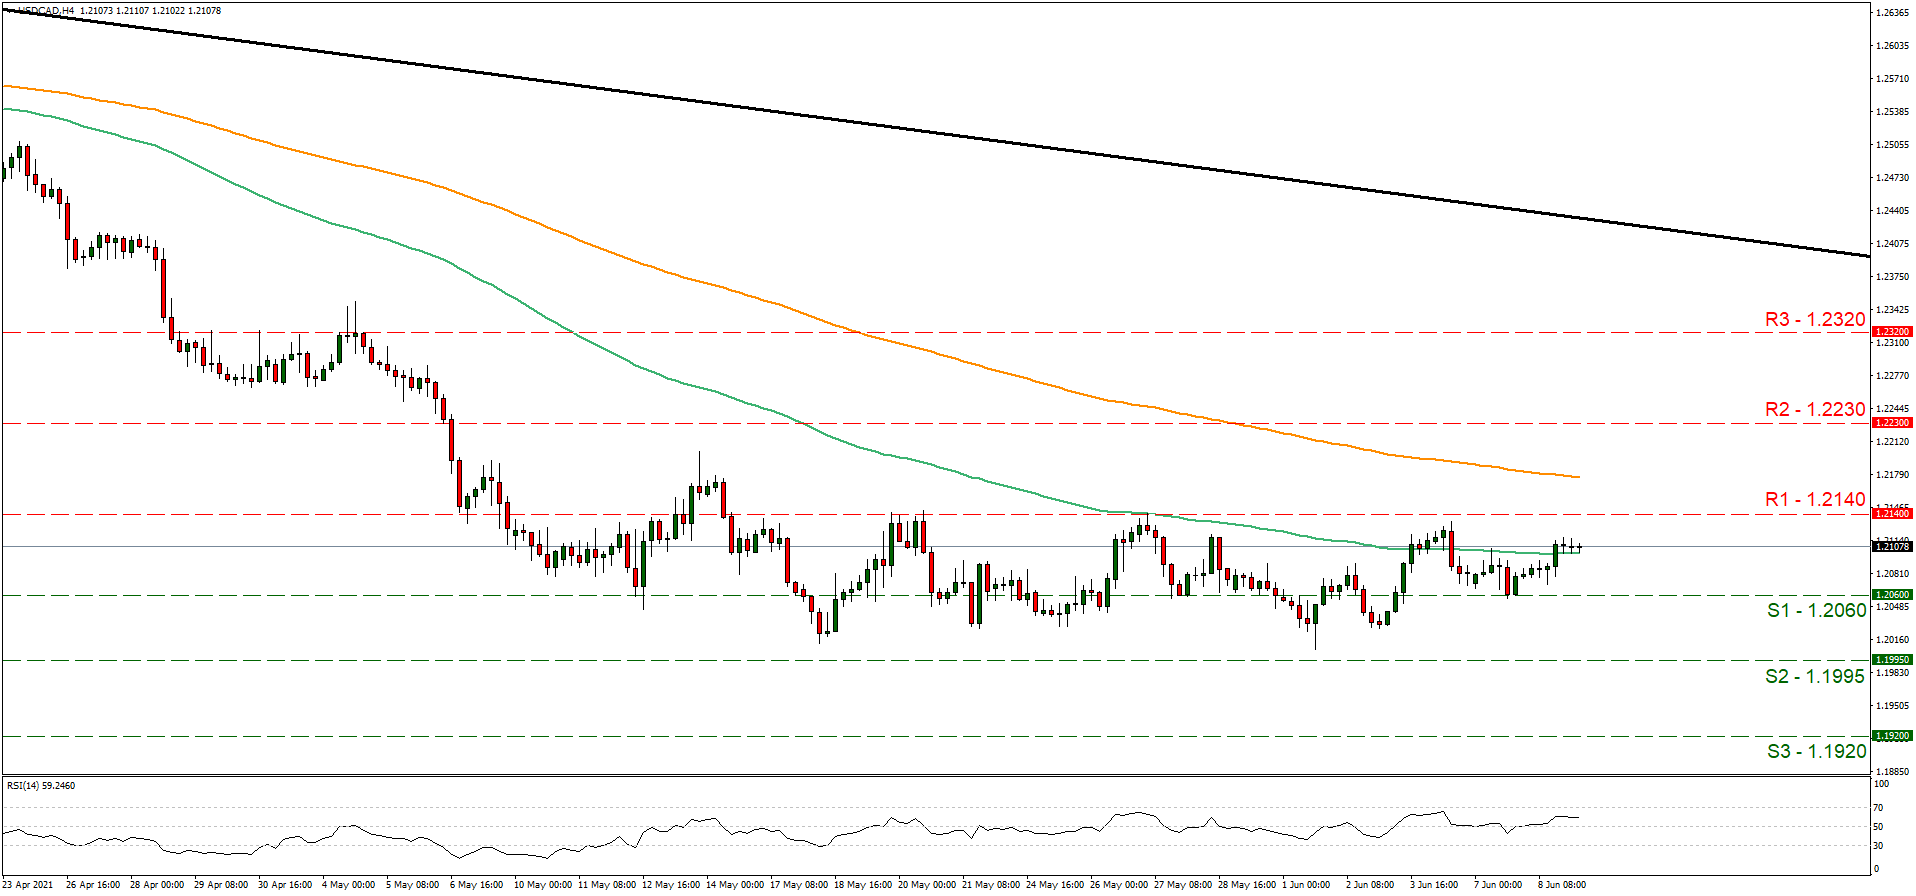
Support: 1.2060 (S1), 1.1995 (S2), 1.1920 (S3)
Resistance: 1.2140 (R1), 1.2230 (R2), 1.2320 (R3)