
Gold managed to finish the previous week moving higher but has lost substantial ground so far in the current week, almost reversing the previous gains. At the same time, the gold market continues to display same inactivity and muted reaction, implying the current market fundamentals may be more supportive for other markets. In this report, we will be emphasizing the main developments from around the world that could be creating volatility for Gold’s price. Our ending will consist of Gold’s technical analysis identifying the most important technical levels.
Gold’s largest daily movement came on Monday the 28th of March, when the price action was dropping throughout the session. This may have been a result of the ongoing strengthening of the USD Index which on the day reached highs tested previously in the early part of March. The dollar has been on an uptrend since the 17th of March possibly supported by a tight labor market and solid economic data from the US. Last week’s US Flash PMI data displayed strength in the Services and Manufacturing sectors, with the readings moving higher, while the weekly Initial Jobless claims was notably lower than the previous and forecasted figure. Evidence of the US economy growing may have not been a positive sign for Gold which tends to respond positive to negative data and vice versa. Since the latest US economic releases improved, the need for Gold as a hedge instrument is limited and may invite bearish tendencies. Gold’s upward movement in the past week was interrupted after the release of the PMIs and may continue to spill in the current week with more releases expected. Currently, we have evidence that the greenback and Gold keep a negative correlation between them.
Despite the somewhat muted price action by Gold in the past week, from our point of view the metal has managed to maintain its movement to higher grounds compared to where it started the year. First and most important Russia’s war in Ukraine is impacting both the supply chains and consequently inflationary pressures. The war has created resentment between nations which have applied a number of sanctions for commodities and energy sources which has seemingly worsened the economic global outlook currently. The overall economic risk may have remained elevated so far in the past month and may continue to do so even as Gold may be shying away from the large swings in the most recent weeks. Moreover, if Ukraine and Russia do not agree on a ceasefire and tensions intensify further, we could be looking at a complete disruption of supply chains that could cause major problems to the global economy like unemployment or stagflation.
On a separate note, in the past days Shanghai boosted lockdown restrictions as local Covid infections jumped to a record. Calculating the loss of economic output from Shanghai’s lockdown may be challenging for now, yet it remains to be seen if it will impact the global economy. Overall China’s surge in new cases is worrying and poses a great threat to the global economy considering its contribution to the world.
In the following days traders expect the March US employment report coming up on the 1st of April. Analysts expect this to be the third consecutive solid employment report in a row for the US economy and the first after the Fed’s rate hike. This event is important, and caution is advised as it can create volatility waves across the board.
Technical Analysis
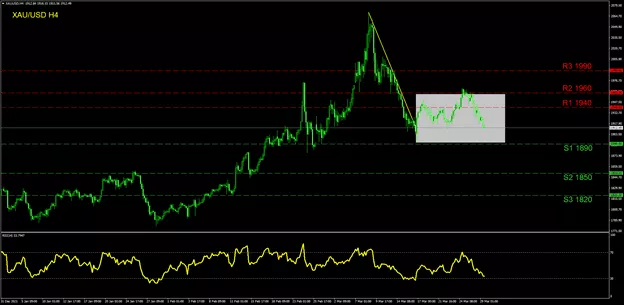
XAU/USD H4
In the most recent sessions, Gold has headed lower and could be moving in a sideways motion. At the moment the trend could be heading towards the (S1) 1890 support level which was last tested on the 28th of February. If the downward trend continues to unfold, we could see a move even lower to the (S2) 1850 line while even lower the (S3) 1820 line is also imminent. If the bulls take charge, we may see the (R1) 1940 level being tested first while the (R2) 1960 was the peak of the upward momentum formed in the past week. At the top, the (R3) 1990 is our highest resistance. We would like to emphasize the grey area on our chart, which the price action has been moving within since the 14th of March. Finally, the RSI indicator below our chart has dropped nearby the 30-level highlighting the recent selling.


