
Gold prices finished positive in the previous week and have ascended to reach a new monthly high in the current, creating further excitement for market participants. Despite Gold’s price remaining nearby familiar levels for the past several weeks, we could say that the recent move higher could be encouraging for further price action to prevail. In this report we aim to bring forth the key fundamentals surrounding the Gold market and a technical perspective of the price action.
Yesterday Monday the 11th, Gold performed its fourth consecutive daily session moving upwards. Along with Gold other precious metals like Palladium where also on the rise with a number of reports pointing to the ongoing war in Ukraine. According to Reuters, during the past Friday Russian platinum and palladium was suspended from trading in London increasing supply bottleneck concerns to the broader market. A disruption of any precious metal supply could elevate economic risks substantially and force traders to trade the risk averse Bullion. Supply bottlenecks have concerned the global economy during the pandemic and have pushed Gold prices to new all-time high levels confirming traders prefer the fast-moving metal during times of unprecedented uncertainty. The Russian war in Ukraine seems to keep traders in an active state allowing us to consider the subject as one of the most important currently for the Gold market.
On a side note, concerns over the trajectory of the US economy seem to be ongoing. Yesterday Federal Reserve Bank of Chicago President Charles Evans stated the Federal Reserve may choose a more aggressive interest rate increase noting specifically a 50-basis points rate hike is a possibility in the upcoming FOMC meeting in May. In the past days, the USD index a measure of the greenback’s strength against other major currencies surged and reached a new 2022 high level. Despite the greenback and Gold prices keeping mostly a negative correlation in play, they have both managed to remain higher in recent sessions. The correlation between Gold and the USD may be questionable currently and, in our opinion, may not be reliable for understanding future price action.
With a rather packed economic calendar for the rest of the week Gold traders could have interesting sessions to work with in the days ahead. On Thursday the 14th of April we get the US Retails Sales rate for March along with the weekly initial jobless claims figure and the very important Preliminary University of Michigan Economic Sentiment for April. On Friday the 15th we get the Industrial production rate for March and in the next week on Tuesday the 19th we get the Housing Starts Number for March.
We end this report by noting that today’s release of the U.S. inflation data could create substantial volatility for the precious metal. Traditionally, higher inflation rates tend to support Gold prices, as bullion has been used as a measure to counter higher good prices. However, caution is advised, and we would suggest that traders keep an open mind as to the actual market reaction. In addition, on Monday inflationary pressures in China were confirmed to be elevated in March possibly adding further to Gold’s upsurge.
Technical Analysis
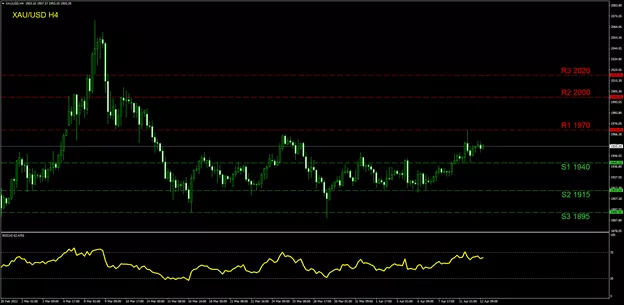
XAUUSD H4 chart
Gold is currently trading between our (R1) 1970 resistance and our (S1) 1940 support level. On Monday a brief upward movement sent the price action reaching the (R1) yet a correction lower was soon carried out. However, the (R1) 1970 line has not been tested since March the 14th making it a strong buying indicator for traders, if the level is to be actually surpassed. In an extended buying trend scenario, traders could also target the (R2) 2000 resistance level or even higher the (R3) 2020 barrier. In the opposite side, a selling scenario could force the price action towards the (S1) 1940 support level which was targeted various times in the past week and was used as both a resistance and a support. Lower the (S2) 1915 support is the lowest level Gold has dropped to in April making it an accurate metric for a selling trend. If the (S2) is breached, the price action could be signaling a change of trend to a selling one making the (S3) 1895 a target. Overall, our personal view is that Gold remains in a sideways motion but due to the recent high it jumped to on Monday, it could also be driven by some bullish tendencies. Besides, the RSI indicator below our chart is currently running across the 63 level, implying some bullish appetite may still be in play.


