
Gold has headed lower for the past two consecutive weeks while remains in a selling momentum in the current, falling to a new 2-month low on the 2nd of May. Clearly Gold’s latest breach below known territory must signal a drastic change in sentiment among traders allowing us to detail some economic developments through this report. We aim to be precise and to the point as an interesting week unfolds with a number of crucial economic events posing as potential movers for the Gold market. Simultaneously, this report will present a technical analysis providing an insight on important technical levels and recent price action.
To make a start, Gold’s downward movement commenced on Friday the 29th of April and seems to persist until today the 3rd of May. In our view, the selling trendline may be correlated to the US economic releases of the previous Friday, which may have enacted a decent bearish interest among traders. On Friday the 29th we got the US Personal Consumption rate which rose to 0.2% from previous revised 0.1% and the Consumption Adjusted rate which jumped to the impressive 1.1% from previous revised 0.6%. At the same time, the Core PCE Price Index rates for March remained steady at 0.3% for the month while the yearly rate ticked down to 5.2%. Please note the Core PCE rates exclude energy prices thus these could be the first signs of good prices stabilizing instead of rising and the rates are optimistic for consumers as some stabilization maybe observed on the headline CPI rates incoming in the following weeks. It could be useful to note, that the Federal Reserve often refers to the Core PCE rates as guidance thus its appearance as a mediocre economic reading could be misleading. Expectations for lower inflation could have invited the sellers for Gold prices. On the contrary, the data is positive for the US economy and provided a temporary boost for the USD Index during the release. In this case, as the greenback received support Gold may have been pushed lower due to their adverse relationship.
Turning to the current week, on the 4th of May during the late US session we get the key economic event of the week with the Federal Reserve’s Interest rate decision meeting. This meeting will consist of the FOMC statement, the interest rate decision and later the FOMC press conference with Chairman J Powell going live. Currently FFF imply a probability of 93.9% for a rate hike of 50 basis points to be enacted sending the overnight rate to 0.875%. Market participants will be interested to know how the Fed will deal with the economy looking forward and how aggressive it is willing to be. In this case a hawkish tone could possibly favor the USD. Yet, due to the market’s anticipation for this important event, we could not rule out the scenario of Gold’s price action undertaking wide swings throughout the decision and press conference.
On Friday the 6th of May we get the important US employment report for April. The US job market had become extremely tight in the previous months and it will be very interesting to see if this notion continued in April. For the time being, the unemployment rate is expected to tick down to 3.5% while the NFP figure is estimated at 400K. This is an event that requires extra caution in our opinion, as the actual figures could create volatility waves across the board and especially for the Gold market.
Technical Analysis
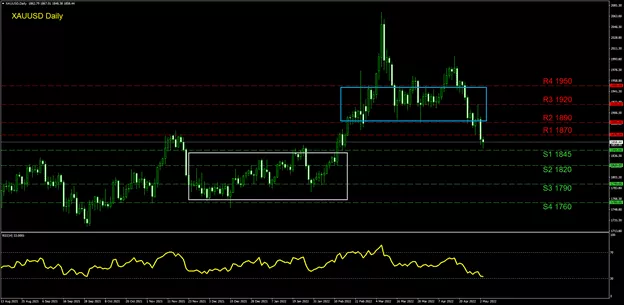
XAUUSD Daily
Due to the incoming economic events mentioned and the increased chances for volatility, we have selected the Gold’s daily chart for today’s technical analysis. With the latest drop to lower grounds, Gold has moved towards the (S1) 1845 support level but has failed to breach it yet. In the scenario of further selling we could see Gold crossing into the lower range of our chart which is highlighted with a gray rectangle. Below the (S1) we note the (S2) 1820 level and lower the (S3) 1790 hurdle. Please note the gray rectangle was used from November 2021 to February and could act as a retesting of some previously familiar levels. If Gold comes under buying interest, we note the (R1) 1870 resistance as the most probable level to be engaged. In the scenario of a move even higher we point out the (R2) 1890 barrier as a possible next target for the bulls. The (R2) has been tested various times in the last days of April thus may be the treated as a make or break point for a bullish trend. In the scenario of a move above the (R2), we highlight the area noted with a blue rectangle which may signal bullish appetite for the precious metal. We would like to note the (R3) 1920 which was tested for the last time on the 29th of April. Finally, the RSI indicator below our chart has dropped below 50 confirming the selling momentum may still be in place. The overall trend in our opinion remains downwards but a possible breach into the blue rectangle area on our chart can change into a sideways trend with bullish tendencies.


