
On May 4, the US Federal Reserve revealed the federal funds rate for the next two months. Even though a 50 basis points hike was widely expected, the future is not so clear. Let’s figure it out bit by bit!
FOMC statement in a nutshell
It’s better to start with a retrospective outlook on the funds rate. Since the Covid-19 began, the Fed kept the rates near 0.00% to boost the economy and decrease the negative impact of supply shortages, lockdowns, and slumps in retail sales. You can see a sharp decrease in rates in the figure below.
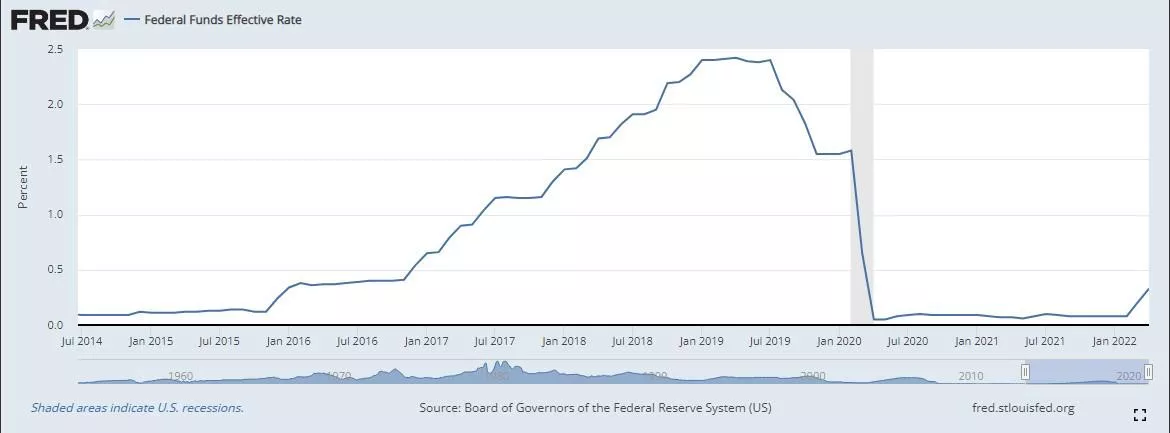
Low rates, $8 trillion printed over two years, and the slow down of the pandemic created a perfect field for inflation to rise. Now, it’s at a 40-year high, and the time has come for strict monetary tightening.
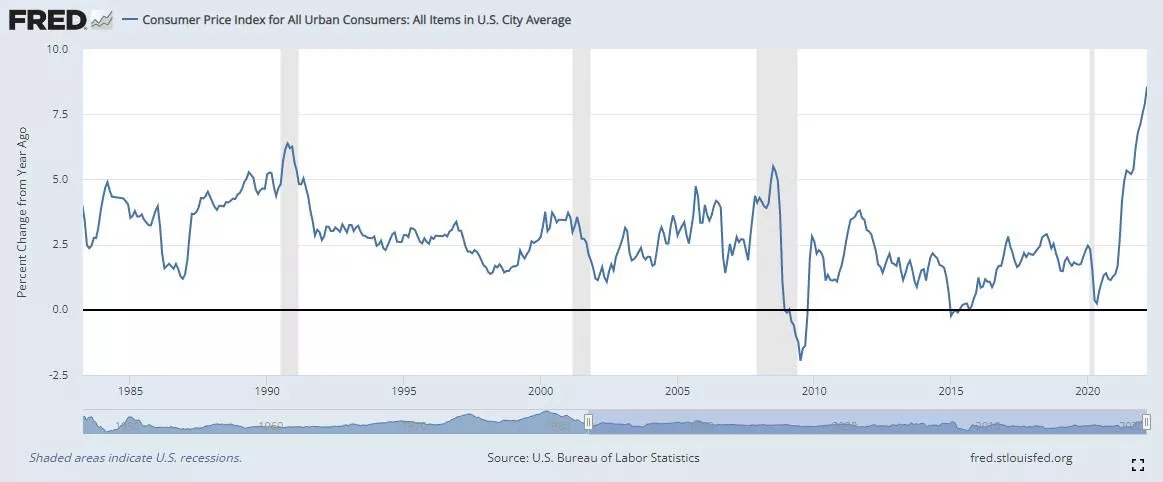
What could go wrong? Well, the war in Ukraine started and caused even more supply shortages. Now, the prices for oil and wheat are rising, so inflation is not likely to end anytime soon. The prices will keep increasing, but here’s the good news. Inflation has probably peaked, and the 8.5% CPI is likely to be the highest point we will see in the next several years. At least, the economy looks this way.
The Fed thinks the same. The Fed stated that inflation has peaked and will decrease over time in their report. Before the FOMC statement came out, the market expected a 50 basis point hike in May and a 75 basis point hike in July 2022. In the statement, Fed chair Jerome Powell said the Fed has no reason to hike rates so aggressively. Thus, the next rate hike will likely be not 75, but 50 basis points increase, which is positive for every risk asset like stocks or crypto.
Stocks’ biggest gain since March
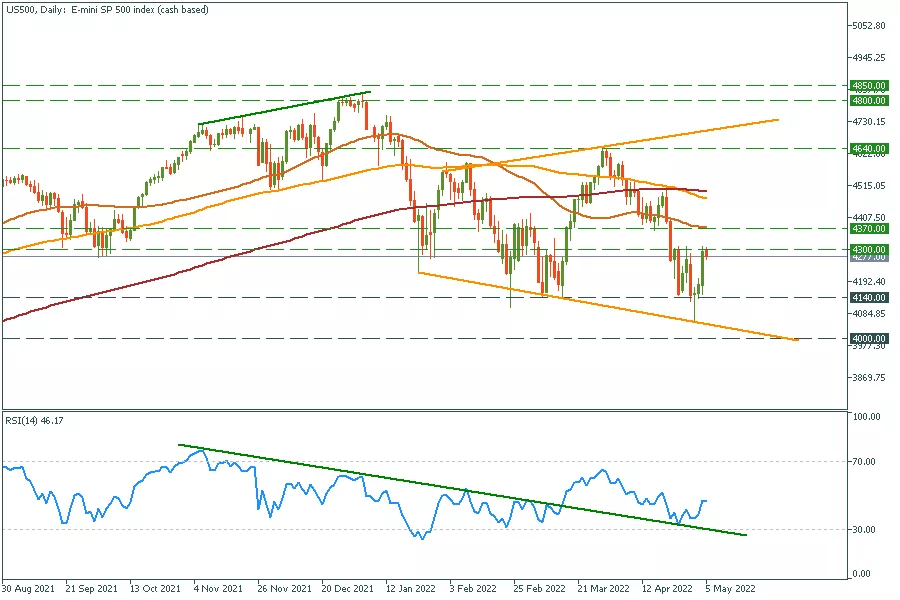
US500 (S&P500) gained almost 3% after the FOMC statement. It’s not a change of the downtrend – the stock market is still under heavy pressure, and there are few positive factors. There is an investment strategy for stocks based on seasonal demand called “Sell in May and go away.” In theory, the period from November to April has significantly stronger stock market growth on average than the other months. Positive news from the Fed will boost the index higher, but not for long.
As for the chart, the US500 formed a daily reversal candle on May 2. Also, we see a bounce from the RSI oscillator. Currently, we are at a crossroad, so watch closely after the support of 4000 and resistance of 4370. We bet there will be a volatile move in the direction of the breakout.
US500 daily chart
- Resistance: 4300, 4370, 4640, 4800-4850
- Support: 4140, 4000
Gold and USD outlook
As we stated at the beginning of the article, inflation is here to stay. Most of the time, it’s a bullish factor for the gold price because even with shrinking inflation, prices will keep rising. Thus, the greenback will feel weaker for months, if not years.
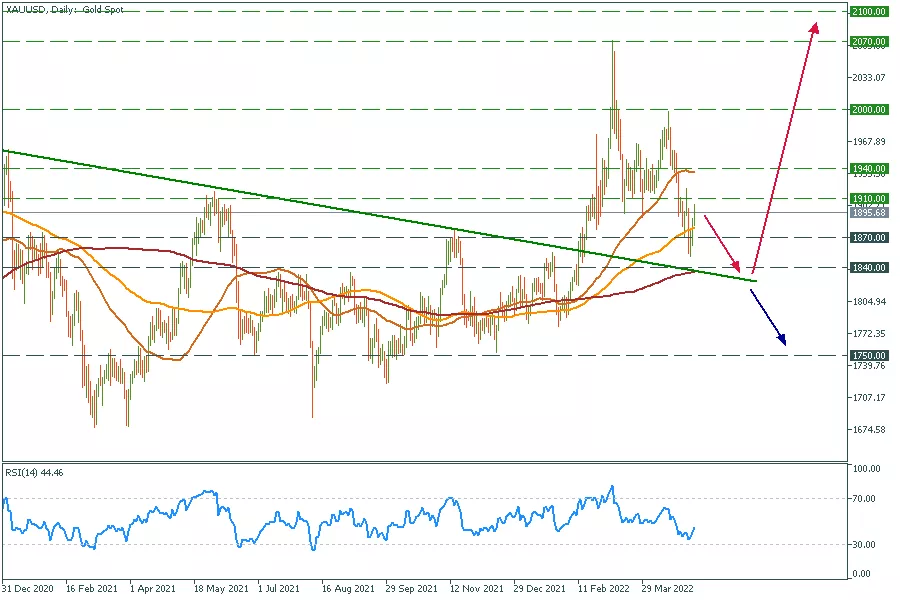
Still, we wait for the gold to touch the $1840 support line and hold in this area. This is a trendline that worked for gold for more than two years. Thus, gold must consolidate for some time near this area and then skyrocket with targets at $2000, $2500, and higher. In the worst scenario, gold may fall below the trendline, and the bearish trend will start.
XAUUSD daily chart
- Resistance: 1910, 1940, 2000, 2070, 2100
- Support: 1870, 1840, 1750
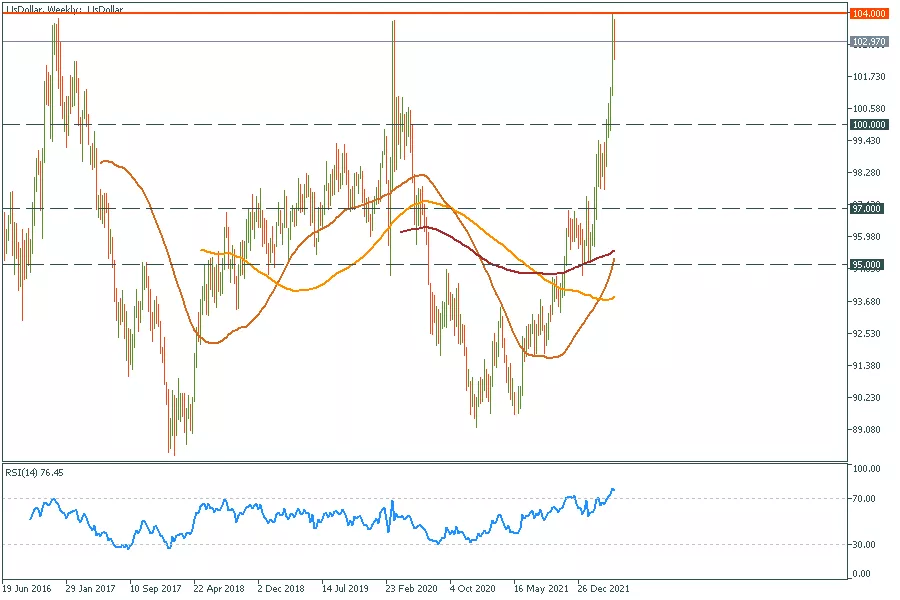
On the contrary, the DXY (the US dollar index) is at the strongest resistance in five years. Thus, we expect a massive reversal from the 104.00 resistance line, another positive factor for gold.
US Dollar weekly chart
- Resistance: 104.00
- Support: 100.00, 97.00, 95.00


