
WTI prices continued to move in a rather tight range for the past several weeks, indirectly displaying some uncertainty in the Oil market. Traders have a lot of information to consider at this point, with a number of geopolitical and technical subjects moving prices and making things interesting for market participants. In this report, we will explain the main subjects driving Oil prices currently and provide our personal views on how the market could react to them. We intent to close this outlook with a technical analysis displaying levels and trends that could prove useful.
The Oil market’s sensitive nature towards geopolitical tensions is currently exposed with the ongoing Russian war in Ukraine. Energy prices in general have headed higher since the war has started more than 2 months ago. Yet in the past days the situation may have escalated with Russia and the EU imposing sanctions on each other for countries buying Oil and Gas. Some commodity traders will be banning their purchases of Russian Oil by May the 15th. As the war continues, we could see more European nations moving away from Russian Oil and subsequently creating some worries in the market. Russia on the other hand may find it more suitable to push further Oil into Asia. However, the International Energy Agency (IEA) through its Oil market report for May, stated it did not see Oil supply levels being impacted by sanctions on Russia. The constant rise in output by both the US and the OPEC plus group in the coming months could compensate for the loss, while the lower demand from China as a result of the ongoing lockdowns imposed in some provinces may defend the situation as well.
Moreover, excluding Russia from global Oil supply could put further pressure on other Oil producers like Saudi Arabia and the US, requiring them to be even more consistent with output. In the scenario of any other Oil supply disruptions from other major Oil producers, we could see Oil prices being lifted further.
On Wednesday the 11th of May the important Energy Information Administration’s (EIA) Crude Oil Inventories weekly release displayed the large 8.5m barrel surplus. This is the second highest surplus in the current year for the EIA and WTI dropped approximately $0.50 upon release. WTI’s price reaction could be implying that trader’s attention for now remains on the subjects we mentioned above and not the weekly releases. As we are referring to the US Oil production, we must note that Oil analysts expect countries maneuvering Russian Oil to be turned towards West Texas Intermediate possibly favoring US Oil companies like Exxon Mobil (#XOM) and Chevron (CVX). The stocks of these companies have managed to gain on a year to date basis, as the ongoing circumstances driving the Oil industry are working towards their advantage.
On a separate note, we would suggest traders to constantly monitor developments in China as they could prove crucial for predicting future price action. China’s virus lockdowns could impact global demand and subsequently move Oil prices. In our opinion, if further lockdowns are announced or even prolonged, we could see Oil prices moving lower as China remains the largest Oil consumer internationally.
Technical Analysis
WTICash H4
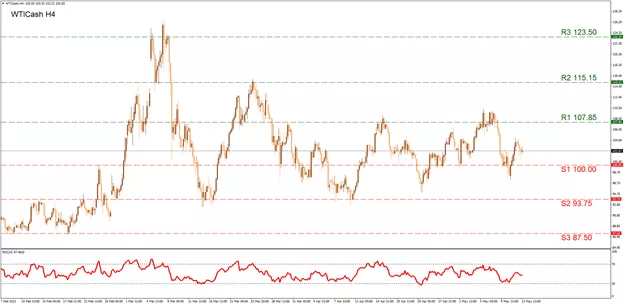
WTI continues to trade in a large sideways motion between our currently noted (R1) 107.85 resistance and the (S2) 93.75 support level. This range is currently highlighted on our chart, with sky blue in order to emphasize the current trend. If the (R1) 107.85 is clearly breached, then a move towards the (R2) 115.15 line is likely imminent. Our highest resistance remains the (R3) 123.50 barrier which was last tested in March and remains the year to date high for WTI. In the opposite direction, a move below the (S1) 100.00 support barrier, could force the price action even lower towards the (S2) 93.75 hurdle. Please note the (S2) has not been breached downwards since late February making it a solid barometer for the strength of a bearish momentum. As our final support we note the (S3) 87.50 which could be engaged in a rather intense selloff scenario. The RSI indicator below our chart seems to be running across the 47-level displaying some bearish interest in the short term.


