
U.S. Highlights
- June’s housing data showed another decline in activity as the effects of higher mortgage rates and stretched affordability impact the market.
- A strong labor market and tight inventories will support housing construction and limit the downside risks.
- Despite the slowdown in the housing market the Fed will keep up its fight against inflation with another 75-basis point hike next week.
Canadian Highlights
- Inflation hit a 40-year high this week, coming in at 8.1% in June. That said, it undershot consensus and monthly CPI growth slowed markedly, with cooling across most major categories.
- Still, the sky-high inflation rate will keep the Bank hiking aggressively, with a 75 bps move priced in for September.
- Real retail spending increased in May but likely fell in June, suggesting softer goods spending momentum entering Q3.
U.S. – Softening Housing Market Won’t Deter Fed
This week’s housing data showed that the market continued to slow meaningfully through June. Yet, as inflation continues to linger at multi-decade highs the Fed will keep up the fight against rising prices by raising rates another 75-basis points (bps) next week. Fortunately for the housing market a strong labor market and tight inventories will support construction and limit the possibility of a rapid deterioration of conditions.
On Tuesday the Census Bureau released June data on national housing starts. Overall, starts pulled back 32k units to 1,559k (annualized) in June, touching their lowest reading since last September. However, the entirety of the decline was attributable to weakness in the single-detached segment (-86k) as multifamily construction rose another 54k. The multifamily starts registered 577k units, and apart from April’s 632k and January 2020’s 601k, this is the strongest reading since the late 1980s. Permitting activity pulled back as well, falling 10k to 1,685k (annualized). Again, the multifamily segment showed ongoing strength, with permits rising 74k, while the single-family segment pulled back 84k.
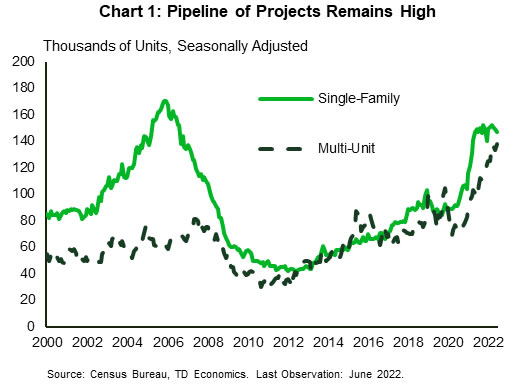
Looking forward, there still looks to be healthy support for construction in the coming months. The pipeline of projects (as measured by units authorized but not started), is at a multi-decade high with a near even split between multi-unit and single-family structures waiting to get shovels in the ground (Chart 1). As raw materials prices come down, and supply chain issues gradually fade, the opportunity for more projects to get underway increases.
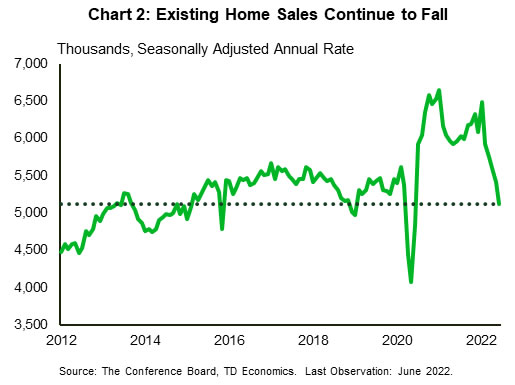
Indeed, more construction will be needed as this week’s existing home sales data showed there was roughly 3.0 months’ worth of inventory in the market – still below what is a balanced market. That said, amid falling affordability sales are slowing markedly. June’s existing home sales data reflect just that as sales fell to 5.1 million units (annualized) – the lowest reading since June 2020 (Chart 2). The slowdown in sales activity helped push the seasonally adjusted median sales price down 0.2% on a month-over-month basis. However, affordability continues to be stretched, particularly for the single-family segment. Combined with elevated mortgage rates this should continue to cool housing sales in the coming months.
Given the exuberance in the housing market over the past two years, the Fed’s mandate to fight inflation, and the strains on affordability, the slowdown in the housing market was expected. Indeed, residential investment is likely to contract well into 2023. That said, the moderation is simply helping bring the economy back to a pre-pandemic composition.
Despite the slowdown in the housing market the Fed will keep up its fight against inflation with another 75-basis point hike next week. The unemployment rate is still holding at 3.6%, while last week’s CPI print showed inflation hit 9% year-over-year in June. A strong labor market and inflation far from target means policymakers will continue working hard to keep inflation expectations anchored and bring down the pace of price gains.
Canada – 8.1 and Silver Linings
This week’s hotly anticipated CPI report revealed yet another multi-decade high for inflation in June. At 8.1%, inflation touched its fastest pace since 1983, with significant year-on-year accelerations recorded in clothing and footwear prices (as they continue their climb back to pre-pandemic levels) and transportation (thanks to gasoline, and a bump in new vehicle prices linked to the roll out of new models). The latter saw further support from surging airline fares while the travel bug also boosted annual price growth in recreation services. Meanwhile, measures of core inflation remained elevated, with the average of the Bank of Canada’s three measures sitting at 5%.
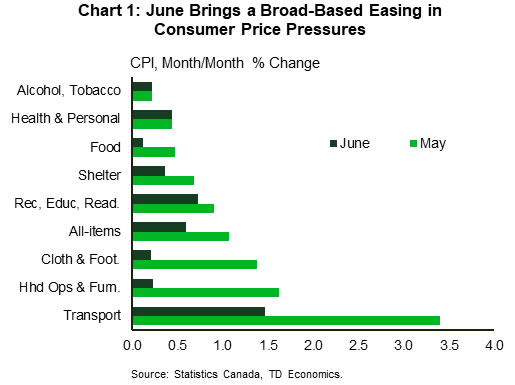
Although an 8.1% inflation print is clearly nothing to cheer about as it will keep pressure on the pocketbooks of Canadians, oddly enough, it could have been worse. Indeed, June’s print was south of consensus, which was expecting an 8.4% gain. However, what was especially eye-catching was the steep deceleration in month-on-month CPI growth to an (admittedly still-hot) 0.6% rate. Monthly slowdowns were seen in 6 of 8 major industries (Chart 1), with particularly notable easings recorded in transportation (on less of an impulse from gasoline prices) and household operations and furnishings. The hits kept coming however, as growth in shelter prices eased, while we also saw a second straight significant slowdown in monthly food inflation. Looking ahead to July, we should see some further improvement, as gasoline prices have tumbled 13% from their early June highs.
While the Bank of Canada will no doubt be heartened by these trends, they know that their battle to wrestle inflation back down to target is far from over. Indeed, in an interview this week, Governor Macklem acknowledged the likelihood that inflation would sport a 7-handle for the rest of the year, with our own forecast looking for something similar. As such, policymakers will be keeping monetary policy on an aggressive path, with market pricing heavily skewed towards a 75 bps move in September.
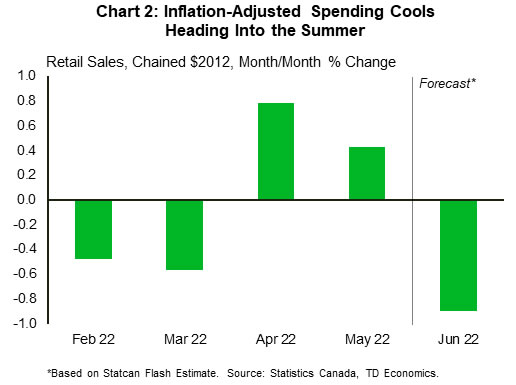
Both our own and the Bank of Canada’s forecast anticipates a slowdown in consumer spending moving forward, as elevated inflation and rising borrowing costs bite. We, like the Bank, also expect a continued rebalancing away from goods spending and towards services. This morning’s retail sales report played into these themes to some degree. While it’s true that inflation-adjusted retail spending was firm in May (all but guaranteeing a strong second quarter print), the flash estimate for nominal spending in June was modest. And, with goods inflation rising sharply in June, the implication is that sales volumes declined that month (Chart 2). Absent timelier data on services spending, we can’t be 100% certain that the “rebalancing” part of our forecast remained on track. However, the weaker June flash data points to weaker goods spending momentum heading into the summer.


