
The central issue for the economies and markets will be the evolution of inflation over 2023.
Westpac forecasts that headline inflation in Australia will peak at 7.4% in 2022 (December quarterly result to be released on January 25).
That read will be an increase from 6.3% in the year to June 2022. We expect headline inflation in 2023 to slow to 3.7% – well below the Reserve Bank’s current forecast of 4.7%, although it is likely that the RBA will lower its forecast in the February Statement on Monetary Policy.
While lower than the current official forecast the annual print in 2023 will still be well above the Bank’s 2–3% target range, most likely precluding it from easing policy anytime in 2023.
With inflation running well above the target range it seems it will be reluctant to ease policy during 2023 despite a stagnating economy; a rising unemployment rate and a slowdown in inflation momentum in the second half of 2023.
Figure 1, sets out the forecast contribution to inflation from the key components, highlighting the evolution of those components in 2023.
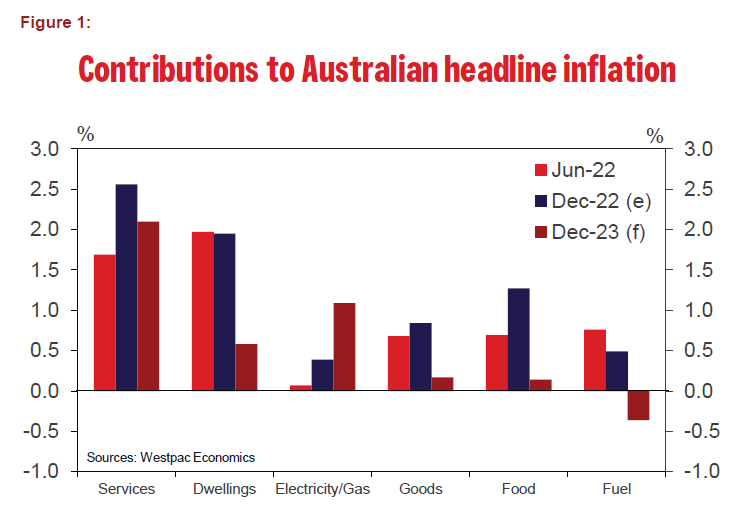
Key factors to note are:
- The contribution to inflation from dwellings and rent will slow dramatically in 2023. In particular dwelling costs which contributed 1.87 ppt’s to inflation in the year to June 2022 and 1.70 ppt’s to December will slow to 0.29 ppt’s in 2023. Rents themselves that lifted from 0.1 ppt’s in June to 0.25 ppt’s in December are likely to hold at 0.29 ppt’s in 2023. The trend in the slowdown in dwelling costs is already underway with the monthly measure showing that dwelling costs have slowed from 1.5–2.0% per month in the middle of 2022 to only 0.1 % in November following 0.5% in both October and September.
- The services measure used in Figure 1 combines both private sector and public sector (including both health and education) services. The lift in the services contribution between June and December is apparent (1.69 ppt’s up to 2.56 ppt’s). This measure most closely captures the impact on inflation of rising wages. We expect wages growth to lift from the 3.1% recorded for the September quarter 2022 to 4.5% by June before slowing in the second half. Although over the year we have a slowing in the contribution relative to December (2.1 ppt’s) the risks on this component are to the upside. Because these forces most closely capture the “demand” element they are likely to keep the RBA on “inflation alert” during the first half of 2023. The slowing in these pressures is expected in the second half of 2023 and will provide the RBA with some comfort to remain on hold in the second half of 2023 with a view to easing policy in 2024.
- Easing supply chain pressures not only directly lower building cost inflation but direct goods inflation. We expect goods to contribute only 0.17 ppt’s in 2023 down from 0.84 ppt’s in 2022.
- Fuel and food prices are also expected to contribute to the slowdown in inflation in 2023 – food 1.27 ppt’s in 2022 down to 0.14 ppt’s; fuel: 0.76 ppt’s in June and 0.49 ppt’s in December. Down to –0.36% in 2023.
- Partially offsetting these positive developments is energy with electricity/gas contributing 1.09 ppt’s in 2023 compared to 0.39 ppt’s in 2022.
So, for Australia the forecast reduction in inflation in 2023 of 3.7 ppt’s (from 7.4% to 3.7%) is driven by dwelling costs (1.38 ppt’s); food (1.13 ppt’s); goods (0.68 ppt’s); and services (0.46 ppt’s).
Markets are currently focussing on the theme that global inflation is falling faster than expected and that should be an encouraging signal for central banks.
We agree that inflation relating to supply chains and other supply shocks is largely a global story. Our forecasts for 2023 certainly incorporate those messages – around building costs; fuel; food and goods.
But the demand factors in Australia, largely captured by services, are likely to intensify in the first half of 2023 before easing in the second half.
Those intensifying demand pressures should keep the RBA in tightening mode in the first half of 2023.
The “global theme” is best captured by the inflation developments in the US.
Figure 2, shows our assessments of the contribution to inflation of the comparable components in the US, including estimates of the components making up our (top down) forecast of 2.3% headline inflation for the US in 2023.
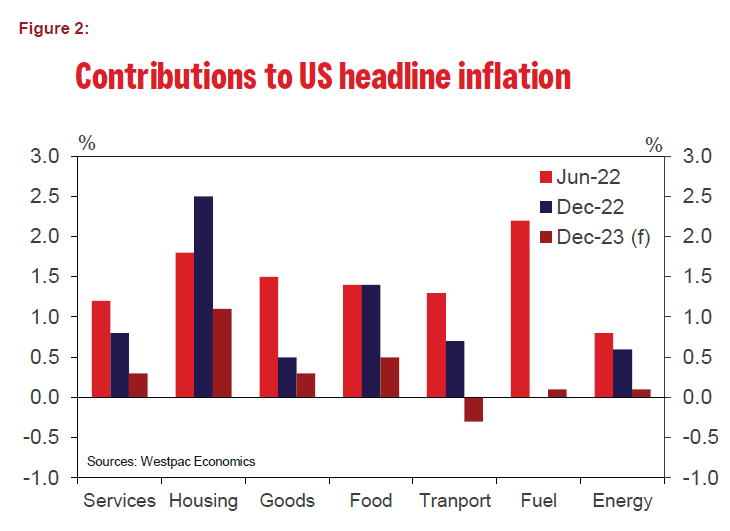
The figure shows that actual headline inflation in the US slowed from 9.1% in June 2022 to 6.5% in December. That compares with our forecast lift in inflation over the same period in Australia from 6.3% to 7.4%.
Some points to note:
- The services contribution to inflation slowed between June and December in contrast with Australia. This is likely to be explained by Australia being behind the US on the wages and labour market cycle; while wages growth is set to accelerate in Australia it seems to have peaked in the US.
- Easing of supply chain pressures has already become apparent in goods inflation in the US and that is expected to ease further in 2023, as we expect for Australia.
- Easing in food pressures is expected in the US along similar lines to Australia.
- Over 2023, housing pressures in the US (as measured by owners equivalent rents) are expected to ease substantially, just as we are seeing in Australia (although Australia takes a different approach to measuring housing cost pressures). In the US market driven rents are already falling although there will be lag before those effects show up in US inflation significantly reducing shelter’s contribution to inflation through 2023.
- A major difference between Australia and US inflation in 2023 is expected to be around utility inflation (electricity/gas) where Australia’s market rigidities are expected to boost inflation in 2023 whereas in the US markets are operating efficiently
Conclusion
Inflation is expected to ease substantially in both Australia and the US in 2023. Supply issues, which represent global pressures, associated with housing; goods; food; and fuel will all generate downward pressure on inflation.
However, the key services inflation cycle looks to be ahead for Australia while it is slowing in the US. Wage inflation in Australia is still lifting as labour markets remain tight through the first half of the year.
Headline inflation in Australia will also be held up in 2023 by rising gas and electricity prices.
The high starting point for inflation and initially slow progress should mean that both the Federal Reserve and RBA have more work to do before remaining on hold in the second half of 2023.
With Australia’s inflation cycle behind the US and both central banks facing much higher, albeit slowing, inflation than their target levels it seems appropriate that they will continue to tighten through the early months of 2023.
On this basis that the demand cycle in Australia is lagging the US it also seems prudent for the RBA to be behind the FOMC on the cycle.
We expect that the FOMC’s tightening cycle will peak at the March FOMC meeting while the RBA will persist for a little longer with the peak being in May.


