
U.S. Highlights
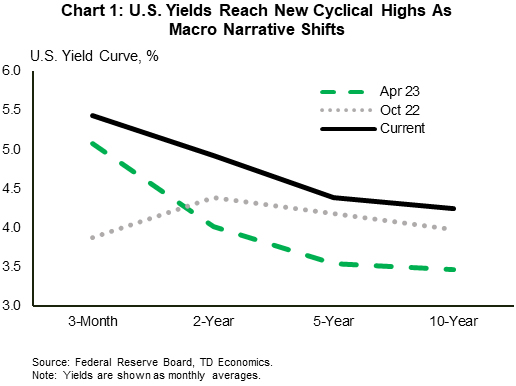
- The big news this week was U.S. Treasury yields reaching the highest point since 2007 thanks to a string of positive economic data releases. The 10-Year yield reached 4.30% on Thursday, surpassing last October’s high.
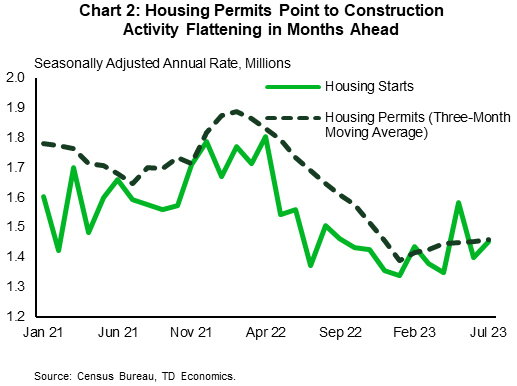
- July’s retail sales data was one of those positive releases, as a stronger-than expected monthly gain underscored the resilience of the consumer. And July housing starts was another: starts rose modestly despite high mortgage rates. Mortgage rates hit a 21-year high this week, in line with higher Treasury yields.
- The FOMC minutes also played a role taking yields higher, as they showed that Fed officials see upside risks to inflation, which may warrant further tightening in the policy rate.
Canadian Highlights
Everyone wants to know what the Bank of Canada is going to do next. With recent data coming in stronger than expected, odds of another rate hike have increased.
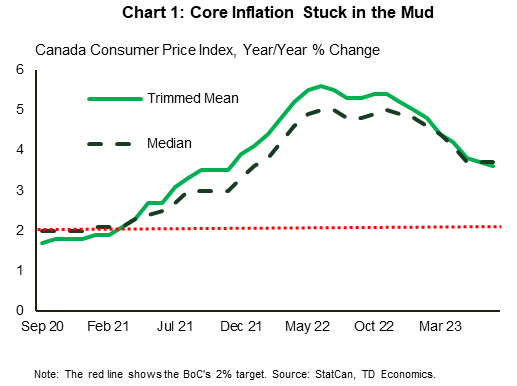
Canadian inflation data have been uncooperative, with headline picking up on higher gas prices. Even more worrying has been the lack of progress on core inflation.
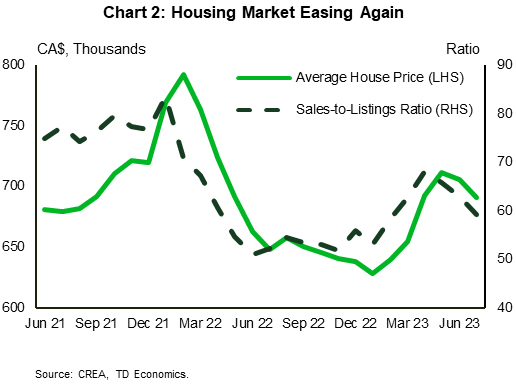
The one area of the economy that has responded to higher rates has been the housing market, which has seen both sales and prices drop as buyers adjust to higher mortgage rates.
U.S. – Yields Drift Higher, As Macro Narrative Shifts
U.S. Treasury yields continued to climb higher this week, following a string of positive economic data releases. With the macroeconomic narrative shifting away from recessionary back towards soft landing, investor sentiment has also swung back in favor of rates needing to stay ‘higher for longer’. Current market pricing on the fed funds rate doesn’t fully price in the first rate cut until May of next year, with a relatively shallow trajectory on the policy rate through H2-2024. This is a sharp U-turn from just a few months ago when market participants had priced over 100 basis points of cuts through the second half of this year alone! As a result, yields across the curve are well off their April lows and have now even surpassed last October’s highs (Chart 1).
Nowhere has the theme of resilience been more on display than across the consumer segment, and that narrative has clearly carried over into the third quarter. Retail sales for July surprised even the most optimistic forecast, rising by an impressive 0.7% month-on-month (m/m) – its strongest monthly gain since January. Stripping out the most volatile items such as sales at gasoline stations, auto dealers and building supply stores showed even more strength – rising 1.0% m/m – with the largest gain coming from non-store retailers (+1.9% m/m). Indeed, some of the extra vigor was likely due to Amazon Prime Day – suggesting we could see some giveback in the months ahead. However, spending was fairly broad-based across most categories, with 9 of 13 retailers reporting gains. Even being conservative on our monthly assumptions for August/September, Q3 consumer spending is still tracking somewhere close to 3%, nearly doubling last quarter’s gain of 1.6%.
In contrast to the consumer, the housing sector has been one area of the economy that has certainly felt the impact of higher interest rates over the past year. But even here there are some early signs of stabilization. Home construction ticked modestly higher last month, rising by 3.9% m/m to 1.45 million units. Gains were entirely in the single-family segment, which are now up 22% from last November’s low. Flattening material costs alongside a shortage of lived-in homes for sale have been key factors underpinning construction activity across this segment in recent months. Still, further gains over the near-term seem limited. Permitting activity – a good leading indicator of future projects – has flattened in recent months, while builder confidence ticked down for the first time in 7 months in August alongside the recent surge in mortgage rates, which currently sit at a 21-year high of 7.1% (Chart 2).
Given the continued resilience in the economy, it’s no wonder the minutes from the FOMC’s July 25th-26th meeting showed that the majority of members think the inflation fight is far from over and could require additional tightening in the months ahead. Most forecasters are tracking +3% growth for the third quarter and the Atlanta Fed’s forecasting model is predicting 5.8%! While recent readings on inflation have been favorable, the economy will need to slow considerably to keep sustained downward pressure on inflation without requiring further rate hikes.
Canada – Reading the Inflation Tea Leaves
Everyone wants to know what the Bank of Canada (BoC) is going to do next. Given the Bank’s dependence on incoming data, each economic release is being poured over to determine whether the Bank has hiked rates high enough. While it is clear that interest rate sensitive sectors have retrenched again after the BoC’s June and July hikes, readings on inflation have been found wanting. This has increased the odds of another rate hike this year, pushing government bond yields to new cycle highs.
When the BoC jumped off the sidelines to hike rates again in June, it did so for three reasons. The first was continued strength in consumer spending fueled by robust employment gains. While there has been a loosening in labour markets given the rise in the unemployment rate to 5.5% in July, from 5.0% in May, there is still more to go before consumers start tightening their purse strings. The second factor was the fear that underlying inflation dynamics would cause price growth to remain stuck above the Bank’s 2% target. More on that below. And the third factor that irked the BoC was the resurgence of the real estate market following a year-long rout in response to the BoC’s aggressive rate hikes through 2022.
On the inflation front, we had been warning all year that getting inflation to fall from its starting point of 6% year-on-year to 3% y/y would be much easier than going from 3% y/y to 2% y/y. And sure enough, even though inflation fell to 2.8% y/y in June as expected, it jumped up to 3.3% y/y in July. Underlying core inflation metrics also disappointed, as they appear to be stuck around the mid-3% level (Chart 1). This speaks to the stickiness of price pressures. With Canadian consumers spending like ‘Swifties’, prices for flights, hotels, and going out to restaurants have surged. This trend will likely have raised concerns at the BoC that it will take even longer than expected for inflation to settle around 2%.
While recent rate hikes have not hit inflation yet, they have quickly impacted the housing market. Since the restart of rate hikes in June, the 5-year discounted mortgage rate has surged by around 1%, putting pressure on affordability. Residential sales have responded, turning negative in July – the first negative print since January. At the same time, listings continue to rise, which has forced the sales-to-listings ratio and average prices lower (Chart 2). More weakness may be in store for the housing market in the coming months as it adjusts to the new higher rate environment. In this way, the BoC has tamped down the risks stemming from the real estate market. And while this market is always the first to turn, the BoC will need more evidence from other areas of the economy before it feels comfortable moving back to the sidelines.


