
U.S. Highlights
- Revisions to GDP data left Q2 growth unchanged, but consumer spending growth was cut in half. Monthly consumer spending data showed that following at strong gain in July, real consumer spending slowed in August.
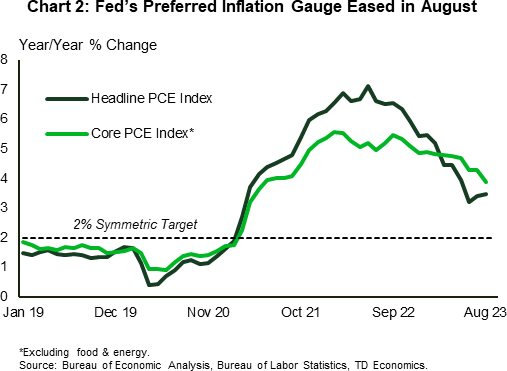
- The Fed’s preferred inflation gauge, the core Personal Consumption Expenditures (PCE) deflator, eased from 4.3% year-on-year to 3.9% in August. However, headline PCE inflation ticked up a notch as energy costs surged higher on the month.
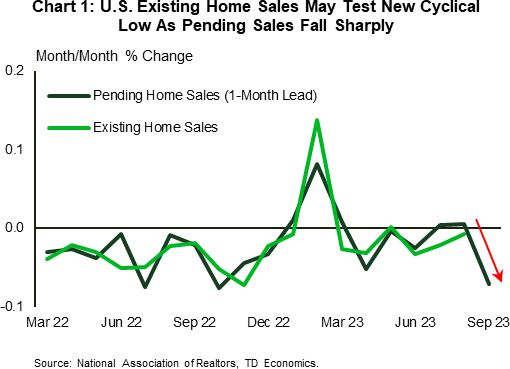
- Pending home sales, which lead existing home sales by 1-2 months fell a sharp 7.1% in August, as mortgage rates crept above 7% that month.
Canadian Highlights
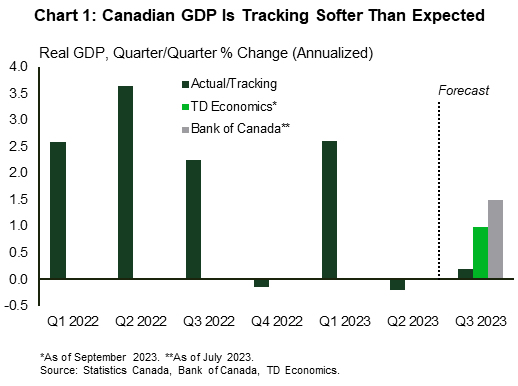
- The monthly GDP report suggests that growth remained stagnant in the third quarter – slower than expected in our recent forecast.
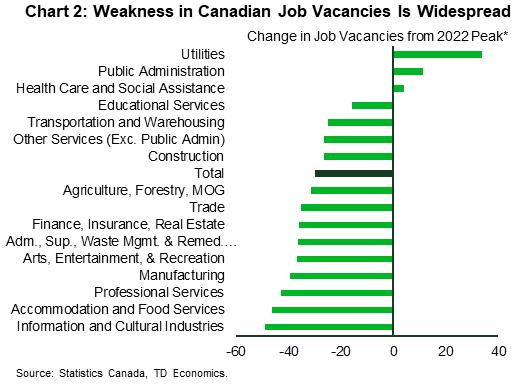
- The labour market is finding a better balance, with payroll employment remained largely unchanged and job vacancy rates reaching the lowest level since May 2021.
- Acceleration in July’s average weekly earnings is one data trend that doesn’t fit the pause story. The Bank of Canada will watch closely the next week’s more timely wage report for September.
U.S. – Yields Realign to Higher-for-Longer
The Fed has been beating the drum to the “higher for longer” interest rate tune for a while. Following last week’s FOMC projections, investors are recalibrating their expectations more in line with this view. Long-term treasury yields pushed higher in the week, with the 10-Year yield rising temporarily to a new 15-year high on Thursday, before easing to 4.53% at time of writing – still almost 10 basis points above last week’s close. Equity markets trended lower through the week, but managed to recoup most of the lost ground after Friday’s soft inflation print.
Revisions to GDP data led to a minor growth upgrade for the first quarter, but left the second unchanged. However, the picture was more nuanced underneath. Most notably, second quarter consumer spending growth was cut in half, to only 0.8% q/q (ann.). August’s Personal Income and Spending data out Friday help fill in the picture for the third quarter. Real disposable personal income fell for the third month in a row in August, while real spending (PCE) growth eased to 0.1% month-on-month (m/m), following a strong 0.6% m/m gain in July. That strength early in the quarter will still make for a strong showing for the consumer, however many hurdles are looming for the fourth quarter (see forecast). Our view is that consumer spending and economic growth will cool along with the weather this autumn, with September’s pullback in consumer confidence reinforcing this view.
Housing, which was the first part of the economy to weaken in the face of rate hikes, continues to struggle. Pending home sales, which lead closed sales by 1-2 months, fell a very sharp 7.1% (m/m) in August (Chart 1). This suggest that existing home sales could soon test new post-2010 lows. The shortage of existing homes for sale has been an added obstacle for transactions. Until recently, homebuyers appeared to have found some solace in the new home market, aided by healthier inventories and builder incentives. But with mortgage rates creeping above 7% in August, this sector is also feeling the pinch. New home sales (an inherently volatile series) trended lower that month. Daily measures show that mortgage rates have risen even higher recently and are now hovering in the 7.4%-7.6% range, a level that will surely further limit the pool of homebuyers.
Besides the challenges faced by the consumer, the UAW’s decision Friday to expand its strike and the increasing likelihood for a government shutdown next week, mark two other major potholes for the economy heading into the fourth quarter (see report). The shutdown would not only act as a drag on growth but would also delay access to key economic data, with next week’s payrolls report and the October 12th (CPI) inflation report the next two major items on the list. Having timely access to these reports is crucial with inflation still running well above target.
Thankfully, Friday’s PCE report carried some good news on the inflation front, with the Fed’s preferred inflation gauge easing from 4.3% to 3.9% year-on-year in August(Chart 2). However, the headline measure moved in the opposite direction, given an acceleration in food and energy costs. With the price of crude oil creeping higher to $93 per barrel, energy costs are likely to continue putting upward pressure on the headline measure over the near-term. All in all, it’s still a mixed picture, one that may be further complicated by a government shutdown.
Canada – More Evidence for A Pause
As we draw closer to the Bank of Canada’s next rate decision on October 25th, market participants are digging into the latest data to gauge what the Bank will do. This week’s data provided some supporting evidence for a pause, although next week’s jobs report will likely bear a heavier weight in the final decision. For now, markets have shifted their bets for another rate hike from a 50% chance to a 35% one.
Fresh off the press, the monthly GDP report suggests that growth remained stagnant in July and edged up just 0.1% month-on-month in August. With two months of data for the third quarter in hand, real GDP growth is tracking only 0.2% (annualized) – below our recent forecast(Chart 1). This suggests that the recovery from wildfire impacts in the mining and accommodation and food services sectors wasn’t enough to weigh against the drag from the B.C. ports strike, and more restrictive monetary policy. Worryingly, the manufacturing sector contracted for the second month in a row, accounting of the largest share of today’s drag. But there too, Statistics Canada pointed out that the B.C. port strike contributed to weakness in the chemicals industry, which contributed to manufacturing’s soft showing.
The labour market is also finding a better balance, supporting our view that the bank will remain on pause. According to the Survey of Employment Payrolls and Hours (SEPH) for the month of July, labour demand continued to ease. Job vacancy rates declined markedly, reaching a low not seen since May 2021. Weakness was broad-based, but sectors bearing the brunt of this decline included retail trade and accommodation services, which suggests that cooling is migrating to the biggest recent contributors to labour demand. Since May 2022 (when job vacancies reached their peak) the number of unfilled positions fell by more than 30%, with vacancies in accommodation and food services and trade contributing more than a third of this decline (Chart 2).
The one area that doesn’t tick the box in the Bank of Canada’s checklist for a pause is average weekly earnings, which picked up the pace in July just as average weekly hours declined. Juxtaposed with the decline in job vacancies, it makes one wonder if this wage increase is sustainable or just a temporary blip. The sentiment from the CFIB small Business Barometer suggests that there might be more staying power, as average wage increase plans for the next 12 months registered a small uptick in September. With that, small business optimism tumbled to its lowest since the pandemic began, signaling apprehension about future economic conditions among business owners. We’ll get more timely data on wage growth next Friday with September’s Labour Force Survey.
All said, while the path ahead for the economy remains nuanced, this week’s data provides a solid case for the Bank of Canada to stay on the sidelines.


