
GBP/USD started a fresh increase above the 1.3520 zone. USD/CAD declined and now is consolidating below the 1.3800 level.
Important Takeaways for GBP/USD and USD/CAD Analysis Today
- The British Pound is eyeing more gains above the 1.3600 resistance.
- There is a key bullish trend line forming with support at 1.3540 on the hourly chart of GBP/USD at FXOpen.
- USD/CAD started a fresh decline after it failed to clear the 1.4000 resistance.
- There is a connecting bearish trend line with resistance at 1.3740 on the hourly chart at FXOpen.
GBP/USD Technical Analysis
On the hourly chart of GBP/USD at FXOpen, the pair formed a base above the 1.3350 level. The British Pound started a steady increase above the 1.3450 resistance zone against the US Dollar, as discussed in the previous analysis.
The pair gained strength above the 1.3500 level. The bulls even pushed the pair above the 1.3550 level and the 50-hour simple moving average. The pair tested the 1.3585 zone and is currently consolidating gains.
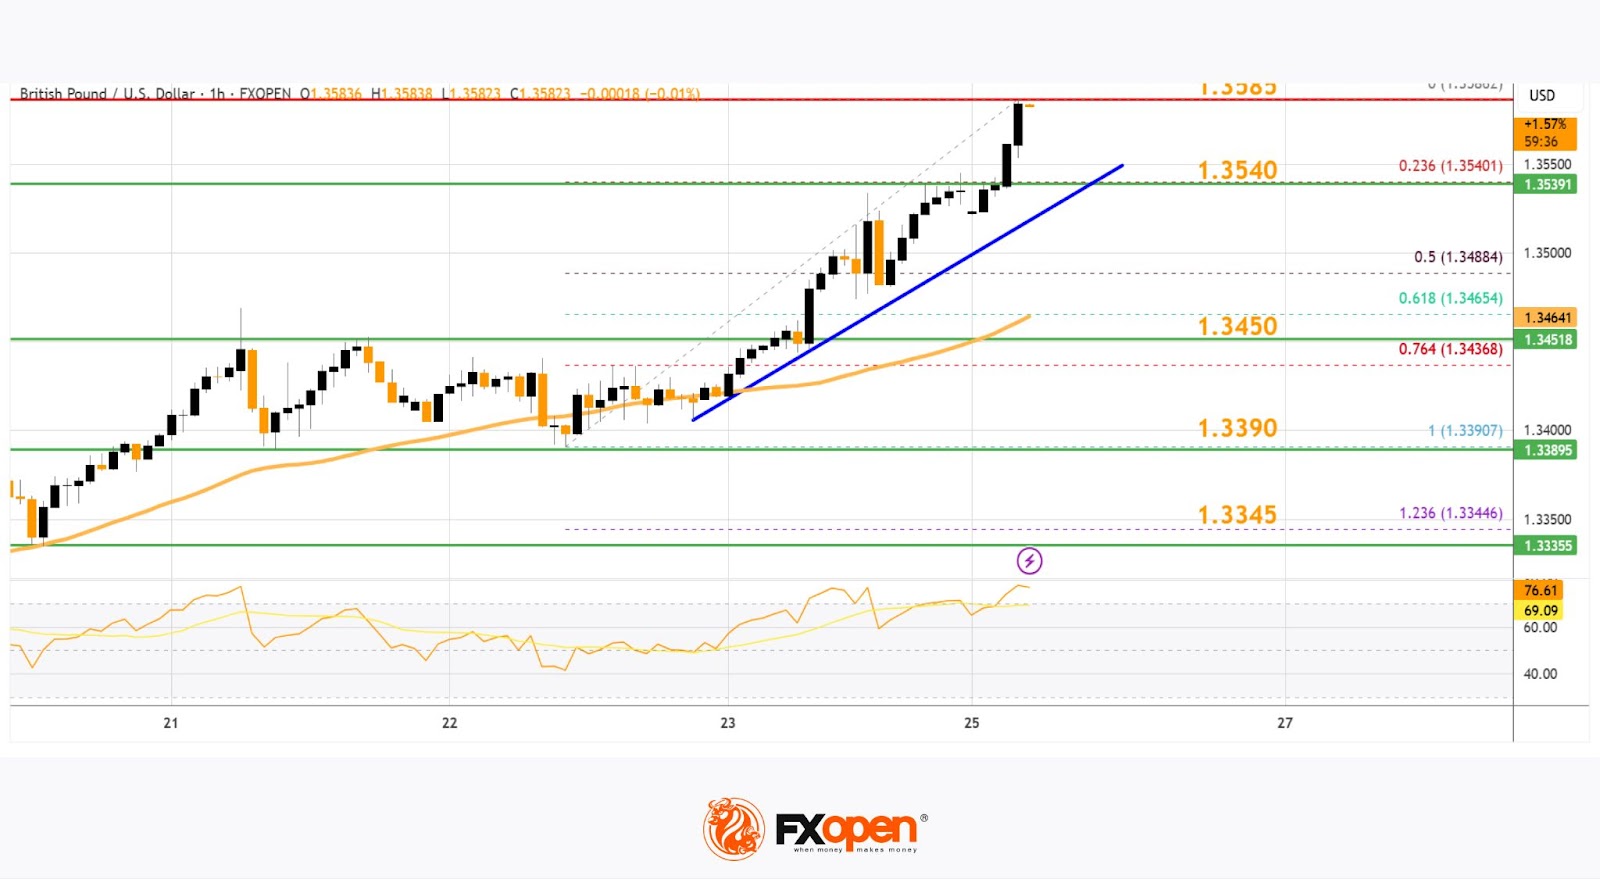
GBP/USD is stable above the 23.6% Fib retracement level of the upward move from the 1.3390 swing low to the 1.3586 high. There is also a key bullish trend line forming with support at 1.3540.
It seems like the bulls might aim for more gains. The RSI moved above the 60 level on the GBP/USD chart and the pair is now approaching a major hurdle at 1.3600.
An upside break above the 1.3600 zone could send the pair toward 1.3650. Any more gains might open the doors for a test of 1.3720. If there is a downside correction, immediate support is near the 1.3540 level and the trend line.
The first major support sits near the 50% Fib retracement level of the upward move from the 1.3390 swing low to the 1.3586 high at 1.3485. The next major support is 1.3450. If there is a break below 1.3450, the pair could extend the decline. The next key support is near the 1.3390 level. Any more losses might call for a test of the 1.3345 support.
USD/CAD Technical Analysis
On the hourly chart of USD/CAD at FXOpen, the pair climbed toward the 1.3900 resistance zone before the bears appeared. The US Dollar formed a swing high near 1.3890 and recently declined below the 1.3800 support against the Canadian Dollar.
There was also a close below the 50-hour simple moving average and 1.3750. The bulls are now active near the 1.3700 level, but they might fail to protect more losses. If there is an upside correction, the pair could face resistance near the 1.3740 level.
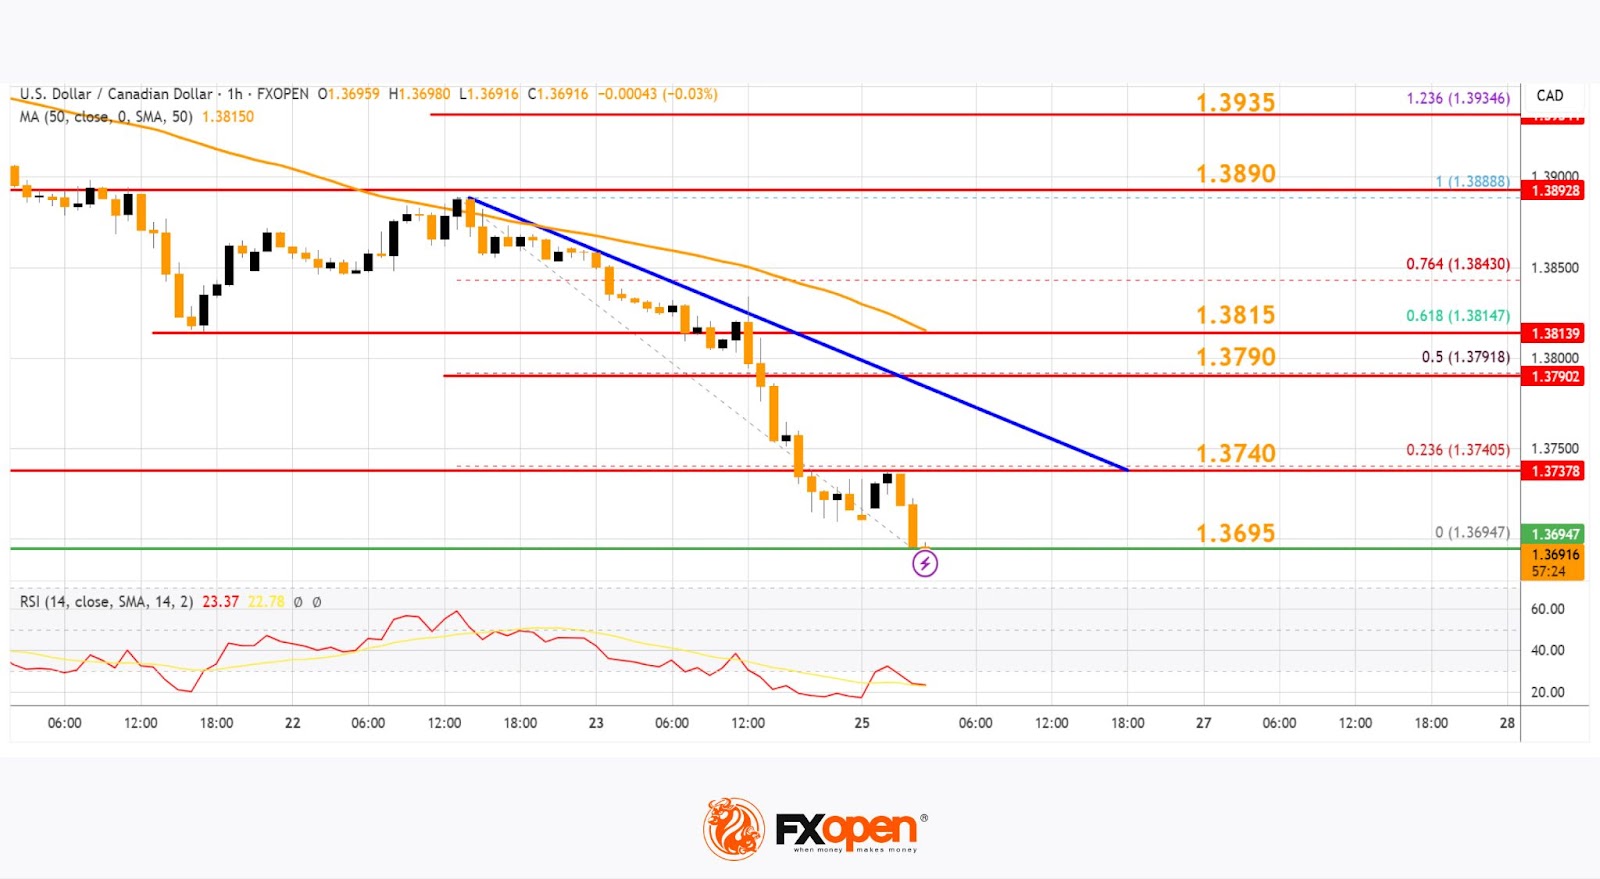
There is also a connecting bearish trend line with resistance at 1.3740. The trend line is near the 23.6% Fib retracement level of the downward move from the 1.3888 swing high to the 1.3694 low.
If there is a fresh increase, the pair could face resistance near the 1.3790 level. It is close to the 50% Fib retracement level of the downward move from the 1.3888 swing high to the 1.3694 low. The next key resistance on the USD/CAD chart is near the 1.3815 level.
If there is an upside break above 1.3815, the pair could rise toward the 1.3890 resistance. The next major resistance is near the 1.3935 level, above which it could rise steadily toward the 1.4000 resistance zone.
Immediate support is near the 1.3695 level. The first major support is near 1.3660. A close below the 1.3660 level might trigger a strong decline. In the stated case, USD/CAD might test 1.3600. Any more losses may possibly open the doors for a drop toward the 1.3550 support.
Trade over 50 forex markets 24 hours a day with FXOpen. Take advantage of low commissions, deep liquidity, and spreads from 0.0 pips. Open your FXOpen account now or learn more about trading forex with FXOpen.
This article represents the opinion of the Companies operating under the FXOpen brand only. It is not to be construed as an offer, solicitation, or recommendation with respect to products and services provided by the Companies operating under the FXOpen brand, nor is it to be considered financial advice.


