
Key takeaways
Global equities stayed resilient in 2025, absorbing tariff-driven trade shocks and US-China tensions, with the iShares MSCI All World Index on pace for a strong third consecutive double-digit annual gain.
Asia and several emerging markets led performance, with South Korea, Brazil, and Hong Kong topping year-to-date returns, while the US outperformed only when measured from the April 2025 post-selloff reversal.
Rotations and valuation resets shaped regional winners, as capital shifted out of expensive US mega-cap tech into cheaper opportunities across Europe and Asia, with Hong Kong and Japan boosted by supportive liquidity and policy tailwinds.
Macro signals now favour a more dovish Fed in 2026, supported by falling inflationary expectations and weaker oil prices, conditions that lower the risk of reigniting inflation and widen the runway for rate cuts.
China’s deflation risks are easing, as core CPI stabilises, an improving backdrop that could extend Hong Kong’s multi-month uptrend, particularly if the Hang Seng Index breaks above the long-capped 27,500 resistance.
Technical setups point to potential leadership changes, with the Dow Jones Industrial Average positioned for catch-up gains amid a steeper yield curve and strengthening value factors, while Japan’s Nikkei 225 and Hong Kong’s Hang Seng Index remain in major bullish structures.
Global stock markets have extended their bullish momentum from 2024 into 2025, navigating a year marked by significant macro and geopolitical shocks. Chief among them was the US administration’s imposition of reciprocal tariffs on all major trading partners, effectively igniting a new phase of the global trade war.
Tensions between the US and China also escalated, with tit-for-tat tariffs and sanctions targeting strategically critical sectors. These included advanced semiconductor chips used for cutting-edge AI models, as well as rare earths essential for magnets in the automotive, electronics, defence, and renewable energy industries.
Despite these headwinds, global equities have remained resilient. As of 25 December 2025, the iShares MSCI All Country World Index ETF is on track to finish the year up 21%, marking a potential third consecutive annual gain above 15%, following returns of 17.5% in 2024 and 22.3% in 2023.
Against this backdrop, we now turn to a review of the 2025 performances of key global benchmark stock indices and the main drivers behind their moves.
The global snapshot of diverging positive trajectories
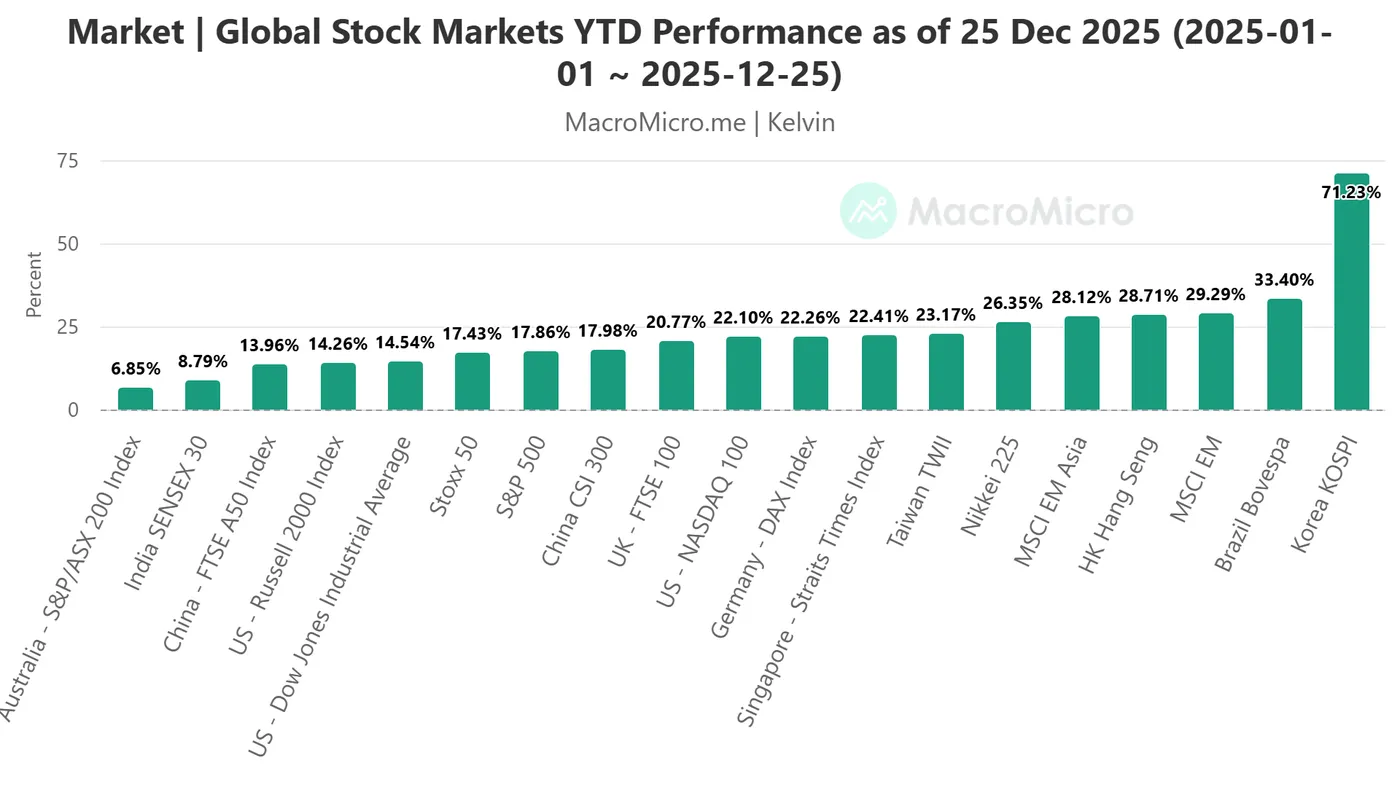
Fig. 1: Year-to-date performance of global benchmark stock indices as of 25 Dec 2025 (Source: MacroMicro)
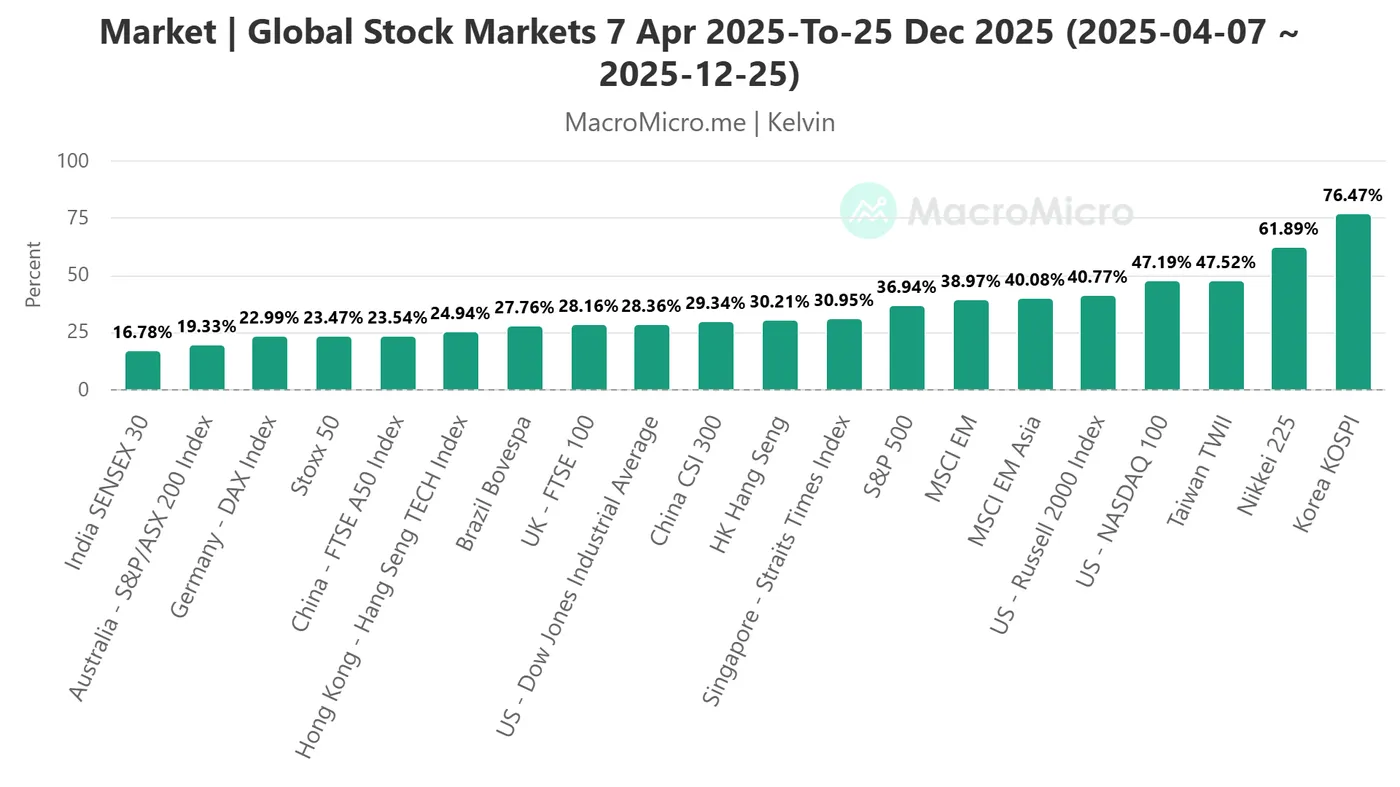
Fig. 2: Global benchmark stock indices performance from 7 April 2025 to 25 Dec 2025 (Source: MacroMicro)
Global benchmark stock indices are posting gains across two key reference periods: year to date as of 25 December 2025, and from the “US Liberation Day” market reversal on 7 April 2025 to 25 December 2025. The latter followed a sharp global equity drawdown of roughly 18% from the 18 February 2025 peak to the 7 April 2025 trough, triggered by the US administration’s announcement of sweeping reciprocal tariffs on 2 April 2025.
On a year-to-date basis, Asia-Pacific and emerging markets dominate performance. South Korea’s KOSPI leads with a surge of 71.2%, followed by Brazil’s Bovespa (+33.4%) and Hong Kong’s Hang Seng Index (+28.7%). These gains comfortably outpaced US benchmarks, including the Nasdaq 100 (+22.1%), S&P 500 (+17.9%), Dow Jones (+14.5%), and Russell 2000 (+14.3%) (see Fig. 1).
Looking at performance from 7 April to 25 December 2025, South Korea’s KOSPI (+76.5%) and Japan’s Nikkei 225 (+61.9%) remain leaders, while the Nasdaq 100 (+47.2%) ranks among the top four global outperformers (see Fig. 2).
In short, 2025 has been a strong year for global equities, but leadership has been uneven. Asia and parts of Europe have outperformed, while US markets have rallied with narrower leadership concentrated in AI-driven, high-productivity themes.
What drove the gains
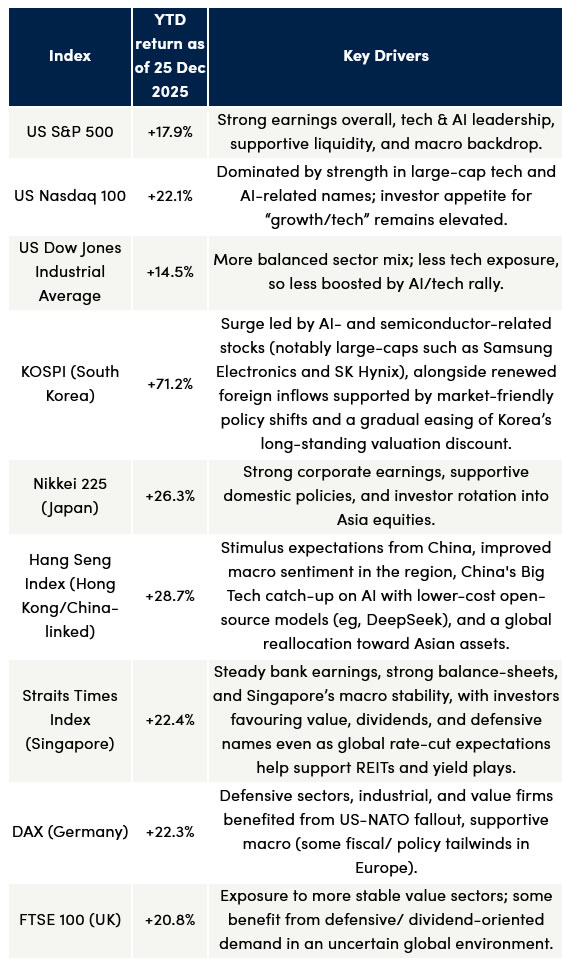
Regional rotation and valuation appeal outside the US: Early in 2025, investors rotated out of stretched US large-cap technology stocks into cheaper value opportunities elsewhere. Europe benefited from more attractive valuations and renewed confidence in fiscal expansion and defence spending.
Macro and liquidity tailwinds in Asia: Improved liquidity conditions, supportive policy settings, and signs of regional economic recovery underpinned strong equity performance in markets such as Hong Kong and Japan.
Below is a summary of the key performance drivers across the major global benchmark stock indices.defensive/ dividend-oriented demand in an uncertain global environment.
Next, we break down the key macro forces that are likely to shape global equity performance in 2026.
Macro signals point to a potential dovish Fed in 2026
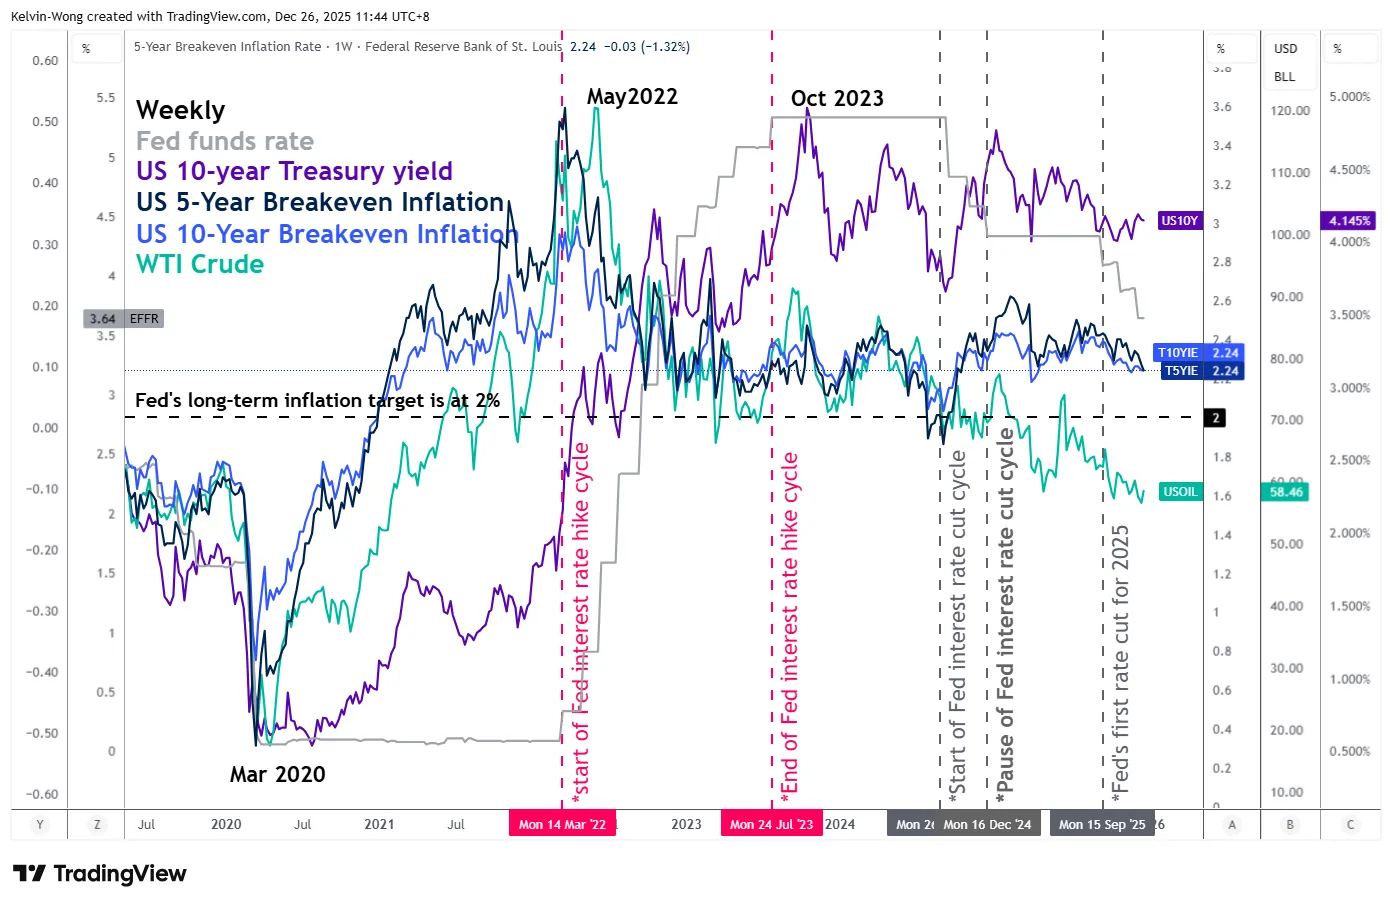
Fig. 3: US 5-YR & 10-YR breakeven rates with WTI crude oil as of 26 Dec 2025 (Source: TradingView)
The US Federal Reserve resumed its rate-cutting cycle in September 2025 after a nine-month pause, delivering three 25-basis-point cuts that brought the federal funds rate to 3.50%–3.75% as of 2 December 2025. According to the CME FedWatch Tool at the time of writing, futures markets expect the easing cycle to extend into 2026, with at least two additional 25-bp cuts priced in, lowering the policy rate to around 3.00%–3.25%.
The macro backdrop heading into 2026 is increasingly consistent with a more accommodative Fed. Both the 5-year and 10-year US breakeven inflation rates—key measures of long-term inflation expectations—have eased to around 2.24%, down from peaks of 2.62% and 2.42% in February 2025. This contrasts sharply with the inflation surge that culminated in mid-2022 and underscores that inflation expectations are now well anchored (see Fig. 3).
At the same time, the US 10-year Treasury yield has rolled over from its October 2023 highs and continued to trend lower through 2024 and 2025, signalling softer growth momentum that no longer justifies a restrictive policy stance. Crude oil prices have also weakened steadily, trading closer to the mid-US$50s. Historically, sustained declines in energy prices tend to dampen headline inflation and ease cost-push pressures.
Taken together, these conditions reduce the risk of a policy-driven inflation resurgence and strengthen the case for further easing. The Fed appears to have both the justification and the flexibility to pursue a more assertive easing path in 2026 to support growth without undermining price stability. A dovish Fed heading into 2026 is therefore likely to remain a key tailwind for the ongoing major bullish trend in global equity markets.
We now turn to the technical outlook for three major global stock indices that are likely poised to outperform in 2026.
Laggard Dow Jones Industrial Average shows potential outperformance over AI-driven Nasdaq 100
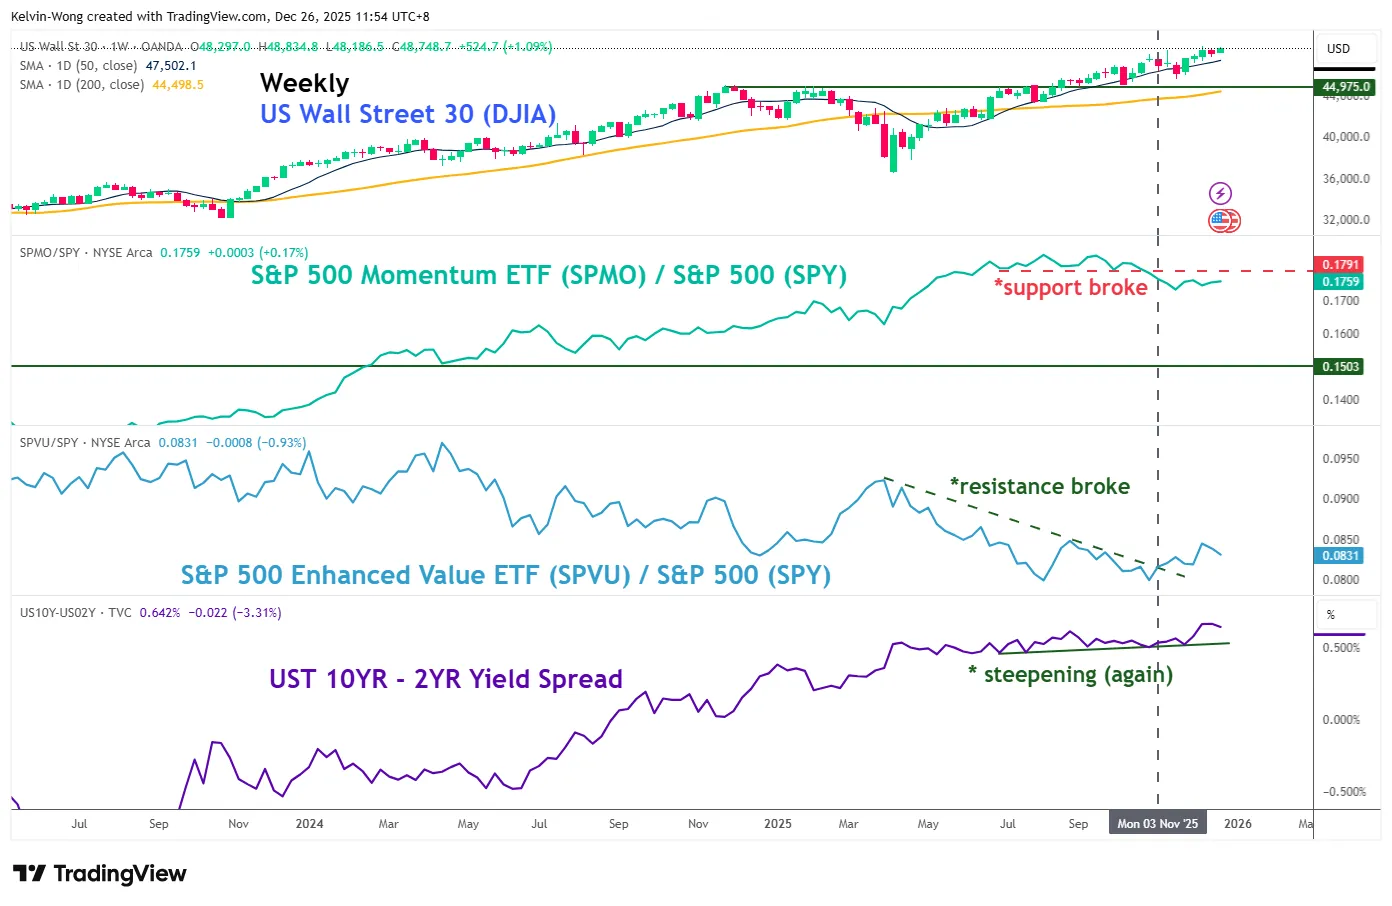
Fig. 4: US Wall Street 30 CFD Index, momentum, value factors, US Treasury yield curve as of 26 Dec 2025 (Source: TradingView)
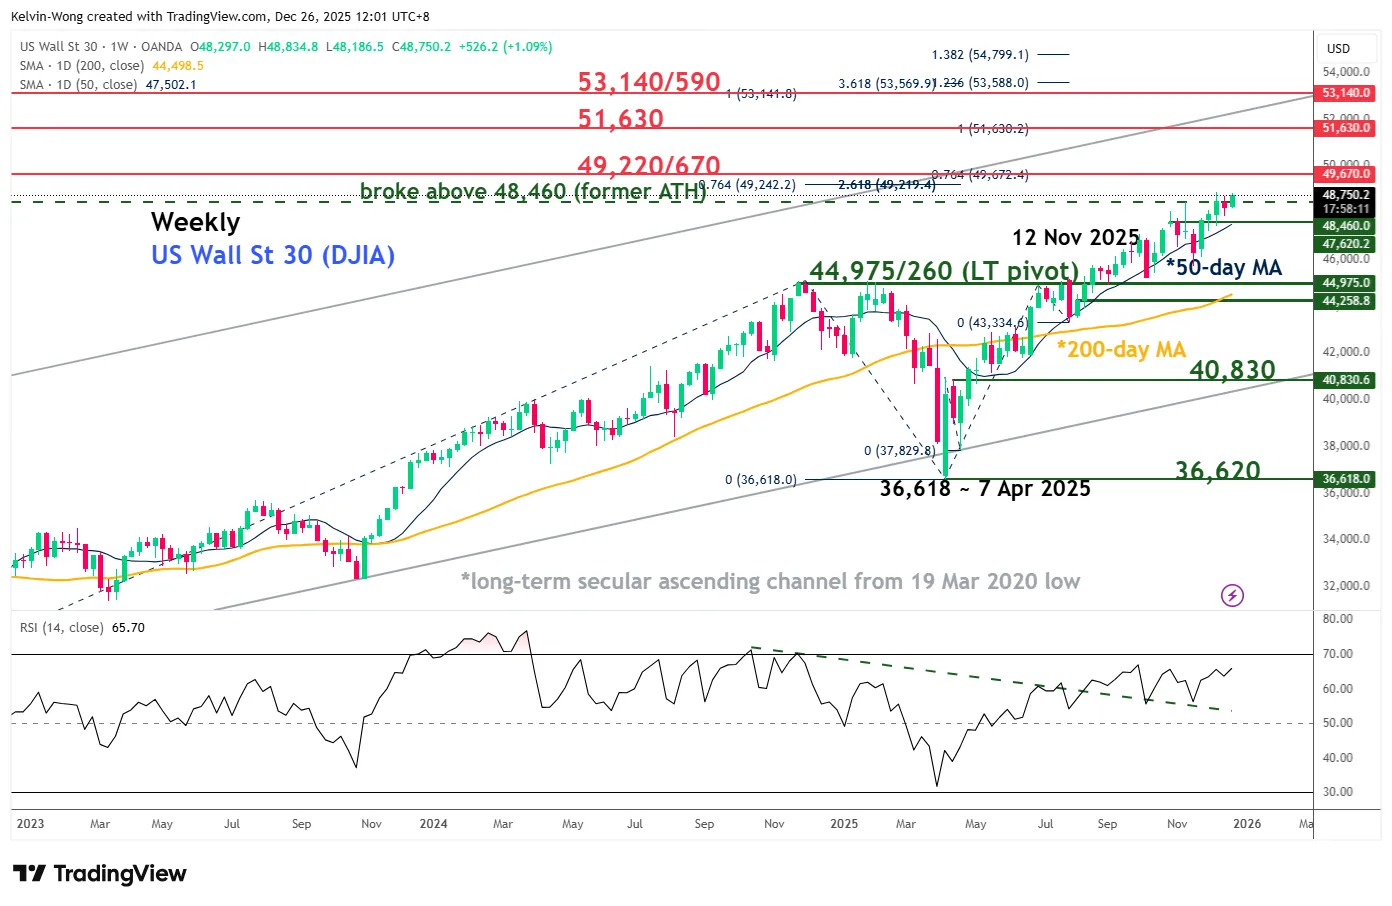
Fig. 5: US Wall Street 30 CFD Index major trend as of 26 Dec 2025 (Source: TradingView)
Financials account for the largest sector weight in the Dow Jones Industrial Average, at roughly 27%, which helps explain its relative underperformance versus the Nasdaq 100 in 2025. The Nasdaq 100, with around 64% exposure to the Technology sector, has been the primary beneficiary of the AI-driven productivity narrative.
Looking ahead, a continuation of the Fed’s rate-cut cycle into 2026 could set the stage for a rotation within US equities. Lower interest rates tend to favour non-technology stocks with more attractive valuations and resilient earnings growth, raising the likelihood of a catch-up rally as the AI-centric advance broadens beyond mega-cap technology.
Rates and factor signals are already hinting at this shift. The US Treasury yield curve (10-year minus 2-year) has re-steepened from 0.48% on 29 October 2025 to 0.53% on 7 November 2025, coinciding with a bullish breakout in the ratio of the S&P 500 Enhanced Value ETF (with a 35% weighting in Financials) relative to the S&P 500 ETF (see Fig. 4). In contrast, the ratio of the S&P 500 Momentum ETF (36% weighted toward Information Technology) versus the S&P 500 ETF broke down on 3 November 2025, signalling waning relative leadership from momentum-heavy tech.
Taken together, a re-steepening yield curve and the emerging outperformance of the value factor point to improving relative prospects for the Dow Jones Industrial Average in 2026. To preserve its major uptrend, the US Wall Street 30 CFD Index (a proxy for Dow futures) needs to hold above the 44,975/44,260 long-term pivotal support zone (see Fig. 5) for a fresh bullish impulsive move, opening up scope for the next major resistances to come in at 49,220/49,670, 51,630, and 53,140/53,590.
Conversely, a failure to defend the 44,260 key support level would threaten the broader uptrend and raise the risk of a deeper corrective decline toward the next major supports at 40,830 and potentially 36,620.
Next, we turn to what may lie ahead for the Hong Kong and Japanese stock markets in 2026.
Japan’s economy strengthens with robust positive earnings revisions
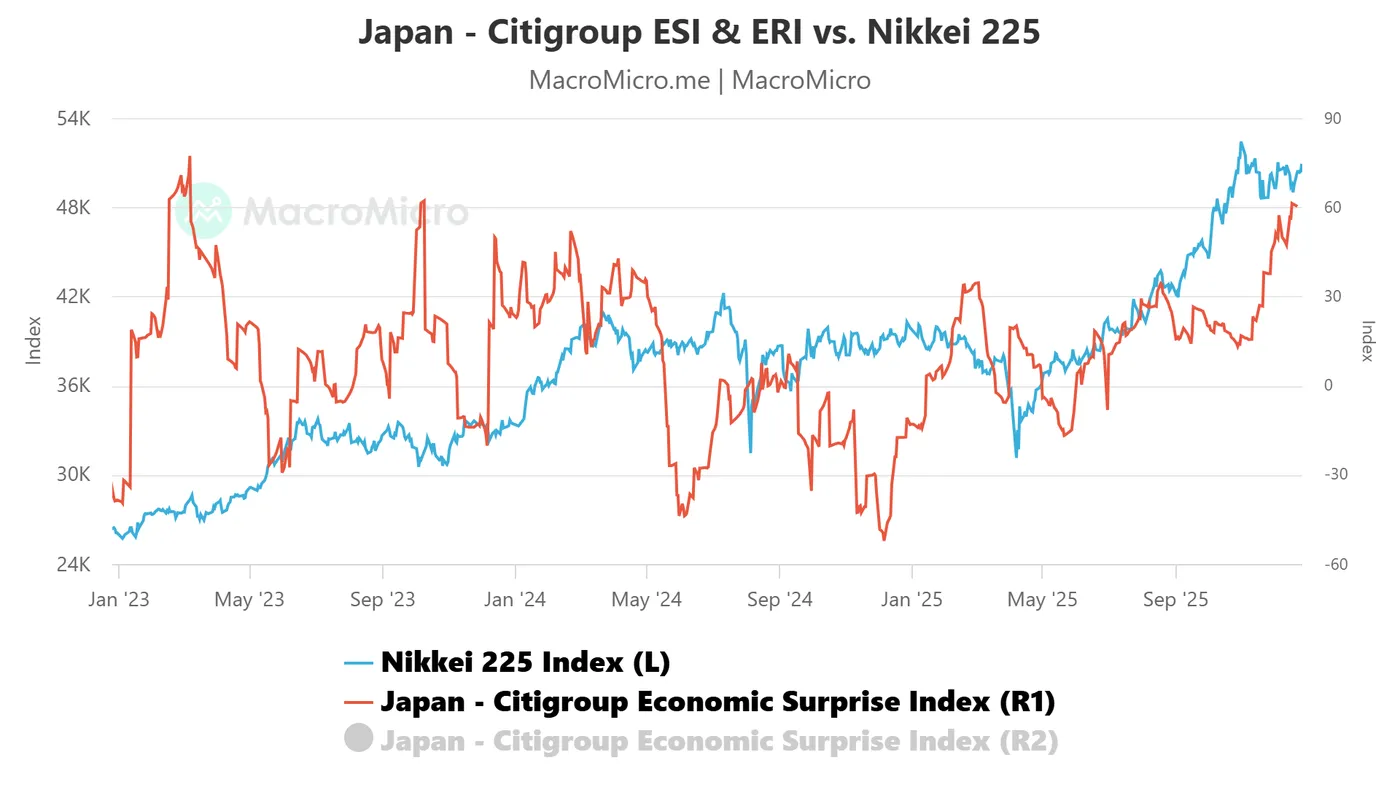
Fig. 6: Japan Citigroup Economic Surprise Index as of 22 Dec 2025 (Source: MacroMicro)
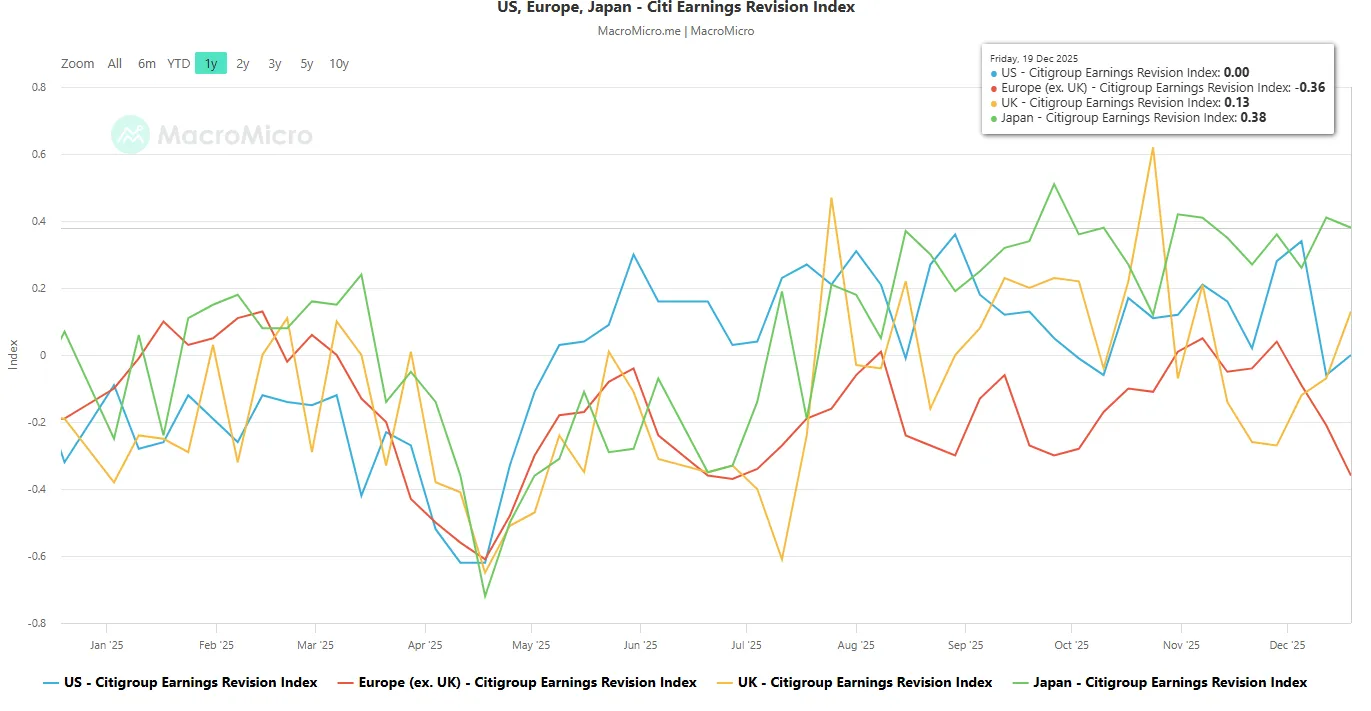
Fig. 7: Japan Citigroup Earnings Revision Index as of 19 Dec 2025 (Source: MacroMicro)
Japan’s economic momentum has strengthened steadily since the start of the year. As of 22 December 2025, the Citigroup Economic Surprise Index (ESI) for Japan has surged to 60.30, its highest level since 9 October 2023, rebounding sharply from a trough of -52.2 on 6 December 2024 (see Fig. 6). The ESI gauges how incoming economic data compares with market expectations, with readings above zero indicating consistent upside surprises.
In parallel, analyst sentiment toward Japanese corporates has turned increasingly positive. Citigroup’s Earnings Revision Index (ERI) for Japan, which measures the balance of upward versus downward EPS forecast revisions, stands at 0.38 as of 19 December 2025, higher than 0.26 recorded on 5 December 2025, according to MacroMicro. Japan now leads major regions on this metric, ahead of the US (0.0), Europe (-0.36), and the UK (0.13), underscoring Japan as the market with the strongest earnings optimism at present (see Fig. 7).
Long-term secular Nikkei 225 bulls are still in control
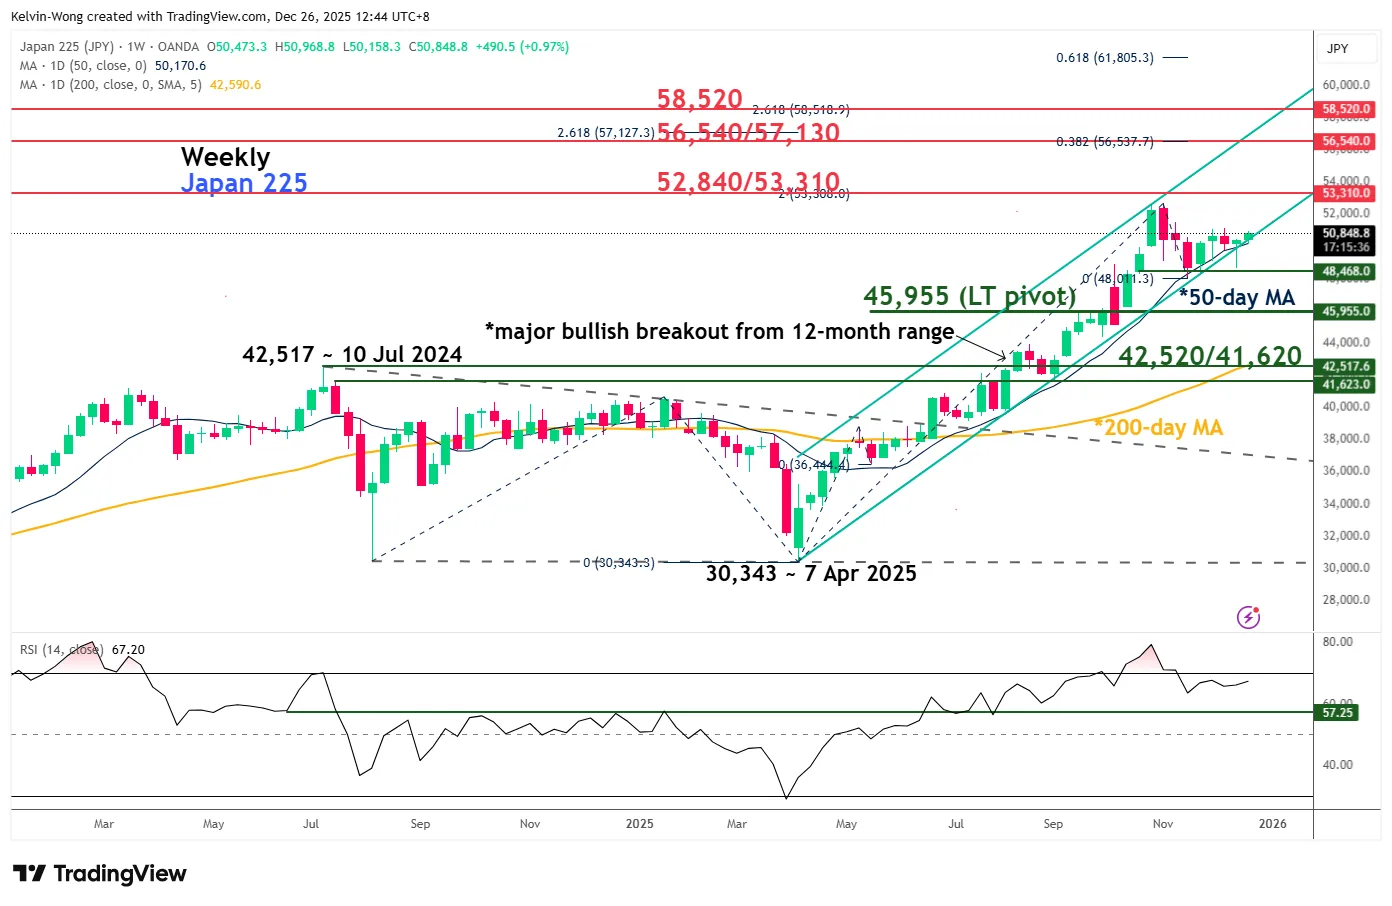
Fig. 8: Japan 225 CFD Index major trend as of 26 Dec 2025 (Source: TradingView)
Price action in the Japan 225 CFD Index (a proxy for Nikkei 225 futures) has remained firmly within a major bullish trend since its decisive breakout from a 12-month consolidation in early August 2025 (see Fig. 8).
The index went on to register a fresh all-time high of 52,664 on 4 November 2025, before undergoing an 8.8% multi-week medium-term correction that bottomed at 48,011 on 21 November 2025.
Notably, the pullback found support at the rising 50-day moving average and the lower boundary of the ascending channel originating from the 7 April 2025 low of 30,343, signalling that the broader uptrend remains intact.
Watch the 45,955 key long-term pivotal support; as long as it holds, the major bullish impulsive up move sequence remains intact, and a break above 52,840/53,310 sees the next major resistances coming in at 56,540/57,130, and 58,520.
Conversely, a decisive weekly close below 45,955 would invalidate the bullish bias and raise the risk of a deeper corrective decline toward the next major support zone at 42,520/41,620, also near the 200-day moving average.
Deflationary risk has subsided in China
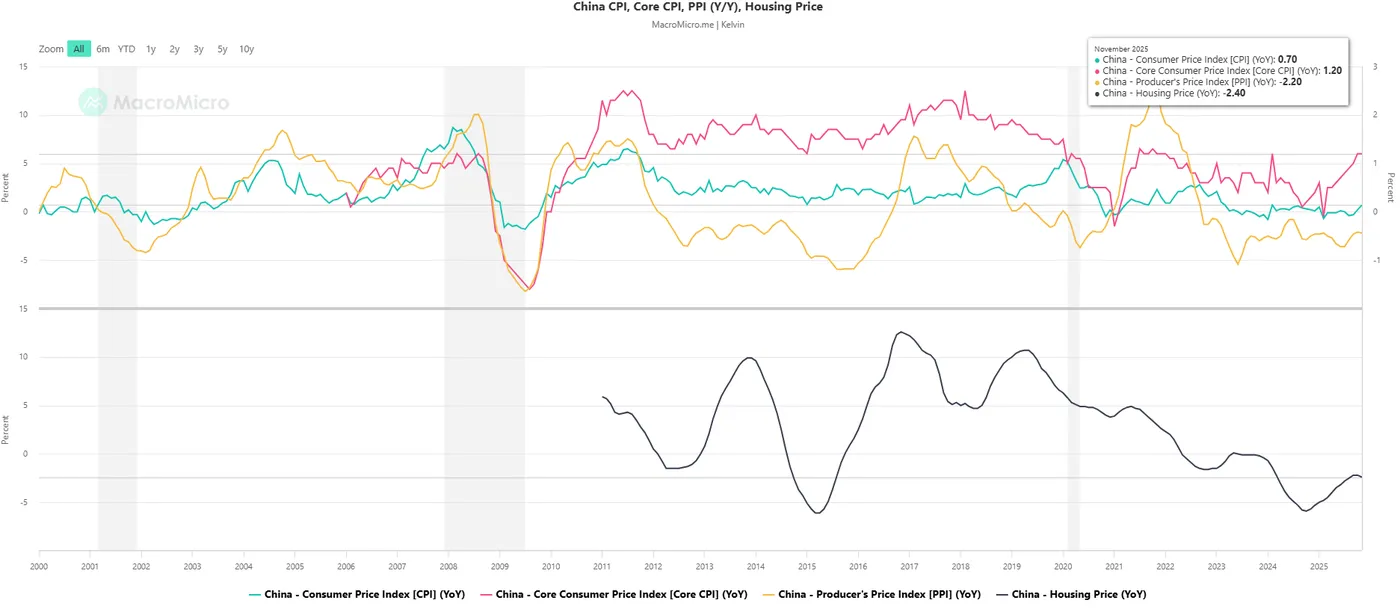
Fig. 9: China inflation and housing price trends as of Nov 2025 (Source: MacroMicro)
China grappled with the risk of a deflationary spiral from 2020 to 2024, driven by the pandemic’s aftershocks, the bursting of the property bubble, and a period of less business-friendly policy toward the private sector, most notably the e-commerce industry. These deflation fears fed a negative feedback loop in both China and Hong Kong stock markets, leading to pronounced underperformance versus global peers over the past four years.
More recently, however, targeted accommodative measures from Beijing appear to be gaining traction. China’s three-year decline in consumer prices excluding food and energy has reversed, with core CPI rising 1.2% y/y in November 2025, its fastest pace since February 2024, after steadily recovering from a trough of -0.1% in February 2025 (see Fig. 9).
The heart of China’s deflation risk remains the property sector, given the powerful wealth effect where real estate accounts for roughly 70% of household retirement assets. A sustained turnaround in property prices would likely lift consumer confidence, revive domestic demand, and reinforce the nascent recovery in core inflation. Against this backdrop, an improving macro environment in China increases the likelihood that the major bullish trend in Hong Kong equities, which began in January 2024, can be sustained.
Watch the 27,500 key resistance on the Hang Seng Index
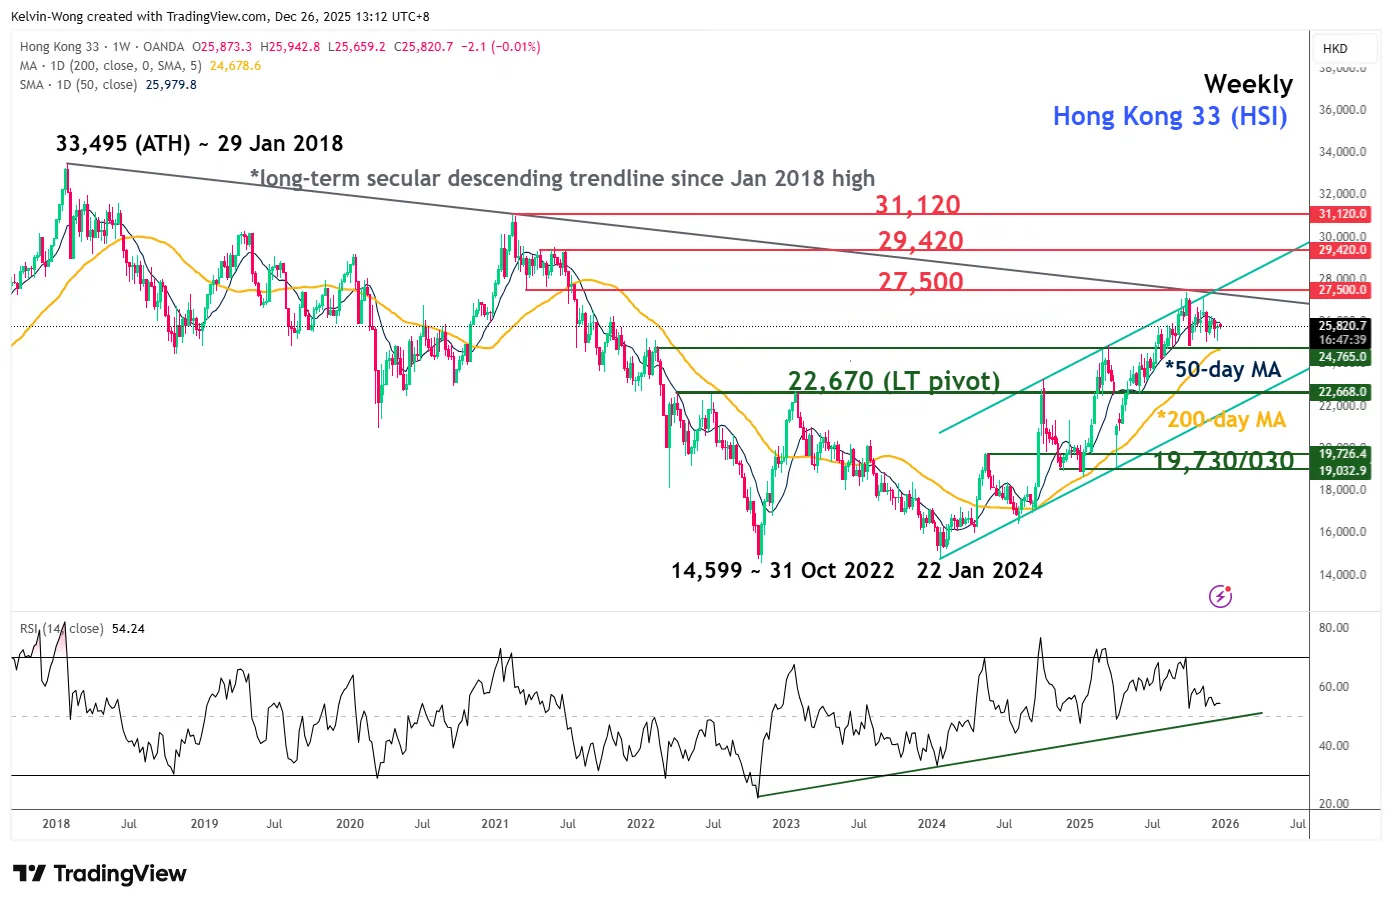
Fig. 10: Hong Kong 33 CFD Index major trend as of 24 Dec 2025 (Source: TradingView)
The Hong Kong 33 CFD Index (a proxy for Hang Seng Index futures), has extended its multi-month rally to a year-to-date high of 27,401 on 29 September 2025, just shy of its major resistance at 27,500, a long-term descending trendline that has capped previous bullish advances since the all-time high of 33,495 on 29 January 2018 (see Fig. 10).
A weekly close above 27,500 would signal a potential major bullish breakout, with the next key resistance levels at 29,420 and 31,120. On the flipside, failure to hold the pivotal long-term support at 22,670 could trigger a deeper corrective decline, potentially targeting the next support zone between 19,700 and 19,030.