
Key takeaways
2025 FX markets were defined by a tug of war between “US exceptionalism” and “US debasement”, with fiscal fears and erratic trade policy driving early dollar weakness, while Fed–global policy divergence intermittently revived USD strength.
The US dollar fell sharply in H1 2025 (-11.5%), rebounded briefly on renewed US exceptionalism, then settled into consolidation, ending the year down ~10% as the Fed shifted to a more balanced, mildly dovish stance.
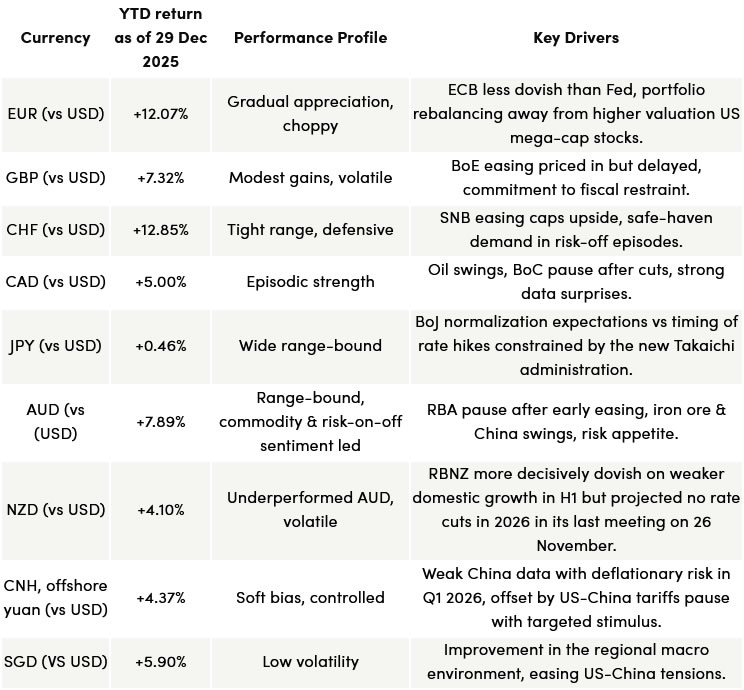
Non-US currencies broadly outperformed the USD, led by EUR, CHF and AUD, supported by portfolio rebalancing, selective central bank restraint, commodity dynamics, and easing US-China tensions.
Improving global growth expectations threaten USD support in 2026, as rising economic surprises and potential pauses in non-US rate cuts could compress the US Treasury yield premium.
US liquidity is turning into a structural headwind for the US dollar, with the Fed ending QT and restarting Treasury bill buybacks, lifting net liquidity and historically increasing downside pressure on the USD.
Technically, EUR/USD and AUD/USD show bullish continuation signals, while USD/JPY appears vulnerable to a bearish reversal unless it breaks decisively above long-term resistance.
2025 recap – A tug of war between “US exceptionalism” and “US debasement”
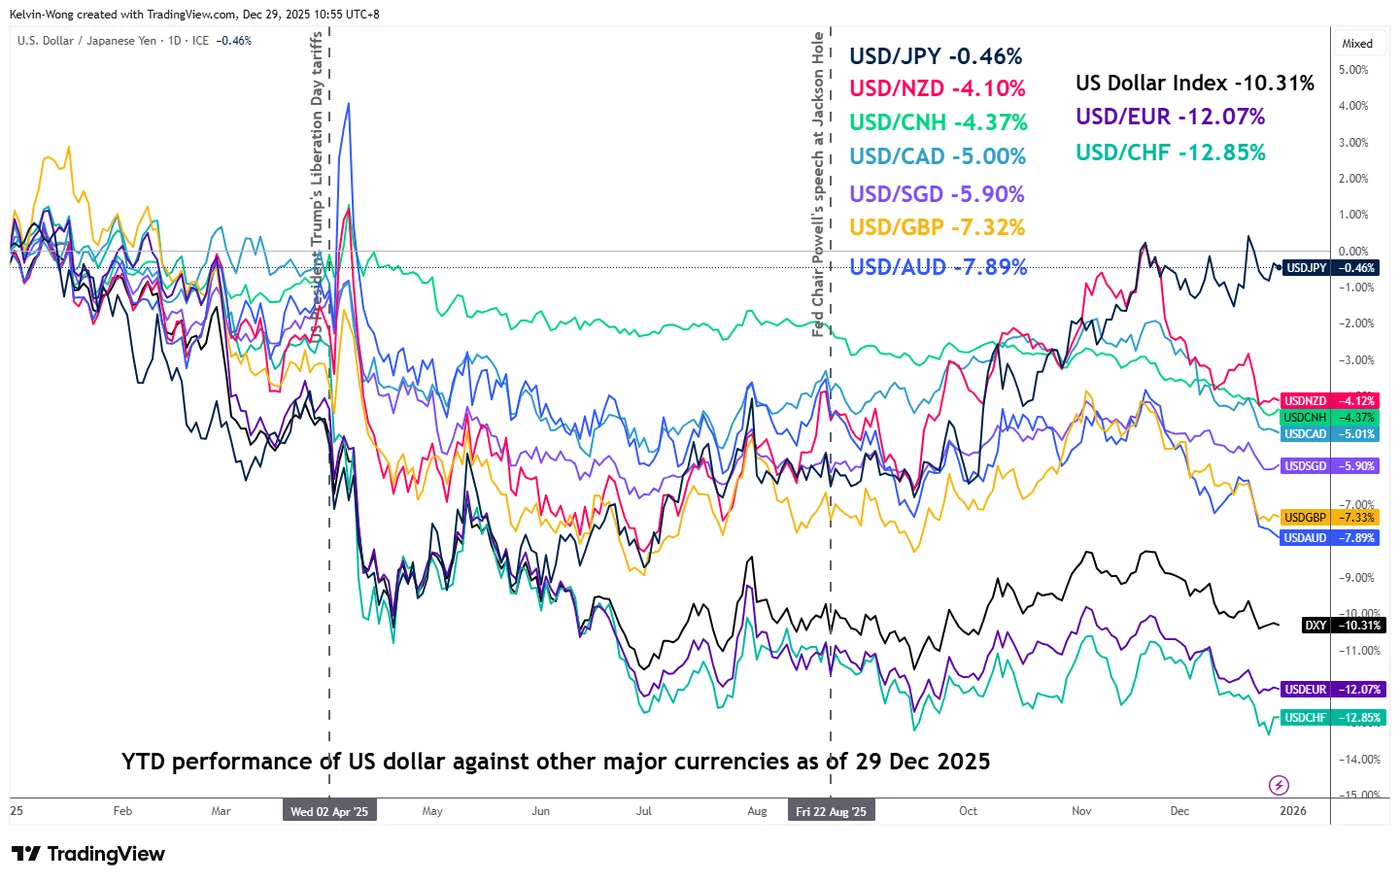
Fig. 1: Year-to-date performance of the US dollar against major currencies as of 29 Dec 2025 (Source: TradingView)
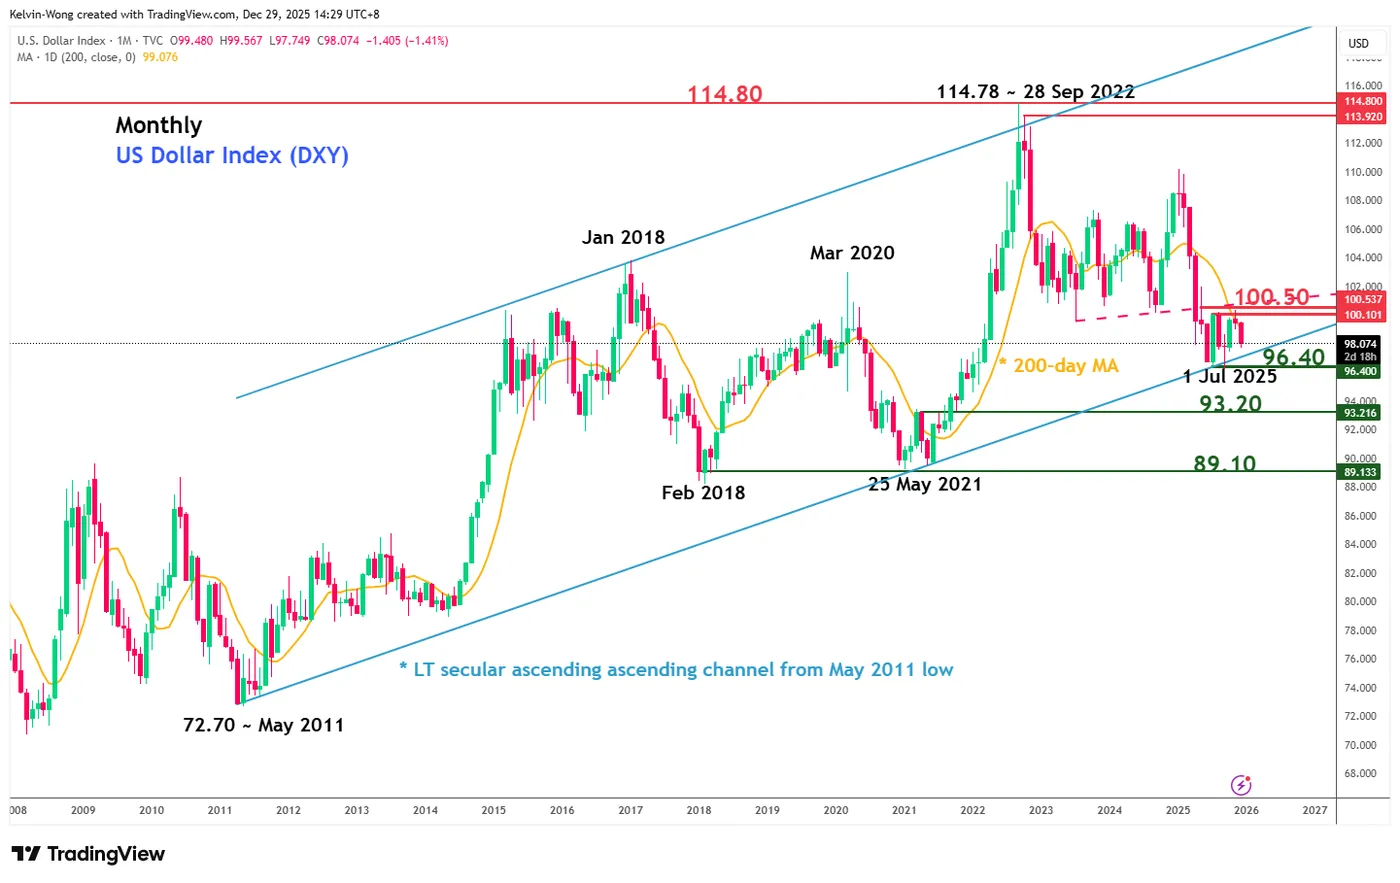
Fig. 2: US Dollar Index long-term secular trend as of 29 Dec 2025 (Source: TradingView)
The defining narrative in the foreign exchange market for 2025 is a tug of war between “US exceptionalism – US dollar strong” and “US debasement – US dollar weak”.
At the start of 2025, market consensus leaned heavily toward a bearish outlook for the US dollar, anchored on the new Trump administration’s aggressive fiscal agenda. Deep corporate tax cuts were expected to further widen the US budget deficit, raising concerns over heavier Treasury issuance, weaker demand for US sovereign debt, and upward pressure on long-term yields—dynamics that underpinned the “US Debasement” trade narrative.
This view was reinforced by erratic US trade policy execution, which unsettled global markets. The announcement of sweeping “Liberation Day” tariffs on 2 April 2025 amplified fears that the administration might tolerate—or even encourage—a weaker dollar to enhance US export competitiveness as part of its ambition to reindustrialize the economy around high-tech manufacturing.
Against this backdrop, the US Dollar Index slid sharply by 11.5% in the first half of 2025 (1 January to 1 July) (see Fig. 1). The sell-off then stalled as the “US exceptionalism” narrative resurfaced, driven by widening monetary policy divergences between the Federal Reserve and other major developed-market central banks.
Into the third quarter, the Fed adopted a “wait-and-see” stance amid sticky inflation and a still-resilient US services sector. In contrast, the ECB and BoE struck a more dovish tone as the euro area wrestled with waning confidence tied to Germany’s industrial slowdown, while the UK faced stagflationary pressures. At the same time, commodity-linked currencies suffered a sharp terms-of-trade shock from renewed US-China geopolitical tensions, weighing on the CAD, AUD, and NZD.
The Japanese yen also remained under pressure despite inflation running above 2%, constrained by the Bank of Japan’s limited ability to normalise policy decisively amid political and administrative gridlock. With “US exceptionalism” back in focus, the US Dollar Index retraced part of its losses, narrowing its year-to-date decline from 11.5% to 8.4% between 1 July and 31 July (see Fig. 2).
That rebound proved short-lived. On 22 August 2025, the Fed’s guidance pivoted decisively dovish when Chair Powell, speaking at the Jackson Hole Symposium, warned that a weakening US labour market posed risks to growth. The dollar subsequently resumed its decline but failed to break the 1 July 2025 low, entering a sideways consolidation.
As of 29 December 2025, the US Dollar Index was down 10.3% year-to-date, reflecting the Fed’s more balanced policy stance even as it resumed easing in September with three 25 bps rate cuts, lowering the fed funds rate to 3.5%–3.75% from 4.25%–4.5%.
Below is a summary table highlighting the 2025 performance of key currencies and their main drivers.
Next, we examine the key macro forces likely to shape the US dollar’s trajectory in 2026, followed by three currency pairs to watch from a technical analysis perspective.
Improved global growth prospects may reduce the US Treasury yield premium
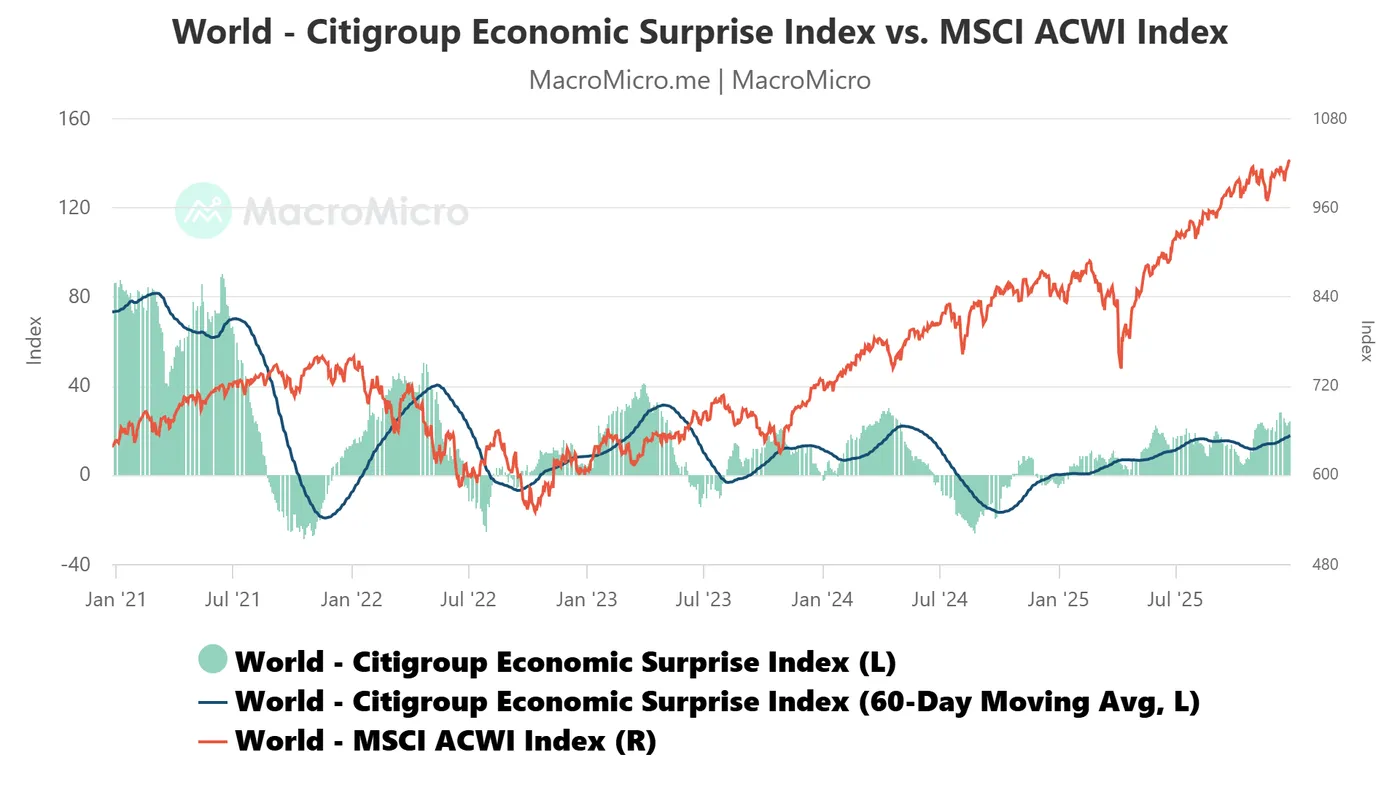
Fig. 3: World Citigroup Economic Surprise Index as of 26 Dec 2025 (Source: MacroMicro)
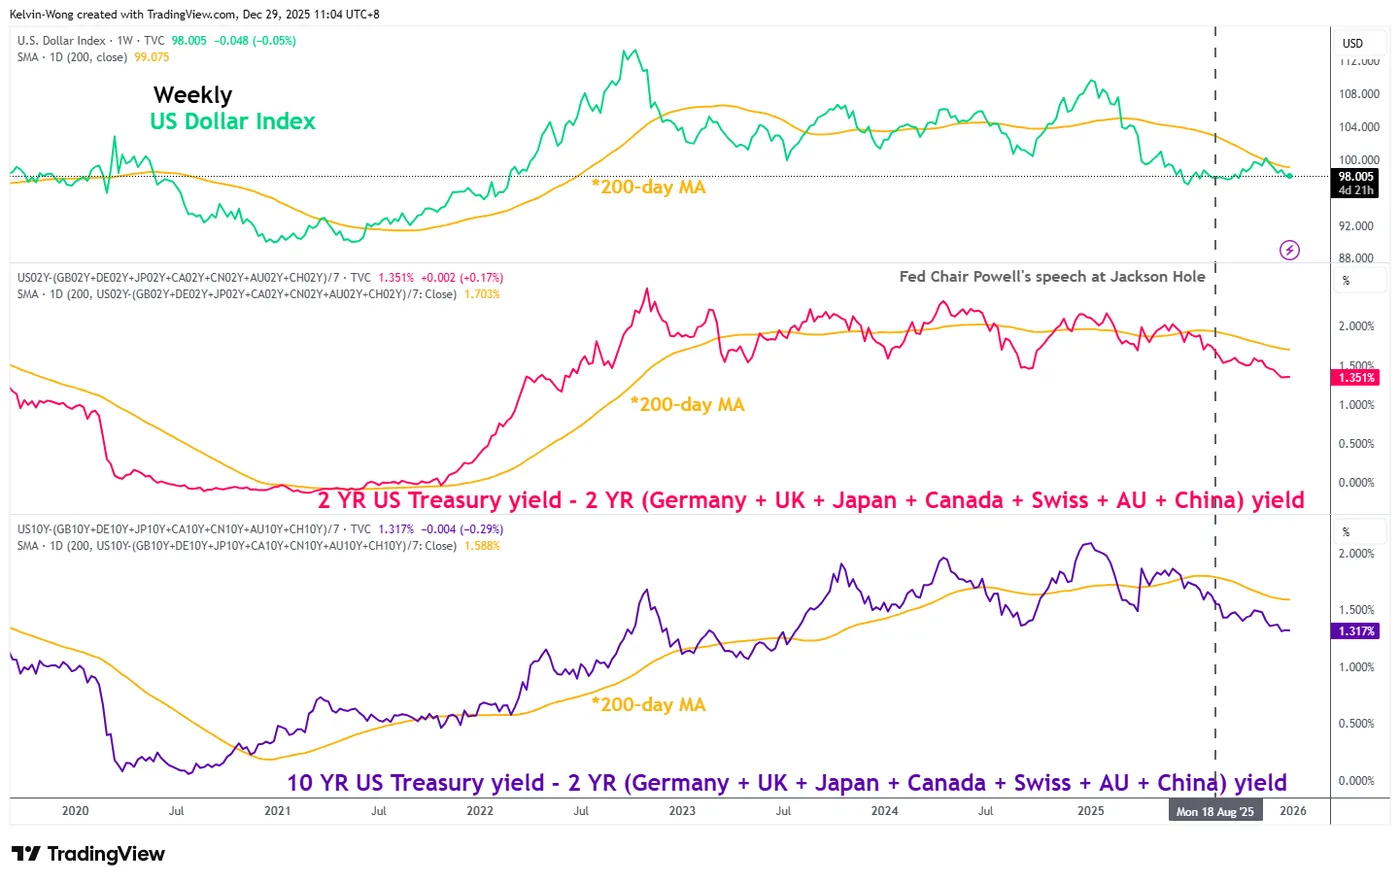
Fig. 4: 2 YR & 10 YR US Treasury/sovereign bonds yield spreads with US Dollar Index as of 29 Dec 2025 (Source: TradingView)
The World Citigroup Economic Surprise Index has extended its upward trend, reaching a 20-month high of 26.80 as of 11 December 2025. Readings above zero indicate that global economic data are consistently outperforming expectations (see Fig. 3).
A rising Surprise Index points to improving global growth prospects, which could encourage greater capital allocation toward non-US assets and, in turn, place downside pressure on the US dollar in 2026. Stronger global growth may also lead developed-market central banks such as the ECB, RBA, and BoC to pause their rate-cut cycles, potentially pushing their sovereign bond yields higher.
As a result, the US Treasury yield premium, the spread between US yields and those of other major economies, could narrow further into 2026, creating a negative feedback loop for the US dollar. Consistent with this, the US Dollar Index has exhibited a strong positive correlation with the yield spread between 2-year and 10-year US Treasuries relative to an equal-weighted basket of sovereign bonds from Germany, the UK, Japan, Canada, Switzerland, Australia, and China (see Fig. 4).
An increase in US liquidity may increase the odds of a weaker US dollar
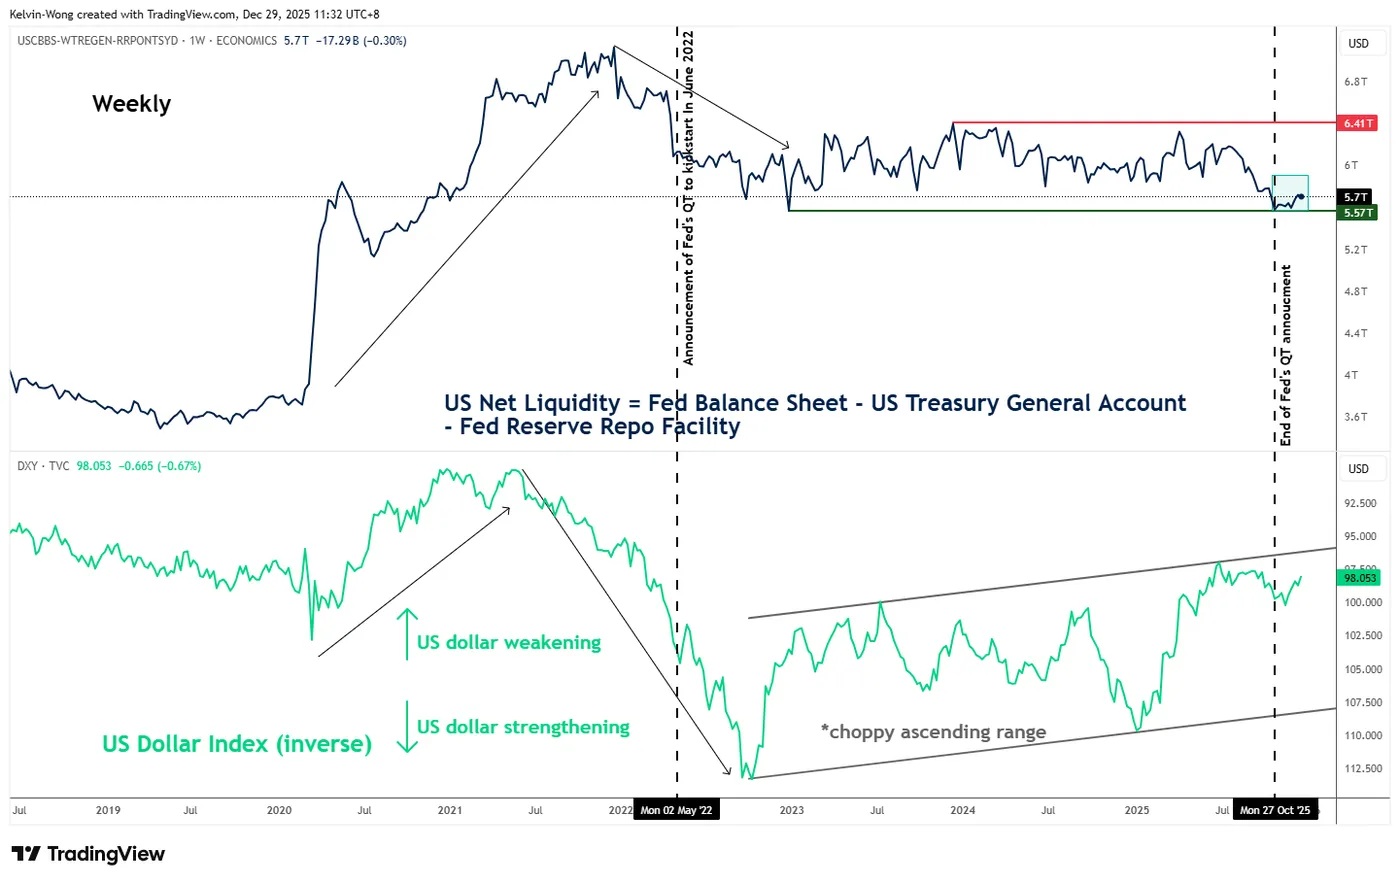
Fig. 5: US Net Liquidity Indicator with inverse of US Dollar Index as of 26 Dec 2025 (Source: TradingView)
The US Net Liquidity Indicator, constructed by netting the Federal Reserve’s balance sheet (liquidity injection) against the combined drains from the US Treasury General Account and the Fed’s overnight reverse repo facility, serves as a useful gauge of liquidity conditions in the US financial system. Historically, the indicator shows an inverse relationship with the US dollar, or a direct correlation with the inverse of the US Dollar Index.
In simple terms, improving liquidity conditions, reflected by a rising Net Liquidity Indicator, tend to weaken the US dollar, while tightening liquidity, signalled by a falling indicator, typically supports dollar strength. As shown in Fig. 5, the Net Liquidity Indicator surged during the COVID period from February 2020 to December 2021, coinciding with a sustained weakening of the US dollar over the same timeframe.
In early May 2022, the Fed announced it would shrink its balance sheet, launching its second round of quantitative tightening (QT) in June 2022. Even ahead of the announcement, the Net Liquidity Indicator had already turned lower between December 2021 and April 2022, which aligned with a sharp rebound in the US dollar from late 2021 through September 2022.
Since June 2023, the Fed’s second QT programme has kept US net liquidity largely range-bound, leaving the US Dollar Index trapped in a choppy, upward-sloping trading range over the same period. That backdrop shifted in late 2025.
At the 29 October 2025 FOMC meeting, the Fed announced the end of QT, effective 1 December 2025, and followed up at its 10 December 2025 meeting with an unexpected restart of Treasury buybacks under its reverse management programme, committing to purchase US$40 billion of short-term Treasury bills per month starting 12 December 2025.
In response, the US Net Liquidity Indicator rebounded from its range low of US$5.58 trillion in the week of 27 October 2025 to US$5.7 trillion as of 26 December 2025, alongside a renewed weakening in the US Dollar Index. If the Fed continues its Treasury bill buyback programme, net liquidity is likely to rise further, increasing downside risks for the US dollar.
EUR/USD exhibits positive elements to resume bullish leg within major uptrend
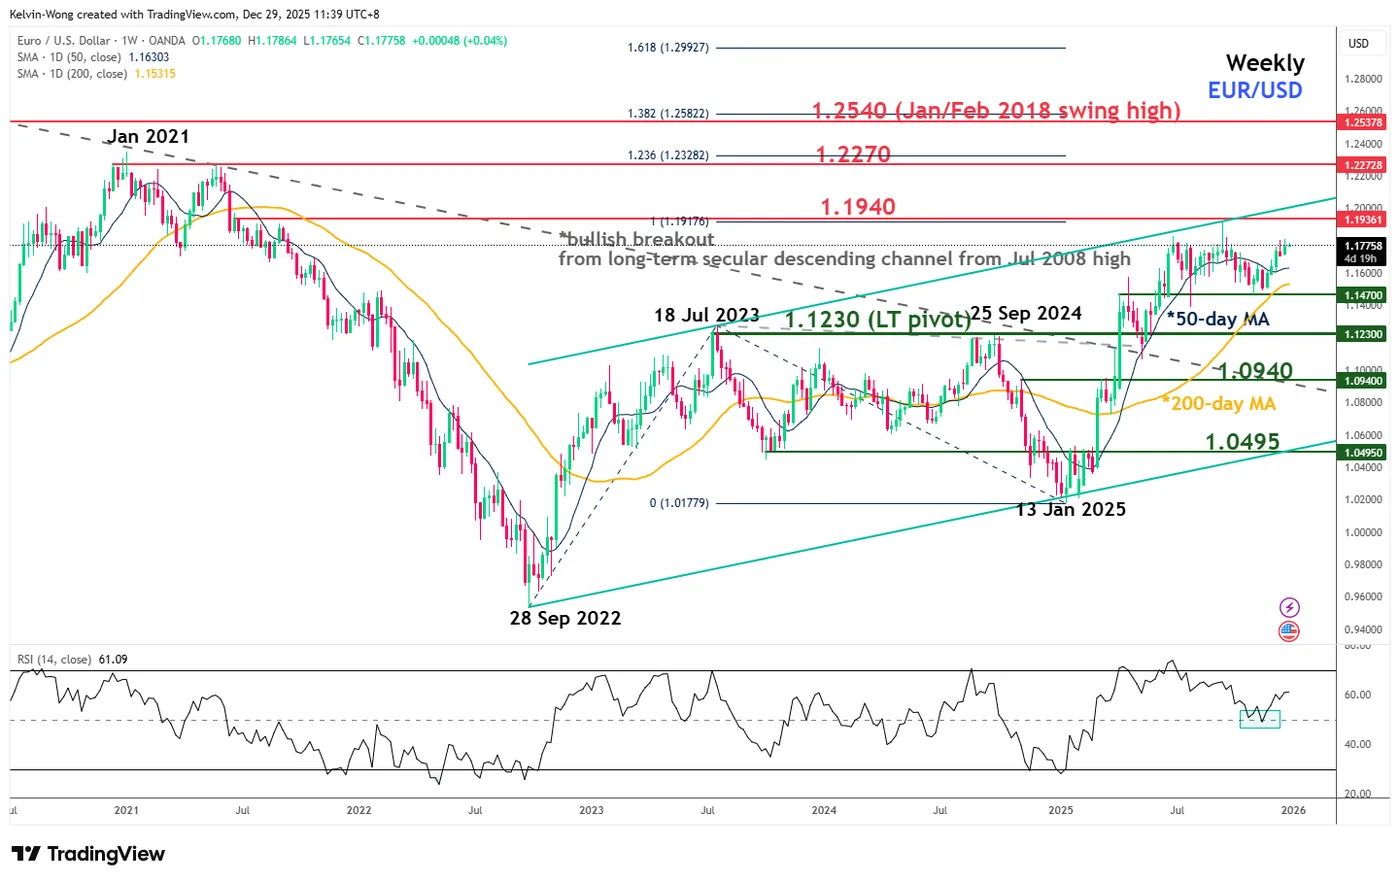
Fig. 6: EUR/USD major trend as of 29 Dec 2025 (Source: TradingView)
The 5-month sideways movement of the EUR/USD from June 2025 to early December 2025 is considered a potential consolidation within a three-year major uptrend phase since its low on 28 September 2022, rather than the start of a major topping process.
The recent price action of the EUR/USD has managed to stage a rebound after a close retest of the key 200-day moving average (around 1.1470) and has reintegrated back above the 50-day moving average in early December 2025 (see Fig. 6).
In addition, the weekly RSI momentum indicator has also staged a corresponding rebound after a retest at its 50 level, which suggests a potential revival of upside momentum for the EUR/USD.
Watch the long-term secular support of 1.1230 on the EUR/USD, and a clearance above 1.1940 sees the next major resistances coming at 1.2270 and 1.2540.
On the flipside, failure to hold at 1.1230 invalidates the bullish bias for a deeper corrective decline to expose the next major supports at 1.0940 and 1.0495 (also the lower boundary of the long-term secular ascending channel).
AUD/USD major bullish breakout from 4-year descending resistance
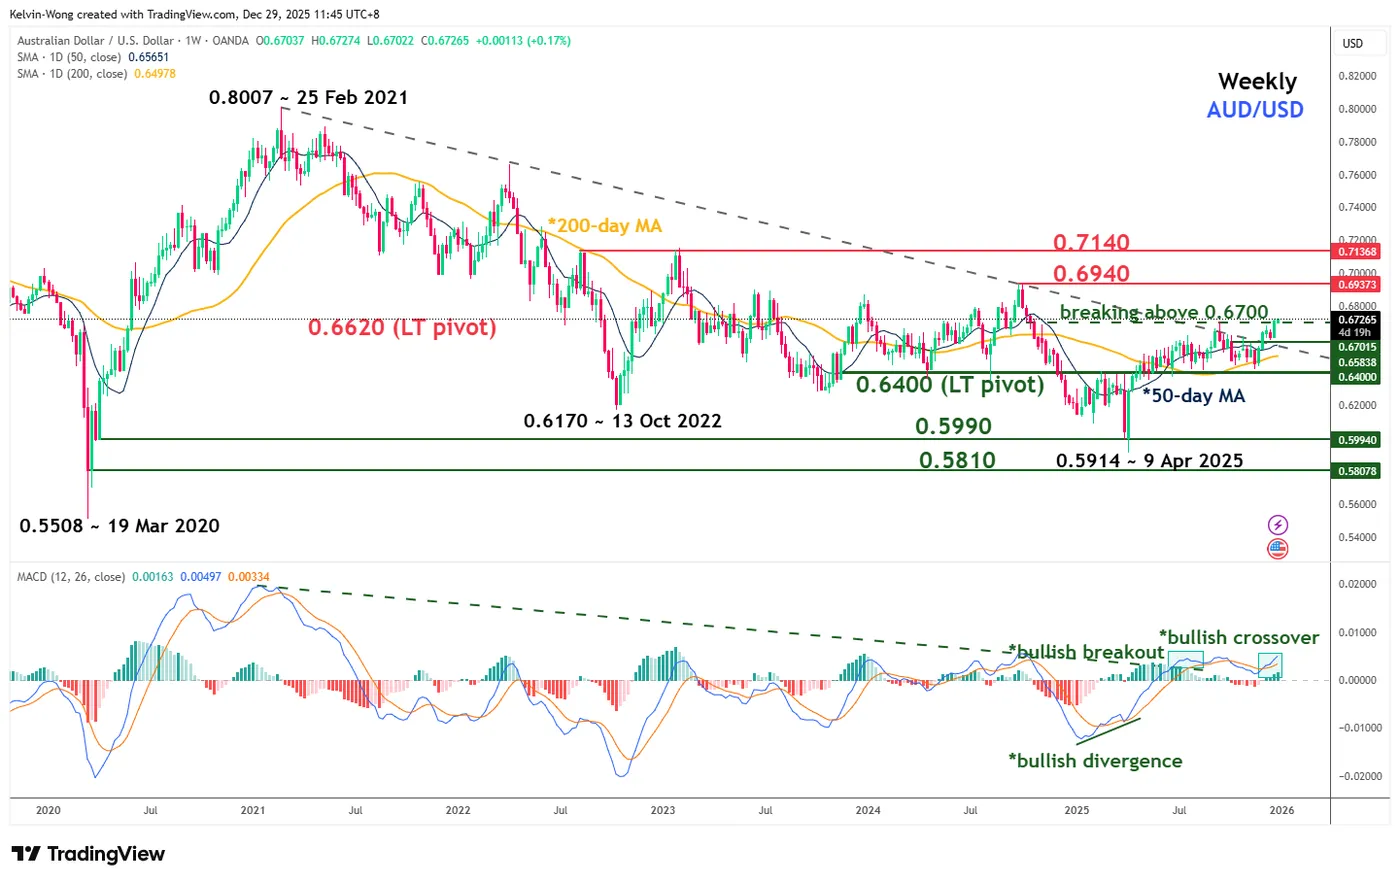
Fig. 7: AUD/USD major trend as of 29 Dec 2025 (Source: TradingView)
The AUD/USD has managed to clear above a major hurdle after 4 months of choppy range consolidation from July 2025 to November 2025 (see Fig. 7).
After a retest on its key 200-day moving average in late November 2025, the AUD/USD has staged a major bullish breakout on the week of 1 December 2025, with a weekly close above a former long-term secular descending trendline resistance from February 2021 swing high now turns pull-back support at 0.6605.
The weekly MACD trend indicator reinforces the AUD/USD’s major bullish breakout, having produced a bullish crossover above its centreline, signalling a potential shift from a sideways phase into a sustained uptrend.
Watch the 0.6400 key long-term pivotal support on the AUD/USD, and right now, it has staged a clearance above 0.6700, where the next major resistances are coming in at 0.6940 and 0.7140 in the first step.
However, a break and a weekly close below 0.6400 invalidates the bullish tone for a resumption of the choppy corrective decline phase to retest the next major support zone of 0.5990/0.5810 (COVID period swing low of March 2020).
USD/JPY potential bearish reversal towards major range support
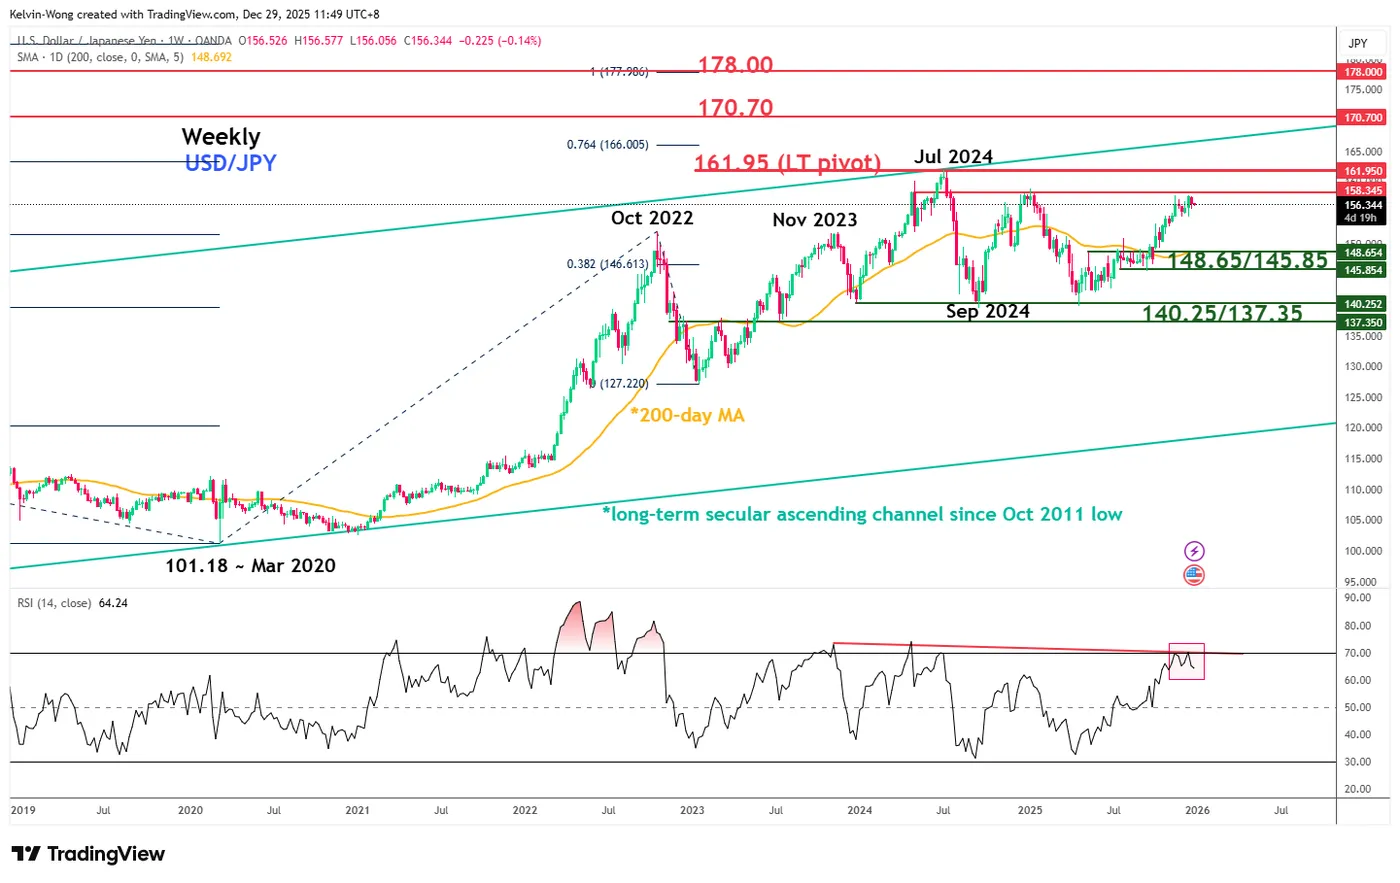
Fig. 8: USD/JPY major trend as of 29 Dec 2025 (Source: TradingView)
Since hitting a 38-year high of 161.95 in July 2024, the USD/JPY has been trapped in a wide sideways range of 15%.
The USD/JPY hit the bottom of the range at 140.25 at the end of April 2025 (ex-post US President Trump’s “Liberation Day” tariffs announcement) and drifted upwards towards the upper boundary of the major sideways range in the second half of 2025.
Right now, it is coming to the tail end of the upper boundary of the major range, with the weekly RSI momentum indicator shaping a bearish reaction at its descending resistance that coincides with its overbought region.
These observations suggest that the multi-month up move of the USD/JPY from April 2025 to December 2025 is losing upside momentum, which increases the odds of a bearish reversal back towards the middle part of the range in the first step (see Fig. 8).
Watch the 161.95 key long-term secular pivotal resistance on the USD/JPY, with the medium-term support zone coming in at 148.65/145.85 (also the 200-day moving average). A break below 145.85 exposes the major range support zone of 140.25/137.35.
On the other hand, a clearance with a weekly close above 161.95 invalidates the bearish reversal scenario for the continuation of its major bullish impulsive up move sequence towards the next major resistance of 170.70 in the first step.