
The May CPI fell –0.7%mth to be up 4.0%yr. Trimmed mean rose 0.4%mth/3.6%yr.
The May CPI fell –0.7%mth to be up 4.0%yr. This was below our estimate of 4.4%yr and market expectations of 4.3%yr. May is typically a seasonally softer month for the CPI. In seasonally adjusted terms, the CPI dipped –0.1%mth, compared with our estimate of +0.2%mth. The key drivers behind the softer May outcome were transport, clothing & footwear and recreation & culture. These accounted for nearly all of the miss in our monthly result. Balancing this was a firmer result in the housing component, with a broad-based pick-up across electricity, rents and new dwelling costs.
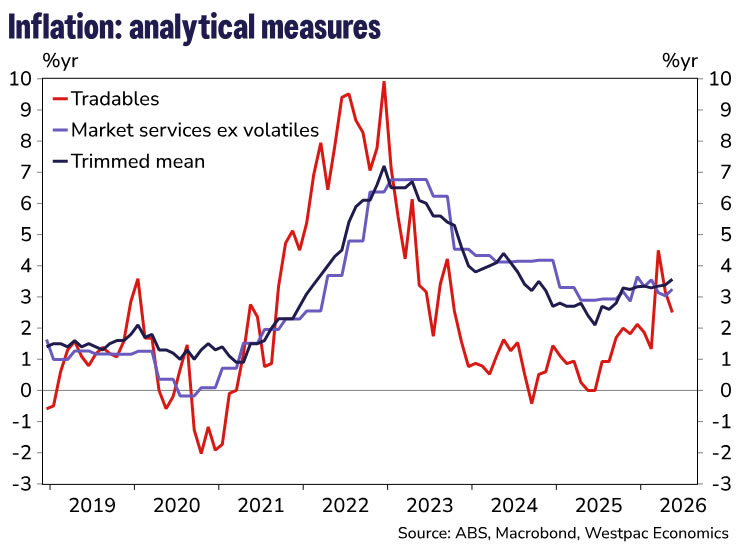
Despite the weakness in the headline, underlying pressures are picking up and suggest second-round effects from the Middle East conflict are broadening. Trimmed mean inflation printed at 0.4%mth and 3.6%yr, this was in line with our expectations but higher than the market’s 3.5%yr. The six-month annualised pace lifted from 3.2% to 3.5%.
In terms of the key surprises to our forecast:
Downside surprises
- Recreation & culture was the key miss, owing to bigger-than expected falls in domestic (–12.1%mth vs –5.5%mth) and international travel (–0.8%mth vs 3.8%mth).
- Clothing & footwear fell by more than expected (–2.9%mth vs –1.8%mth).
- Some of the other areas of weakness were in household textiles (usually weak in May), vegetables and medical appliances.
Upside surprises
- Housing rose 0.5%mth vs 0.3%mth expected. New dwelling costs was the main surprise here, lifting 0.9%mth/5.6%yr, this was the strongest monthly increase since December 2022. We had flagged upside risks here given evidence from price notifications data. Rents rose 0.4%mth against expectations of 0.3%mth.
- Automotive fuel fell by less than expected (–11.9%mth vs –14.5%mth).
The May data provide a stronger signal that second-order effects from the Middle East supply shock are becoming more visible across consumer prices. Oil prices have come off their highs and policy is still dampening parts of fuel inflation, for now, but higher fuel, transport and commodity costs are continuing to feed through to a broader range of categories. This is consistent with firms passing on at least part of the increase in input costs, including energy, freight, plastics and chemicals.
The key question is whether these price increases reverse as cost pressures ease, or whether they persist. Postal costs fell in May, as the fuel surcharge was reduced, showing some pass-through can unwind. But the risk is that pass-through in other areas is stickier, particularly across services. The increase in hairdressing prices, for example, could reflect firms adjusting prices not just for higher fuel and transport costs, but for a broader expectation of higher operating costs. That makes the May outcome less about whether pass-through is occurring, and more about how broad and persistent it becomes.
Today’s trimmed mean outcome came in line with expectations and is on track to rise 1.0% in Q2, taking annual trimmed mean inflation to 3.8%yr. As such, we retain our view that further cash rate increases are coming, with the next hike likely at the August meeting.
The May data reinforce the RBA’s concern that inflation remains too high and that a period of slower growth will be needed to return inflation to target. Even with oil prices off their highs, and other commodity prices easing to a lesser extent, we expect some further pass-through from still elevated fuel and commodity costs over coming months, particularly as policy supports unwind. Wage costs could add further pressure in the second half, especially across market services.
Housing inflation will also remain a key pressure point. It accounts for around 20% of the CPI basket and is typically a source of persistence in trimmed mean inflation. That keeps upside risks front of mind for the RBA and leaves further tightening firmly on the table.


