Week beginning 12 March 2018
- Prospects for the Australian economy; markets; and global risks.
- RBA: Deputy Governor Debelle, Assistant Governors Bullock and Kent speak.
- Australia: Westpac-MI consumer sentiment, AusChamber-Westpac survey, housing finance, NAB business survey.
- NZ: Q4 GDP, current account, house sales.
- China: new finance, retail sales, foreign direct investment, industrial production.
- Euro Area: ECB Draghi speaks.
- US: CPI, retail sales.
- Key economic & financial forecasts.
Information contained in this report current as at 9 March 2018.
Prospects for the Australian Economy; Markets; and Global Risks
I am visiting customers and officials in Hong Kong; Beijing and Singapore next week.
I set out below the Executive Summary of the 70 page document I will be presenting during the visit.
Prospects for the Australian Economy; Markets; and Global Risks
As we contemplate 2018 there are a number of key themes that we believe will dominate economic and market developments. Our advice to customers throughout 2017 has been to expect Australia’s growth rate to likely be anchored below trend in both 2018 (2.7%) and slowing to 2.5% in 2019. That has contrasted with official forecasts (Reserve Bank and Treasury) which anticipate growth picking up to 3.25% in both 2018 and 2019.
We have recognised a solid ongoing boost to growth from non– residential construction; government investment (especially at the state level) and exports. However we are much more cautious than official forecasts on the consumer; residential construction and equipment investment.
Slowing household incomes
Signals from the December quarter national accounts are more encouraging for the official view. Household spending has been revised up from an expected 2.1% to 2.9% following the release of the December quarter national accounts. This picture of households has changed from “lacklustre” to “slightly below trend”. However this was associated with a weak savings rate of 2.7% despite a boost in nominal labour income growth to 4.8% for the year largely due to an extraordinary lift in hours worked of 3.5%. With hours worked increasing so rapidly, labour income growth should have been boosted further but was constrained by wages growth and a drift to lower paid jobs – non-farm compensation per employee remained flat in the December quarter to be up an insipid 1.8% for the year.
Labour productivity fell over the year with GDP per hours worked falling by 1% over the year and unit labour costs growth lifting to 2%. This adverse development in labour productivity is likely to temper the recent strong demand for labour we experienced in 2017.
It is therefore our expectation that there will be a slowdown in the current break neck pace of growth in hours worked over the course of 2018 and into 2019. Weak wages growth and the drift to lower income jobs looks set to continue putting some downward pressure on growth in labour incomes. With the savings rate now probably at its lows, another year of below trend consumer spending growth can be expected.
Business investment
New business investment lifted by 5.8% over the past year, a sharp turnaround from a 6.2% decline over 2016. Over the year, infrastructure work fell 1.2%; non-residential building advanced 12.3% and equipment investment spending increased by 8.4%.
Mining equipment investment lifted by 31% over the year, reflecting the final fit out of three major projects. It is more encouraging that non-mining equipment investment lifted by 6.2% over the year following a slowdown in 2016 partly associated with the uncertainty around the 2016 election. With another Federal Election due by May 2019 and even greater uncertainty associated with that election (conservative government was expected to win the 2016 election whereas the Labour opposition is comfortably ahead in the current opinion polls), we may start to see equipment investment run into some headwinds from the second half of 2018.
Housing downturn
Dwelling investment contracted in 2017 by 5.8%. Based on the downturn in the trend in high rise approvals and a flat outlook for detached housing, we expect this downturn has further to run with the contraction accelerating into 2019. Oversupply and a marked slowdown in sales to foreigners are weighing on the outlook for residential building. House price inflation is disappearing. On a six month annualised basis, prices are now falling in Sydney and Perth and slowing in Melbourne and Brisbane.
The regulator’s macro prudential policies are restricting interest only loans and tighter guidelines for all new loans are slowing house prices and credit growth. In previous cycles the authorities have relied on raising interest rates to slow the highly cyclical housing market. This time, the same effect has been achieved by the regulator as banks have independently raised loan rates; foreign demand has slowed; and regulations have significantly squeezed the availability of credit.
Furthermore, the attractiveness of investment properties has diminished. Land taxes and lacklustre rental growth have tightened rental yields. Prospects of adverse tax changes in the event of a change of government are also impacting investor confidence. Most banks are predicting rate increases while the alternative government is planning to reform some aspects of investor taxes.
We expect a long extended period of flat house prices on a national basis with weakness particularly centred on the Sydney and Melbourne markets. This will represent a considerable change in the “atmospherics” around housing wealth and may weigh further on prospects for consumer spending.
Inflation below target
Inflation is also likely to remain benign holding a little below the bottom of the Reserve Bank’s 2–3% target band. In this regard we are in broad agreement with the Reserve Bank which is forecasting that underlying inflation will hold at 1.75% in 2018 before lifting modestly to 2% in 2019. Note that underlying inflation has held below the 2–3% target band in 2015; 2016 and 2017.
With underlying inflation likely to therefore register five consecutive years at or below the bottom of the target range it is reasonable to argue that Australia is experiencing a structural fall in inflation. Arguably, without the risk of overheating the housing market, interest rates would have been even lower in Australia in recognition of this structural fall and the disappointing progress in restoring inflation to the target range.
Interest rate outlook
We have been of the view through 2017 that the official cash rate will remain on hold in both 2018 and 2019. With rates on hold in Australia and the US Federal Reserve continuing to raise rates, Australia’s cash rate is set to fall below the Federal Funds rate by March. By end 2018, it is set to be 63 basis points below the Federal Funds Rate, and by end 2019, 112 basis points below the Federal Funds Rate.
Sustained period of negative Aus–US rate spreads
The US economy is operating with much less ‘slack’ in its labour market (unemployment rate of 4.1% compared to an estimated full employment rate of 4.5%) than Australia (unemployment rate of 5.5% compared to a full employment rate of 5.0%) but, to date, wage pressure has only recently emerged (three month annualised pace has lifted to around 4%).
Of most concern to markets has been the planned lift in government spending ($300 billion over 18 months) and the Tax Cuts ($1.5 trillion over 10 years) in the US. These policies are likely to boost the Budget deficit by around 2% of GDP providing a solid boost to demand when the economy is already operating at full capacity in the labour market.
We expect three 25 basis point hikes in March, June and September from the FED. That would see the USD/AUD yield differential in the overnight market contract to minus 63 basis points – a situation we have not seen since early 2000. A further two hikes are expected in the first half of 2019.
AUD/USD Bond Spread
Back in August 2017, Westpac had been forecasting that AUD cash rates would fall below the US Federal Funds Rate by around 40 basis points by end 2018. That, in turn, would drive the 10 year bond spread to zero, from around 60 basis points. At that time markets were priced for the US rate to be around 35 basis points below Australia. We now expect RBA rates to be even lower than Federal Funds at minus 63 basis points by end 2018 and minus 112 basis points by mid-2019. The likely result is that AUD 10 year bonds will trade around 30 basis points below US bond rates by mid-2019.
Commodity Prices; China; and the Australian Dollar.
Amid general euphoria around the global economic outlook we suggest caution. The Chinese economy is generally expected to slow as consumption and net exports are unable to compensate for the ongoing slowdown in investment. However, the big uncertainties and risks continue to centre around the Chinese financial system.
Much has been made of the synchronised lift in global growth in 2017. From Australia’s perspective the key development has been the faster than anticipated growth in China. China’s growth rate printed 6.9% in 2017 but we anticipate a decent slowdown in 2018 to 6.3%.
China realises that it must move away from its growth model based on exports and investment. In particular the role of the financial sector must change from channelling high savings at low cost to strategic sectors, to facilitating China’s economic transformation to a more sustainable model based on services and consumption. But the “old” model has resulted in financial assets growing from 260% of GDP in 2011 to 470% in 2016 (IMF, 2017). The excessive growth (around 30% per annum over the last 10 years) has been in the largely unregulated non–bank sector.
In November, President Xi nominated poverty; pollution and financial leverage as his key “challenges”. We expect that the slowdown in growth in the non-bank sector will weigh on commodity prices as speculators are squeezed for funding and local governments, in particular, are restricted in their access to funding for new infrastructure projects.
We are already seeing some evidence of this squeeze on the non– bank sector. Banks are no longer allowed to guarantee wealth management products; entrusted loans (corporates borrowing to lend to other corporates with banks operating as agents) have been banned; rapid growth in short term interbank funding has been slowed; and general funding for wealth management products is being restricted.
These forces are likely to weigh on iron ore and coking coal prices. Some lift in supply from Australian producers is also expected to lower prices. These atmospherics for commodity prices along with the widening interest rate differential are eventually expected to weigh on the AUD. We recognise that capital flows are also critical to the AUD’s prospects. In forecasting, we have endeavoured to accommodate any direct impact of capital flows that is not explained by rates and commodity prices.
We target AUD at USD 0.74 by end 2018 and 0.70 by end 2019.
The week that was
The market has had a lot to ponder, from growth and funding in Australia to trade frictions and rate expectations elsewhere.
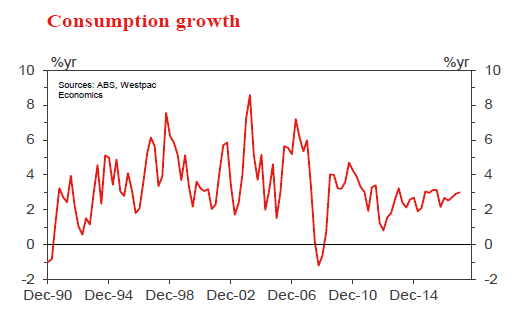
In the National Accounts, Australia received one of its preeminent quarterly releases this week. GDP growth in the December quarter was disappointing at just 0.4% and 2.4% over the year, annual growth down from 2.9%yr in Q3 and below its trend pace of 2.75%yr. Of note however, while the headline outcome was sub-par, the detail was constructive. The main negatives in the release were temporary in nature: a 0.5ppt subtraction from net exports and a 1.0% decline in business investment associated with the winddown of the mining investment boom. Residential construction is an enduring negative (-1.3, 5.8%yr), but one that is offset by the ongoing strength in public demand (1.1%, 4.9%yr).
Most notable for the outlook was an above expectation gain for household consumption (+1.0%yr), and a revision to the prior quarter, from 0.1% to 0.5%. Opportunity for further solid gains in consumption was also seen in the lift in nominal labour income growth to 4.8%yr, the strongest annual gain since mid-2012. These outcomes will provide some comfort to the RBA, being representative of the successive outcomes necessary to see growth lift from below to above trend in 2018. We instead continue to believe that headline growth will hold below trend in 2018 and 2019 as the consumer holds back; business investment takes time to accelerate; and residential construction remains a negative.
Ahead of the GDP release, the balance of payments provided an update of how we fund ourselves as a nation. Historically Australia has funded persistent current account deficits by our banks borrowing funds offshore and on-lending the funds domestically. Post-GFC however, reduced domestic appetite for bank credit and stronger growth in deposits has limited the need for banks to borrow offshore. Rather, the current account has been funded by the purchase of Australian assets by foreign investors.
This flow of capital grew rapidly during the mining investment boom. But foreign investors’ appetite for Australian assets has persisted since, broadening across the entire economy. This capital offered additional support to the Australian dollar. In the second half of 2017 however, it is evident that direct investment’s support for the dollar decelerated materially. Should this nascent trend persist, it will be another reason for the AUD to depreciate to USD0.70 by September 2019 as we expect, in addition to declining commodity prices and the Australian/US interest rate differential. Offshore, trade and rate expectations have been in focus this week.
Since US tariffs on steel (25%) and aluminium (10%) were announced by President Trump at the beginning of March, financial markets have been unsteady. This was all the more the case after a separate targeted action against China for “alleged theft of intellectual property” was mooted and a potential retaliation by Europe against the US (targeting prestige US brands such as Harley Davison) was reported. For the US economy, trade sanctions could derail the benefits of tax reform, particularly with respect to investment. While for the globe, the threat comes at an inopportune time, as a number of indicators of economic momentum begin to plateau (at elevated levels).
Parallels have been drawn to 2002 when then President Bush imposed a tariff in excess of 30% on steel that was met by retaliatory action from other countries. That decision was followed by a sharp fall in the US dollar and US equities. However in 2002, equities had already been moving lower for more than a year after the tech bubble burst and amid 2001’s very weak economic growth. With the US economy currently on a strong footing, today’s circumstances are very different. We remain of the view that global economic strength and diplomacy will win out, and this will allow the FOMC to continue raising interest rates in 2018, most likely three times. Supporting this view, Atlanta Fed’s Bostic stated this week that he has upgraded his fed funds rate view for 2018 from two to three hikes despite headwinds from ‘trade frictions’.
ECB President Draghi provided financial markets with a number of salient points to ponder this week. In response to the continued strength of the Euro Area economy, the reference to potentially increasing the scale of the purchase program was removed from the statement – a first (small) step towards policy being tightened. However, he and the Governing Council also very clearly highlighted that conditions are not yet conducive to policy being tightened. For that to occur, “a sustained adjustment in the path of inflation consistent with its inflation aim” is necessary.
What Draghi said about fiscal policy in Europe and beyond was equally as important. There was a two-part call: to step-up structural reforms; and make use of current momentum to build a fiscal buffer for future use. Draghi was also unusually forthright on President Trump’s tariffs. Opining that “If you put tariffs against what are your allies, one wonders who the enemies are” in Q&A highlights the ECB’s and Europe’s opposition to Trump’s policy.
Chart of the week: Consumer spending
Consumers were the main upside surprise in the December national accounts with a better than expected quarterly result and significant upward revisions. The combined effect has lifted annual growth at 2.9%yr vs our forecast estimate of 2.1%.
The big upward revision to the previously very weak Q3 estimate is particularly notable. The ABS advises that revised tourism spending estimates were the major contributor to the change. Consumption includes spending by Australians abroad and excludes domestic spending by non-residents. Q3 estimates for spending abroad were impacted by changes to passenger surveys with the ‘outbound’ card collection discontinued and only arrivals collected. That added 0.26ppts to Q3 spending.
Note that there is no net effect on GDP due to a matching upward revision to tourism imports. It also explains why national accounts spending estimates are now much stronger for Q3 than retail sales which are unadjusted for net tourist spending.
New Zealand: week ahead & data wrap
Late fade
Next week sees the release of the December quarter national accounts, the last major piece of economic information from 2017. We expect it to highlight that the New Zealand economy, while still growing, has lost some momentum over the last year.
We estimate that GDP grew by 0.6% in the December quarter. That result would bring growth over the 2017 calendar year down to 2.9%, compared to 4% growth in 2016. Population growth was similar in both years – around 2% – so this represents a substantial softening in per-capita growth.
We recognise that next week’s release is not the final word on the economy’s performance. A year ago, the GDP figures appeared to be saying the same thing: that growth had been strong in previous years, but more recently had slowed to barely above zero in per-capita terms. However, at the end of last year Stats NZ published revisions to the recent history of GDP, incorporating better-quality information from annual surveys. The new figures told a different story: growth had in fact remained strong, reaching its peak in 2016.
The figures for 2017 have yet to be subjected to the annual revisions process. But the reported slowdown in GDP growth matches with what else we saw going on in the economy last year – which wasn’t always the case in 2016.
Firstly, the housing market was much more subdued in 2017, following a couple of years of double-digit house price gains. That flowed through into people’s willingness to spend, with the rate of growth in card spending slowing over the course of the year. Secondly, construction activity flattened out last year as the building industry faced constraints on capacity and access to finance. Finally, business confidence fell over the course of 2017 – a move that began even before the new Government was formed.
Coming into this year, a slower starting point for the economy will present challenges for policy makers. Lower than expected GDP could translate into a lower tax take (though so far tax revenue has continued to surprise to the upside of the Treasury’s forecasts). It also raises questions about the economy’s ability to absorb the impact of the Government’s policy changes, such as those around labour laws and housing market speculation. For the RBNZ, lower than expected growth would mean that the rise of home-grown inflation pressures would be delayed even further.
GDP (15 March)
Previously we were forecasting a 0.8% rise in the production measure of GDP. However, we have revised this down to 0.6%, as the last of the sectoral indicators that were published this week were softer than we expected on balance.
Building work put in place rose by 1.4% in the December quarter, a little less than our forecast. Activity continues to slow in Canterbury as the earthquake rebuild work winds down, but it is trending higher in the rest of the country. Residential building work was flat for the quarter, while non-residential building rose. We’ve also assumed that other construction (not covered by the building work survey) will retrace to some extent after a 9% jump in the previous quarter.
The manufacturing survey initially appeared to be positive, with a 1% rise in sales volumes. The main factor was a 17% surge in petroleum manufacturing – but this is not the measure used to calculate GDP. The manufacturing survey is based on deflated sales; this can be unreliable when oil prices move sharply, as they did in the December quarter. For measuring GDP in this industry, Stats NZ surveys production volumes directly from the major players. It’s unlikely that actual volumes rose to such a degree, given that refining capacity is limited.
The remaining details in the manufacturing survey were soft on balance. Manufacturing of machinery fell back after a strong rise in the September quarter, and there were either declines or small gains in wood products, metals and minerals. Food processing was mixed, with fruit and meat up, but dairy and beverages down.
Goods turnover was relatively brisk in the December quarter, with some of the strongest gains seen in the retail, wholesale and transport sectors. However, growth in personal and business services was more subdued. The poor dairying season continued, although milk collections didn’t fall short by as much as they did in the September quarter.
The expenditure measure of GDP is considered to be less reliable as a measure of quarterly growth, but the details are sometimes of interest. For the December quarter, we expect to see solid growth in household spending and business investment, but with much of the growth being serviced by imports. In particular, there was a surge in imports of plant and machinery in the December quarter (which continued into early 2018). These imports have increased the trade deficit for now, but they will add to the economy’s productive capacity over time.
Current account (14 March)
The surge in imports of capital equipment will contribute to an expected widening of the current account deficit over the year to December. We expect a deficit of 2.6% of GDP, from a revised 2.5% in September.
For the December quarter, the surge in imports overshadowed a modest rise in export volumes, leading to an increase in the goods trade deficit. Trade in services remained strongly in surplus, with growth in tourist numbers both into and out of the country. The current account deficit remains well within what we would consider a sustainable range. That is, a deficit of less than 3-4% will stabilise or even reduce New Zealand’s net overseas debt position, relative to GDP.
Indeed, it’s remarkable that the deficit has remained at historically low levels throughout the economy’s upturn. Low global interest rates have played a major part in keeping the country’s net interest costs down. Stronger returns from export sectors such as tourism have also played a role.
But perhaps the most significant factor is that we haven’t seen a repeat of the surge in domestic demand – largely fuelled by offshore borrowing – that characterised the economic boom of the 2000s. Increased regulation and greater caution since the Global Financial Crisis have constrained the growth in overseas borrowing, contributing to a slower but arguably more sustainable economic upswing this time around.
Data Previews
Aus Jan housing finance (no.)
Mar 13, Last: –2.3%, WBC f/c: –1.0%
Mkt f/c: -0.2%, Range: -1.5% to 1.0%
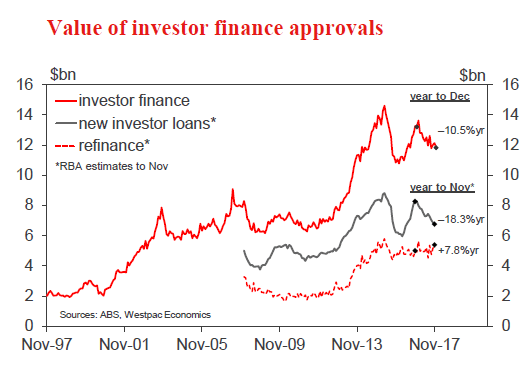
- Australian housing finance approvals posted a soft finish to 2017, the number of approvals for owner occupiers dipping 2.3%. Approvals ex refi were down 3.4%mth but still up 2.1%yr. The value of housing finance approvals to investors also posted a decline, down 2.6% to be 10.5% lower for the year with a notably sharper fall in NSW.
- Industry figures suggest Jan was another soft month for owner occupier approvals – we expect a 1.0% decline. As always, housing data should be treated with extra caution around the summer holiday low period as seasonal adjustment can amplify monthly volatility.
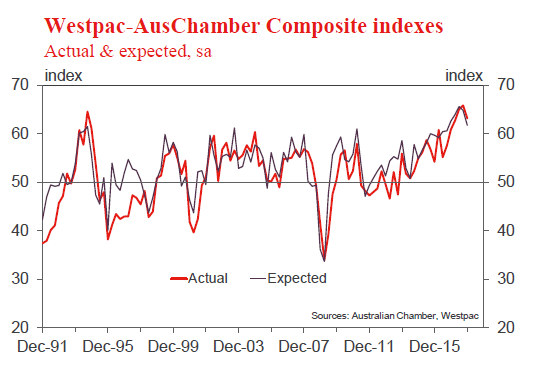
 Aus Q1 AusChamber-Westpac survey of Industrial Trends
Mar 13, Last: 63.4
- The Australian Chamber-Westpac survey of the manufacturing sector provides a timely update on conditions in the sector and insights into economy-wide trends. The Actual Composite tracks a range of demand related measures including investment and employment. The Q1 survey was conducted during February and the start of March.
- In Q4, the Actual Composite moderated to 63.4 from 66.1 in Q3, after a rebound from a dip in June 2015 to 55.1. Strength is centred on a lift in new orders and output as well as increased overtime and an uplift in employment.
- Manufacturing is benefitting from a rise in public infrastructure, non-mining business investment, and stronger world growth combined with a relatively low AUD. However, moderate consumption constrained by low wage growth and intensity from offshore competition are headwinds.
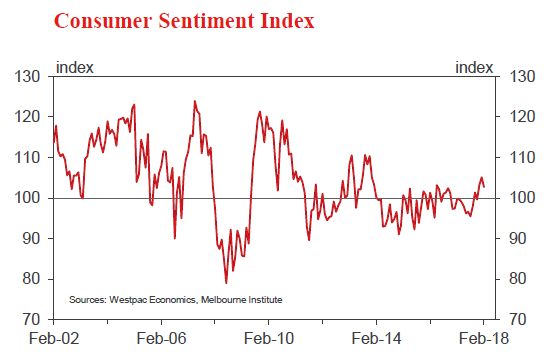
 Aus Mar Westpac-MI Consumer Sentiment
Mar 14 Last: 102.7
- The Westpac-Melbourne Institute Consumer Sentiment Index fell by 2.3% to 102.7 in Feb from 105.1 in Jan. The Feb survey was conducted amid a wave of volatility across global financial markets. Under the circumstances, the slight fall in sentiment is a decent result, particularly given that it leaves the index in net optimistic territory above the 100 mark for a fourth consecutive month – a run that follows a twelve month stretch in which pessimists were in the ascendency for all but one month.
- The March survey is in the field over the week ended March 10. Financial markets have settled down somewhat, the ASX200 up over 2% since the Feb survey. The global backdrop remains unsettled though with increasing trade tensions. Further signs of house price declines locally are also likely to weigh on sentiment.
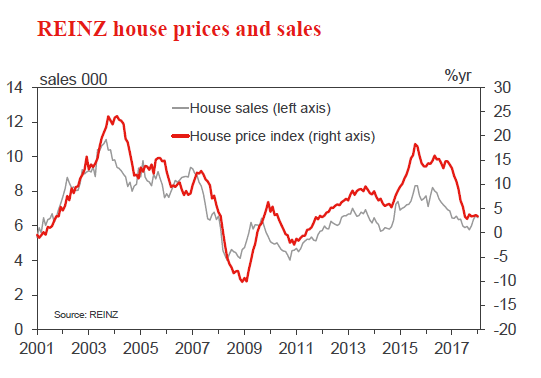
 NZ Feb house sales and prices
- Due the week starting 12 March, Sales last: -2.0%, Prices last; +3.4%yr
- January’s REINZ housing market data was a little softer than the preceding three months. However, housing market data can be choppy on a month-to-month basis, particularly around the holiday season. In addition, monthly sales figures tend to get revised higher over time. We we still think that the housing market best characterised as enjoying a bit of a resurgence at present, following a drop in mortgage rates in late-2017 and the passing of the election.
- With fixed mortgage rates falling further in recent weeks, and the Reserve Bank slightly easing its LVR mortgage lending restrictions, we expect the current market buoyancy to continue for a few more months.
- However, later this year we expect fixed mortgage rates to start increasing, and the Government’s policy program of cooling the housing market will bear on the market. We expect that these conditions will see the housing market slow through the back half of 2018.
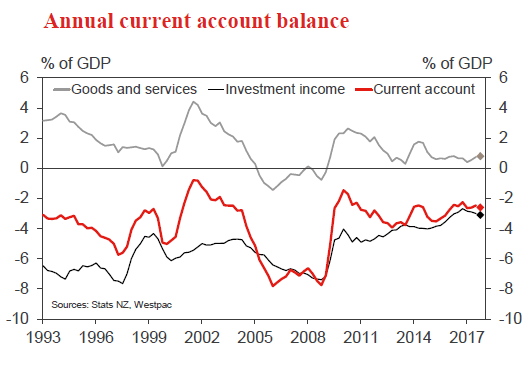
 NZ Q3 current account, % of GDP
Mar 14, Last: -2.5%, Westpac f/c: -2.6%
- We estimate that the annual current account deficit widened slightly to 2.6% of GDP.
- In seasonally adjusted terms, the goods trade deficit is expected to have widened by about half a billion dollars in the December quarter. A modest rise in export volumes was overshadowed by a surge in import volumes, led by imports of capital equipment and vehicles (including two more Boeings for Air New Zealand’s fleet).
- The services surplus was broadly unchanged in the December quarter. There was strong growth in tourist numbers both into and out of the country.
- We expect a slight narrowing of the investment income deficit for the December quarter, with a pullback in profits of overseas-owned firms after a few unusually strong quarters.
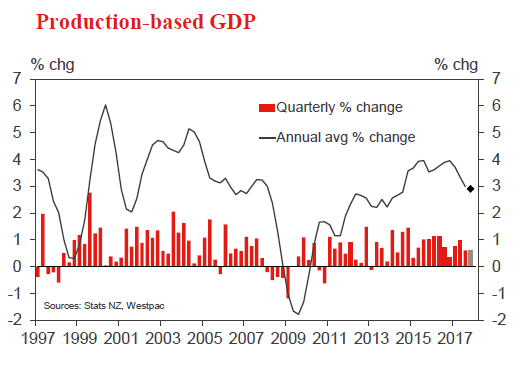
 NZ Q4 GDP Production-based GDP
Mar 15, Last: 0.8%, Westpac f/c: 0.6%, Mkt f/c: 0.6%
- We expect a 0.6% rise in the production measure of GDP. That compares to an average growth rate of 0.8% over the previous three quarters of 2017. With population growth still running strong at about 0.5% a quarter, this would mark the second quarter when growth has been barely above zero in per capita terms.
- There are no obvious one-off factors driving the quarterly result, just modest growth across a range of sectors. Retail and wholesale turnover were relatively brisk, but the services sectors were generally subdued, milk production fell, and the construction sector faced constraints on growth.
- For the year as a whole, we expect the growth rate to slow to 2.9%, compared to a peak of 4% growth in 2016.
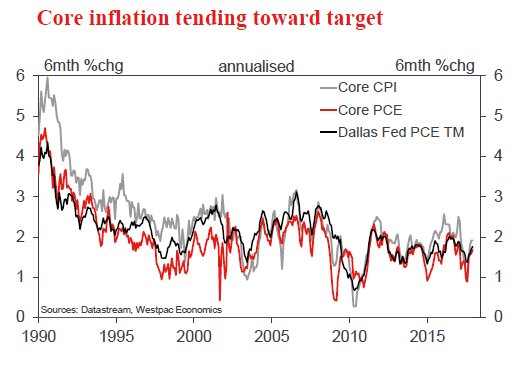
 US Feb CPI
Mar 13, last 0.5%, WBC f/c 0.3%
- The January headline monthly outcome of 0.5% was the strongest since early 2013 and materially above target if annualised. That said, a similar gain a year ago dropped out of the annual growth calculation, leaving it unchanged at 2.1%yr.
- A large contributor to inflation in the month, and indeed over the past six, was energy prices. In January, the energy index rose 3.0% as gasoline prices gained 5.7%.
- That said, a noticeable acceleration in core inflation (ex food and energy) has also been evident. Having recorded a 1.1% annualised gain in the six months to July 2017, core inflation has since accelerated to a 2.6% pace.
- Come February, energy won’t be a key contributor, but core pressures will remain, resulting in a price gain circa 0.3%.
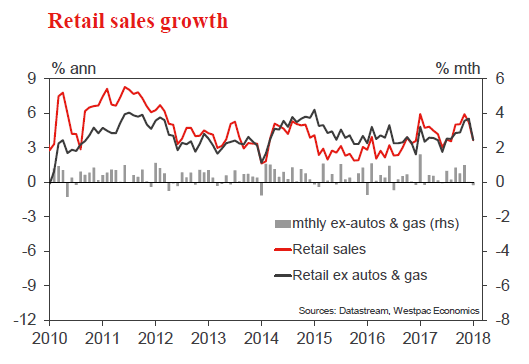
 US Feb retail sales
Mar 14, last -0.3%, WBC f/c 0.4%
- Retail sales were a major disappointment in January, recording the weakest outcome in 11 months as households cut back on auto purchases and building materials. A downward revision was also made to the December outcome, exaggerating the weakness.
- It is worth noting that, excluding these more volatile items, core retail sales were also soft, a flat outcome in January following a revised 0.2% decline in December. Coming at a time of strong confidence and employment growth, the outcomes jar with the market’s strong narrative.
- Come February, we anticipate spending will pick up. However, at less than 5% annualised, it is an outcome best regarded as solid not strong. For consumption to accelerate further, wage inflation will have to strengthen across the economy and confidence hold up.