
Highlights
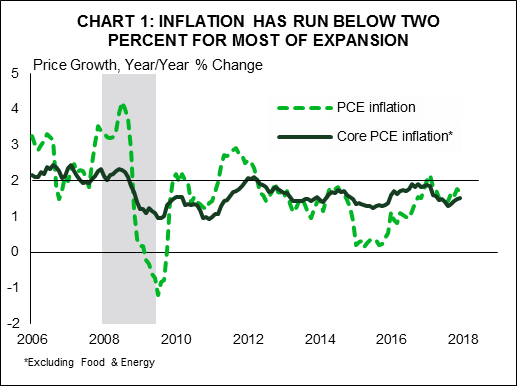
- The recovery from the Great Recession has been characterized by low inflation. Since it ended in 2009, PCE inflation (the Federal Reserve’s preferred measure) has averaged just 1.6%. Inflation rose above 2% only briefly in 2012 before dipping back below it again.
- The weakness in U.S. inflation reflects several factors including: cyclical elements – a rising U.S. dollar, declining energy prices, and soft global growth; idiosyncratic elements – new cell phone contracts and the Affordable Care Act’s dampening effect on health care prices; and structural elements – increased digitization and retail competition.
- Soft inflation has contributed to the low level of interest rates and gradual policy response from the Federal Reserve to normalizing monetary policy. Higher inflation should give them the confidence to continue to raise rates, potentially offsetting some of the positive impact of fiscal stimulus.
Inflation, as measured by the Federal Reserve’s preferred metric – the core personal consumption expenditures (PCE) deflator – has been running below 2% since January 2012 (Chart 1). Recognition that inflation has come in below its long-run objective has been a key feature of the Fed’s policy communique for several years. It remained there in the most-recent statement in March.
Still, the Fed’s characterization of inflation has begun to shift. The March statement noted that “inflation is expected to move up in coming months” – marking to market the momentum we have seen in the price data recently. Over the past six months, core prices have risen 2.0% (annualized). Federal Reserve members’ median projection for core inflation is for it to move above 2.0% in 2019 (to 2.1%) – the first time it has ever crossed this threshold.
As the Fed projections imply, there is a good case that we are at pivot point with respect to price pressures. Yes, we know, economists have said this before! There are several factors unfolding that differentiate this point in the economic cycle. First, many of the headwinds to inflation over the past several years – the decline and subdued recovery in commodity prices, soft global demand growth, a rising U.S. dollar – have turned to tailwinds over the past year. Second, idiosyncratic factors that have depressed consumer prices (such as changes to cell phone contract offerings) will fall out of the data in the next few months. Third, there’s a new kid on the block: fiscal stimulus. Economic growth is projected by the vast majority of forecasters (including us) to move well above its trend rate. Capacity pressures are building, nowhere more evident than in an unemployment rate that is likely to hit a 50 year low this year or next. This is an important layer to inflation pressures, which will be further nudged by tariff action and negative trade rhetoric that adds a final upward dimension to price pressures.
There are some factors that should mitigate the speed of adjustment. For instance, corporate tax cuts give businesses additional margin to absorb some of the rising cost pressures, while digitization will keep the dial turned up on competitive pressures. However, these factors argue against a sudden jump to a much higher inflation rate. They do not argue for these forces to completely offset the rising tide. Consumer price inflation should finally surpass the Fed’s 2% target over the next year.1
Global backdrop is no longer disinflationary
The weakness in price growth has not just been a U.S. story. Inflation has disappointed across advanced economies and has decelerated in emerging markets over the past several years. The slowdown in global inflation was echoed in a disappointing pace of global growth. This was particularly true in Europe following the sovereign debt crisis, but extended to emerging markets through trade channels and commodity prices.
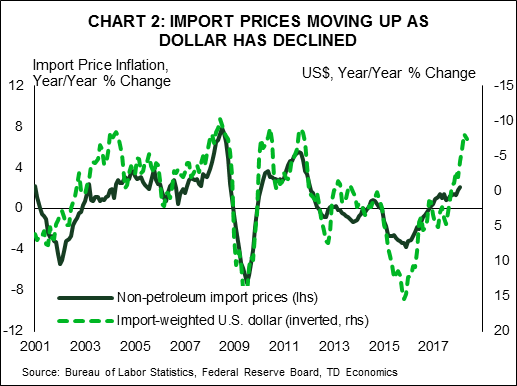
The past year has brought a sea change in the performance of global economies relative to expectations. Rather than disappoint, economic growth has exceeded forecasts. This has led the U.S. dollar to depreciate even as America’s economic growth prospects have faced a rapid-fire of upgrades due to fiscal stimulus. Since the end of 2016, the trade-weighted U.S. dollar has fallen close to 8%.
This, in combination with more robust global economic activity, should place greater upward pressure on U.S. prices from external channels. Import prices are already capturing these influences (Chart 2). The pass through to consumer price inflation has been mild up until now, but is not absent. Items with higher imported content, such as clothing, saw price growth accelerate rapidly in January and February.
 It’s possible (and reasonable) that the greenback will face bouts of upward pressure in the near-term, but the majority of currencies are still trading at a discount to their fair values (Chart 3). We anticipate a further modest depreciation in the U.S. dollar over the next year or, at the very least, for any upward pressure to prove fleeting. As there are lags from when import price pressures pass-through to consumers, the lower valued greenback should raise core consumer inflation (excluding food and energy) by 0.2 percentage points over the next twelve to eighteen months.

Idiosyncratic factors are fading
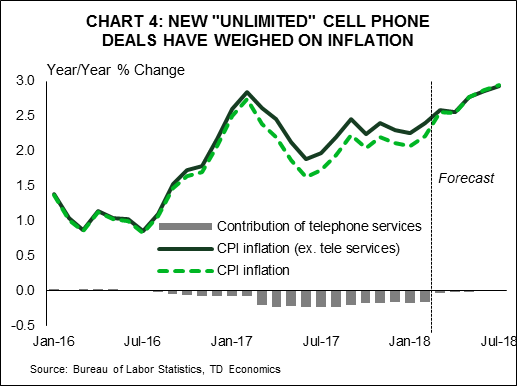
Another idiosyncratic weight on inflation is also coming to an end. Consumer price indexes over the past year captured unusually large downward pressure from relative small components that had swung deeply negative. In particular, telephone service prices fell 5.0% (month-on-month) in March last year, which was immediately followed by another large stepdown of 1% in April. Competition saw new wireless phone companies offer discounted unlimited data plans. While telephone services make up only 2% of the CPI basket, the large and sudden price swing saw it subtract 0.2 percentage points from inflation over the past year. This one-time price decline is unlikely to be repeated and is about to fall out of the year-over-year inflation calculation (Chart 4).
 This isn’t the only influence that will be reversing course. The Affordable Care Act (ACA) had placed downward pressure on healthcare-services inflation since 2008, captured in lower prices for physician and hospital services. As a result, healthcare price growth has averaged just 1.7% annually over the past decade, compared to 3% the decade prior. Moreover, the contribution to PCE inflation from healthcare has been about 0.3 percentage points lower over this time frame relative to the earlier decade.2
Recently, however, healthcare inflation has moved higher. In January, it was up 2.0% year-on-year, with even stronger gains in the hospital category. Increases in the Medicare payments schedule are expected to lead to higher health care prices over the next year.3 Moreover, some of the legislated cuts in Medicare payments are set to expire in 2019, potentially leading to further increases. While healthcare price growth may not return to rates seen prior to the financial crisis, its disinflationary impact looks to be a thing of the past in the absence of another policy change.
The Phillips curve (still) isn’t dead
Up until now, the discussion has been focused on features that will cease to depress inflation. However, these influences will be layered on top of a grand theme that will carry the bigger influence: a continued improvement in the economy and labor market. We have looked at the relationship between unemployment and inflation (known as the Phillips curve) through several lenses in past reports, including across states (here) and countries (here). All of this analysis dispelled the belief that the Phillips curve is dead. We estimate that the coefficient on the “output gap” (the gap between unemployment and its natural rate) is in the range of 0.1% to 0.3%. This means that every 1 percentage point move in the unemployment rate (relative to its natural rate) should move inflation by roughly 0.2%.
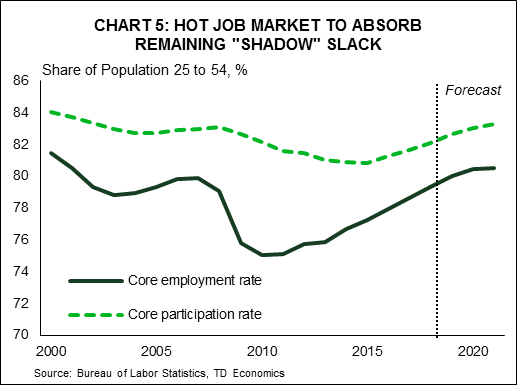
This may seem small on the surface, but is becoming an important figure at this point in the business cycle. With fiscal stimulus expected to boost economic growth to around 3% over the next two years, the unemployment rate is likely to reach lows not seen in the United States in 50 years. While there is some debate about how low the structural rate of unemployment actually is, it’s fair to say that at 3.7%, the rate would be in the neighborhood of 0.5 to 1 percentage points below its natural rate. Embedded in this view is the continued absorption of “shadow slack” that has helped keep wage pressures at bay up until now.4 The participation rate of the core-working age people (25 to 54) has trended steadily up over the past two years, and will return to its pre-recession peak by the end of 2019 (Chart 5).
 When combining the influences of waning idiosyncratic price influences alongside strengthening tailwinds from economic pressures, it’s becoming harder and harder to stay in the no-inflation camp. In fact, it would be a leap of faith to expect consumer prices to remain completely unresponsive. We estimate that tightening labor markets will lift inflation by between 0.1 to 0.3 percentage points, with close to half of this coming from the impact of fiscal stimulus.
Tariffs will not help
As if the inflation tailwinds weren’t already gathering force, enter the trade winds. We assessed the economic impacts from the Trump administration’s recently announced tariffs in recent reports (here and here). In addition to tariffs on steel and aluminum, The Trump administration has announced a package of tariffs targeting $50 billion or more of Chinese imports annually. While the details of which products most impacted are forthcoming, the U.S. administration has announced that it will target imports of aerospace, information and communications technology, and machinery. This is likely to add further to inflation over the next two years. All told, these tariffs are likely to raise inflation by 0.1 to 0.2 percentage points annually over the next two years.
These are not the only trade winds flowing through consumer prices. Tariffs have also been placed on Canadian softwood lumber and on washing machines and solar panels from Asia. These are small items in the consumption basket but will also add (albeit marginally) to price growth over the next few years.
Bottom line
U.S. inflation is at a turning point. As headwinds to price growth turn to tailwinds, inflation is likely to turn higher. A higher inflation rate has a number of important implications for investors and economy watchers. First, it means the Federal Reserve will continue to raise its key lending rate possibly even above its intended terminal rate in order to keep inflationary pressures contained. Second, it will counteract some of the fiscal stimulus and enthusiasm around the benefits of tax cuts, particularly on the personal side. Households will face higher interest rates and higher prices, eating into the gains from tax cuts. Third, higher inflation may require a higher risk premium for inflation to be built into longer-term yields, putting pressure on highly-leveraged corporate borrowers and mitigating the salutary effects lower corporate tax rates on investment.
End Notes
- As measured by the price index for personal consumption expenditures (PCE). CPI inflation sat at 2.3%(year-on-year) as of February, 2018.
- The impact is more pronounced on the PCE index than in CPI due to the fact that PCE includes healthcare items that are not directly paid for by households.
- Mahedy, Tim and Adam Shapiro (2017). “What’s Down with Inflation.” FRBSF Economic Letter. 2017-35 (November 2017) https://www.frbsf.org/economic-research/files/el2017-35.pdf
- Hong, Koczan, Lian, Nabar (2018). “More Slack than Meets the Eye? Recent Wage Dynamics in Advanced Economies” IMF Working Paper. WP/18/50 http://www.imf.org/~/media/Files/Publications/WP/2018/wp1850.ashx


