
Most gold bulls have been holding on to long positions for months, if not years anticipating the next big breakout. It was almost one year ago when gold made a successful break above the six-year trendline resistance, extending from the $1921 high. But how long must we wait for a clear break above $1400?
What we already know
Gold attempted and failed to break above $1390-1400 in more than 6 occasions over the past five years. I have argued in favour of the fundamental case supporting further advances in gold in previous articles including; ‘Can Yields Stop Gold?’ and ‘Under The golden Hood’. The rationale remains valid.
The Technical case continues to be generally supported by a combination of multi-year inverted head and shoulder formation (currently we are alongside the neckline), double dosage of weekly golden crosses (100 week moving average crossing above the 200 week moving average and the 55-week moving average above the 100-week moving average) and 2 ½ years of uninterrupted higher lows.
Look for Sentiment Breakout
Looking at the commitments data of futures speculators at the Comex, net longs in gold can shed valuable light on future moves in the spot price of bullion. Specifically, triangle breakouts have proven effective (in the case of gold and EUR longs vs USD commitments) in signalling breakouts in the spot price. At times, the breakout in net longs occurred 3-4 weeks before in that of the spot price.
The charts below highlight two prominent cases when the breakout in gold speculative positioning offered a clearer signal than that shown in the spot price, as seen in December 2002 and September 2007. In both cases, the ascending price momentum served as a confirmation for the move in the futures market.
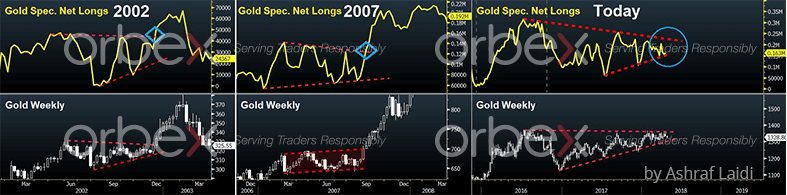
Today, the triangular wedge patterns are prominent in both of the net longs and the gold price. Specifically encouraging is that bullion is near 5-year highs while net speculative longs are well below the record high, suggesting there is more durable demand than speculative interest behind the gold rally.
Combining the structure of the ascending pattern in the spot price and ensuing neckline, $1520 remains a viable target for this year. Will the breakout in speculative interest trigger the signal? Stand by for the answer in late May – early June.


